Must read for Unit 2.
Get Started for FREE
Sign up with Facebook Sign up with X
I don't have a Facebook or a X account

 Your new post is loading... Your new post is loading...
 Your new post is loading... Your new post is loading...
Each bubble in this chart represents an American chain restaurant (or in one case, a store).
Political scientists believe most elections can be predicted with just a few pieces of information.
Watch campaign ads in the 2012 presidential campaign and track campaign ad spending by candidates and interest groups.
Kelsey Von Berge's curator insight,
March 6, 2014 8:43 AM
I think this map is interesting, especially to see who spends the most money. Campaigns cost a lot of money, and some of the totals are pretty shocking. Spending a lot on tv advertising is risky, but if it pays off, you can win your election.
The 58% of registered voters aged 18 to 29 who say they will definitely vote this fall is well below 2008 levels and is the lowest for any major subgroup. |
Okay, this has absolutely nothing to do with AP GOPO, but I thought it was worth sharing with you b/c it highlights the use of Twitter.
Eighteen-year-old Laura Robson, ranked 89 in the world, punches well above her weight on Twitter. Read this blog post by Sree Sreenivasan on SreeTips.
Hover over the graphic to reveal total compensation packages for 558 chief executives of trade associations, labor unions, interest groups, think tanks, and other nonprofits with a significant presence in Washington.
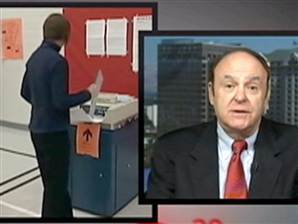
The Daily Rundown: National Popular Vote's John Koza explains how his group's plan would end the electoral college process and change the way we elect a president. 10 minute video
Campaign finance data and analysis for the 2012 presidential election.
A look at the battleground states in the 2012 presidential race. |


