

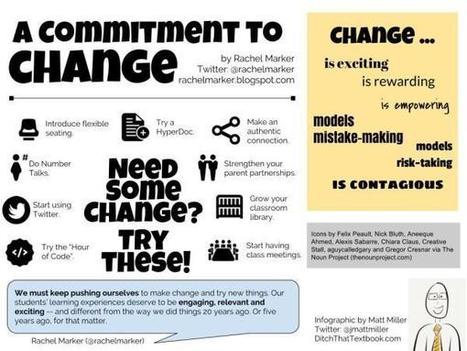

Infographics are visually stimulating and force us to summarize well. What if we did more infographics in schools and less research papers?
Via Tom D'Amico (@TDOttawa)
Get Started for FREE
Sign up with Facebook Sign up with X
I don't have a Facebook or a X account


 Your new post is loading...
 Your new post is loading...
Your new post is loading...
Infographics are visually stimulating and force us to summarize well. What if we did more infographics in schools and less research papers? Via Tom D'Amico (@TDOttawa) 

Martha Bongiorno's curator insight,
December 2, 2016 9:53 AM
I love this idea! It is perfect for Project-Based/Problem-Based Learning...I do caution against moving away from research papers to just infographics, though. I think using more infographics in social studies or science would be beneficial.

Simon J Condon's curator insight,
December 2, 2016 2:19 PM
A tool to use for great visual presentations of information
Sign up to comment
|
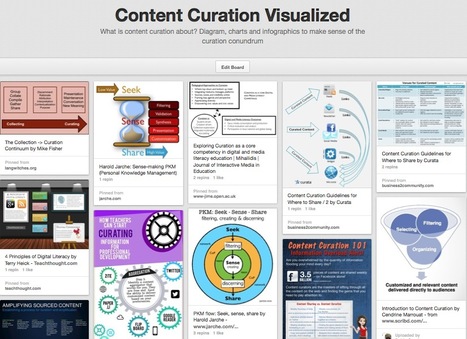
What is content curation about? Diagram, charts and infographics to make sense of the curation conundrum Via Robin Good, Kim Flintoff, catspyjamasnz, Joyce Valenza
GwynethJones's insight:
WOW! A great collection of infographics all around curation!

Monica S Mcfeeters's curator insight,
March 30, 2014 9:18 AM
This will be helpful to share to those wondering about content curation. 
Jeff Domansky's curator insight,
September 1, 2014 11:53 PM
Valuable collection of the art of curation from Robin Good. |


Infographics as PBL. LOVE this idea!