


Free resource of educational web tools, 21st century skills, tips and tutorials on how teachers and students integrate technology into education
Via Tom D'Amico (@TDOttawa)
Get Started for FREE
Sign up with Facebook Sign up with X
I don't have a Facebook or a X account


 Your new post is loading...
 Your new post is loading...
Your new post is loading...
Free resource of educational web tools, 21st century skills, tips and tutorials on how teachers and students integrate technology into education Via Tom D'Amico (@TDOttawa) 
No comment yet.
Sign up to comment
Free resource of educational web tools, 21st century skills, tips and tutorials on how teachers and students integrate technology into education Via paul rayner
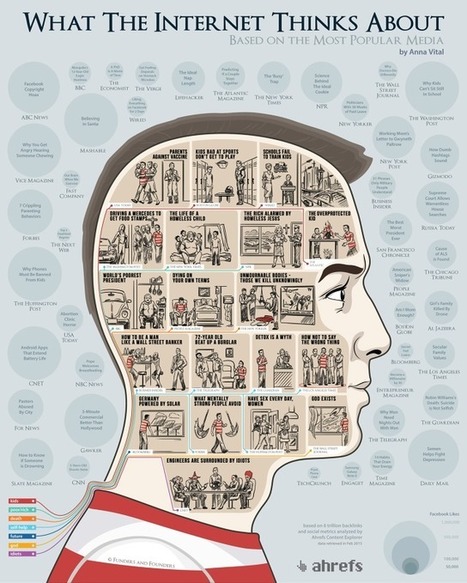
What does the Internet care about? What articles do we share the most? Using the data from the Ahrefs Content Explorer, the people at Funders and Founders Via Lauren Moss

Emilio Ruano's curator insight,
May 4, 2015 1:17 PM
At least, the concern about equality, energy and social welfare is there. I like the last one about engineers tho. Hahaha. 
Mackenzie Hamilton's curator insight,
October 13, 2015 8:36 AM
I think this article is awesome because they use data visualization to show what people share the most, visit the most, and search the most. Data is everywhere and people are using it everyday and sometimes don't even think about it.
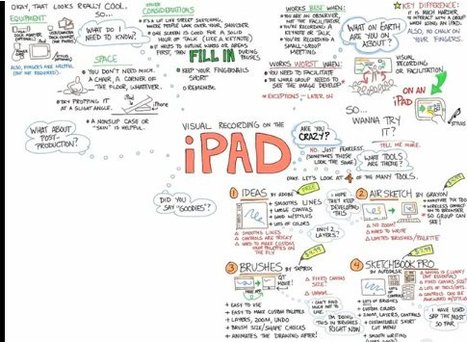
How To : Visually Record Ideas Using an iPad Visual recording is similar to audio recording: they both use the same concept that is : recording. One uses voice and the other uses visual cues like diagrams, charts, lines, arrows...etc. Think about visual recording as visual mind mapping. This is Visual Recording and NOT (in this case) Visual Facilitation Via Shamblesguru

Jessica Laney Petty's comment,
June 26, 2013 3:48 PM
Thanks for the video. These storytelling videos are great. http://sandiegoweddingplaces.com
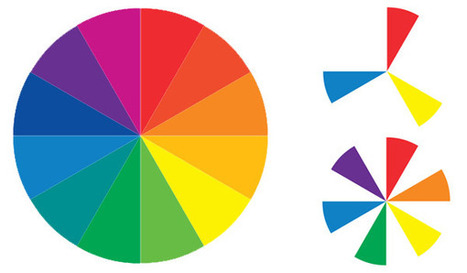
Sometimes the toughest step in building a new website or redesign can be the conceptual ones. Selecting a color palette is one of them that can be tough if you don’t have the right tools. So where do you start?
It all comes down to basic color theory and the color wheel. That same tool that teachers used in school really is the basis for how designers plan and use color in almost every project from the simplest web page to expansive brands with multiple sites and campaigns... Via Lauren Moss
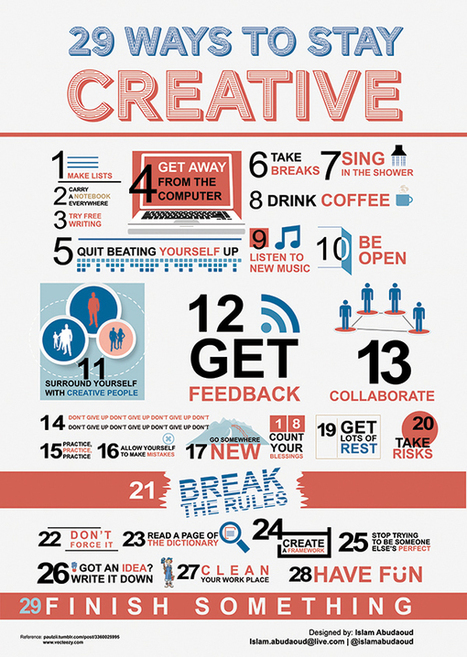
Creativity is defined as the ability to create, but sometimes, we seem to lose that ability all of a sudden. Via Lauren Moss

bancoideas's curator insight,
March 4, 2013 9:36 AM
Existen muchas de estas infografías con tips para ser, volverse, o mantenerse creativo, y para serte francos, nos gustan todas! =) |
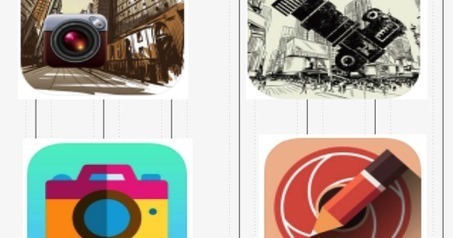
"Below is a collection of some handy iPad apps students can use to create cartoon-style visuals. The apps are easy and simple to use and provide a wide variety of functionalities to help users make the best of their sketching experience ..."
Via Leona Ungerer
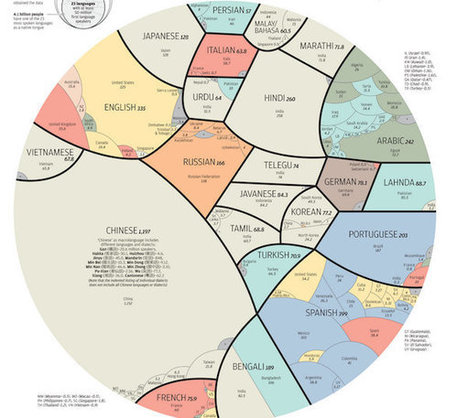
Graphics director Alberto Lucas Lopéz has created the following infographic for South China Morning Post, depicting languages as populations. Via Lauren Moss
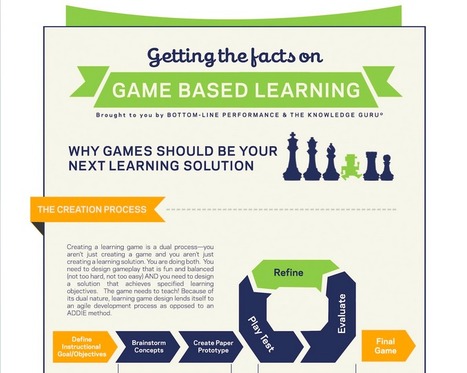
The Knowledge Guru team knows how effective serious games and game based learning are, that's why we've developed an entire learning game engine focused on making game based learning easier to impleme... Via Beth Dichter

Florence HENCKE's comment,
August 9, 2013 3:10 AM
Thank you for this infographic and the sources you used, the importance of having fun while learning seems to increase in education. Good news !

Ines Evaristo's curator insight,
August 21, 2013 6:53 PM
Una buena infografía que resume estudios con resultados del efecto de los videojuegos en el aprendizaje de la educacion superior, cosa que no habia visto mucho. Además, el inicio es bastante claro, hacer un videojuego "serio" o educativo es doble reto: lograr los objetivos de aprendizaje propuestos y diseñar un gameplay igualmente divertido, motivador, estimulante... es la diferencia entre un videojuego educativo de un juego didactico. 
Taryn Coxall's curator insight,
October 8, 2013 10:24 PM
This article gives great insight into the upcoming phenominon of "Game Based Learning".Although i have never seen it in my practises, after reading abit about it, i believe game based learning is something i would incoperate into my own classroom. Game Based learning provides a stimulating and engaging way of learning for children on a wide range of educational areas and topics. It is proven through this approach to learning students aremore likely to become motivated to learn, become increasingly engage and excel in their learning. great resource which has iven me great insight.
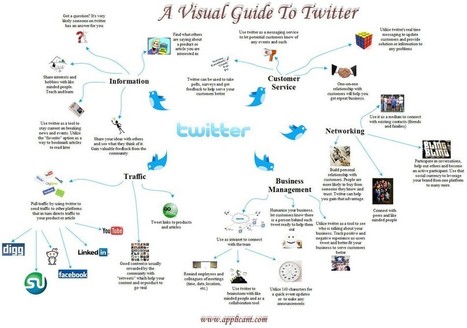
This infographic provides a visual guide and a brief synopsis of different uses for Twitter. It includes information about how Twitter can be used as a tool for information, customer service, networking, business management and website management. Via Lauren Moss, Kim Flintoff
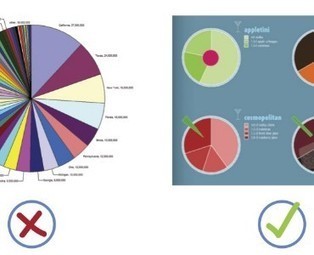
When it comes to visualizing data, it’s important to pick the right graph and the right kind of data range. Make it too detailed, and information gets lost and the reader leaves confused. Too simplified, and your data’s integrity is weakened.
Choosing the right infographic element shouldn’t be an art but common sense. After all, it’s an infographic – readers should get the gist of things at first glance and not have to get crossed-eyed in making sense of things... Via Lauren Moss

Lauren Moss's curator insight,
April 10, 2013 6:55 AM
General reference for basic visualization design elements, applications, and best practices...
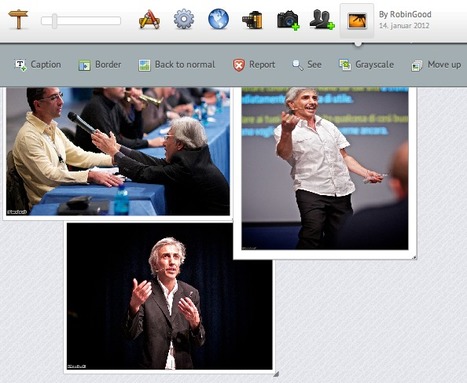
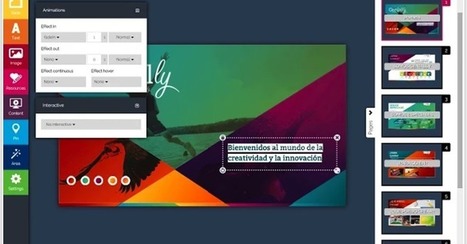
CanvasDropr provides a virtually infinite online canvas on which you and your friends / contacts can easily add, position, resize and rotate photos and video clips at will.
From the official site: "The center of the CanvasDropr idea is to work and collaborate on a so-called "Canvas".
The canvas can be shared by an unlimited amount of people, and changes made in the canvas are updated real-time in every user’s canvas.
Users can easily drag and drop new images directly from their desktop onto the canvas."
CanvasDrops allows you to text chat in real-time with other "collaborators" you have invited as well as to set permissions for what "public" users can edit or modify on a "public canvas.
It is possible to place photos and video clips coming from Facebook, YouTube, Flickr and Picasa or to import one simply by providing its URL.
The final canvas can be shared on FB or Twitter, downloaded as an "image" or a .zip file containing all of its images and can also be "embedded" on any site or blog.
The service is free to use.
Check this video: http://vimeo.com/31591478 ;
or you can try it immediately with no need for signup if you alrady have a Twitter or facebook account: http://www.canvasdropr.com/Signup.aspx ; Via Robin Good

Louise Robinson-Lay's curator insight,
January 10, 2013 6:44 PM
A nice collaborative tool for images. |


