Your new post is loading...

|
Scooped by
Gilbert C FAURE
October 5, 9:47 AM
|
𝗛𝗼𝘄 𝗮 𝗦𝗰𝗶𝗲𝗻𝘁𝗶𝗳𝗶𝗰 𝗕𝗿𝗮𝗻𝗱 𝗞𝗲𝗲𝗽𝘀 𝗮 𝗩𝗮𝗰𝗰𝗶𝗻𝗲 𝗜𝗻𝗱𝘂𝘀𝘁𝗿𝘆 𝗔𝗹𝗶𝘃𝗲
✨ Innovation shines — even as time passes.
The global shift toward next‑generation mucosal vaccines has revealed a powerful truth:
𝗮 𝘀𝗰𝗶𝗲𝗻𝘁𝗶𝗳𝗶𝗰 𝗯𝗿𝗮𝗻𝗱 𝗶𝘀 𝗺𝗼𝗿𝗲 𝘁𝗵𝗮𝗻 𝗮 𝗽𝗿𝗼𝗱𝘂𝗰𝘁; 𝗶𝘁 𝗶𝘀 𝗮𝗻 𝗲𝗰𝗼𝘀𝘆𝘀𝘁𝗲𝗺.
The recent npj Vaccines Perspective — “Current status of intranasal and inhaled COVID‑19 vaccines” — highlights a remarkable fact:
despite dozens of global attempts, only 𝗼𝗻𝗲 𝗮𝗱𝗷𝘂𝘃𝗮𝗻𝘁𝗲𝗱 𝗽𝗿𝗼𝘁𝗲𝗶𝗻‑𝗯𝗮𝘀𝗲𝗱 𝗶𝗻𝘁𝗿𝗮𝗻𝗮𝘀𝗮𝗹 𝘃𝗮𝗰𝗰𝗶𝗻𝗲 reached emergency authorization and entered high‑impact literature.
This single achievement proves something essential:
𝗮 𝘀𝘁𝗿𝗼𝗻𝗴 𝘀𝗰𝗶𝗲𝗻𝘁𝗶𝗳𝗶𝗰 𝗶𝗱𝗲𝗮, 𝘄𝗵𝗲𝗻 𝗯𝗿𝗮𝗻𝗱𝗲𝗱 𝗽𝗿𝗼𝗽𝗲𝗿𝗹𝘆, 𝗰𝗮𝗻 𝗸𝗲𝗲𝗽 𝗮𝗻 𝗲𝗻𝘁𝗶𝗿𝗲 𝗶𝗻𝗱𝘂𝘀𝘁𝗿𝘆 𝗮𝗹𝗶𝘃𝗲.
Across Nature Reviews Immunology, Signal Transduction and Targeted Therapy, and The Lancet Infectious Diseases, one message is clear:
𝗱𝗶𝘃𝗲𝗿𝘀𝗶𝗳𝗶𝗲𝗱 𝗽𝗹𝗮𝘁𝗳𝗼𝗿𝗺𝘀, 𝗺𝘂𝗰𝗼𝘀𝗮𝗹 𝗶𝗺𝗺𝘂𝗻𝗶𝘁𝘆, 𝗮𝗻𝗱 𝗶𝗻𝗻𝗼𝘃𝗮𝘁𝗶𝘃𝗲 𝗱𝗲𝗹𝗶𝘃𝗲𝗿𝘆 𝘀𝘆𝘀𝘁𝗲𝗺𝘀 𝗮𝗿𝗲 𝘁𝗵𝗲 𝗳𝘂𝘁𝘂𝗿𝗲.
This is exactly where 𝗥𝗮𝘇𝗶 𝗖𝗼𝘃 𝗣𝗮𝗿𝘀 stands as a compelling example.
🚀 Razi Cov Pars — When Innovation Becomes Legacy
🔹 𝗚𝗹𝗼𝗯𝗮𝗹 𝗿𝗲𝗰𝗼𝗴𝗻𝗶𝘁𝗶𝗼𝗻 𝗳𝗿𝗼𝗺 𝗮 𝗻𝗮𝘁𝗶𝗼𝗻𝗮𝗹 𝗶𝗻𝗻𝗼𝘃𝗮𝘁𝗶𝗼𝗻
Its presence in high‑impact literature transforms it from a domestic achievement into a scientific reference point.
🔹 𝗔 𝗽𝗿𝗼𝗽𝗿𝗶𝗲𝘁𝗮𝗿𝘆 𝗮𝗱𝗷𝘂𝘃𝗮𝗻𝘁 𝘁𝗵𝗮𝘁 𝘀𝗶𝗴𝗻𝗮𝗹𝘀 𝘁𝗲𝗰𝗵𝗻𝗼𝗹𝗼𝗴𝗶𝗰𝗮𝗹 𝗹𝗲𝗮𝗱𝗲𝗿𝘀𝗵𝗶𝗽
The RAS‑01 oil‑in‑water adjuvant has been repeatedly cited as a novel platform — proof that innovation can emerge anywhere.
🔹 𝗔 𝗯𝗿𝗮𝗻𝗱 𝘁𝗵𝗮𝘁 𝗱𝗼𝗲𝘀𝗻’𝘁 𝗳𝗮𝗱𝗲
When a scientific brand enters peer‑reviewed literature, it becomes part of the global narrative —
and science that enters the narrative never stops shining.
🌱 A Message to Young Scientists
𝗦𝗰𝗶𝗲𝗻𝗰𝗲 𝗶𝘀 𝗮 𝗹𝗼𝗻𝗴 𝗴𝗮𝗺𝗲.
Your work may take years to mature, but when it does, it becomes part of a legacy that outlives crises, trends, and headlines.
If one idea — born in a national institute — can reach global literature and influence future vaccine platforms,
then your idea can too.
Keep building.
Keep publishing.
Keep innovating.
✨ Because real science always finds its way to the light.
Stéphane Paul Stéphanie Longet
|
|
Scooped by
Gilbert C FAURE
January 16, 6:29 AM
|
|
|
Scooped by
Gilbert C FAURE
December 9, 2025 3:36 AM
|
🔬 New pre-print alert: I'm thrilled to share the latest findings from our group at Genentech, now live on bioRxiv!
"Recurrent RNA-lipoplex vaccination is required to sustain functional tumor-infiltrating neoantigen-specific CD8 T cells and therapeutic efficacy"
❓ The Challenge: Limited vaccine activity in established tumors
While neoantigen vaccines show promising clinical benefit in the adjuvant setting following surgical resection, their efficacy has been limited in patients with advanced solid tumors. Our pre-clinical study sought to understand why vaccine-induced T cells fail to eliminate established tumors.
🛠️ Our Approach: Tracking vaccine-induced CD8 T cells in the tumor microenvironment
Using histology, flow cytometry, and single cell RNA and TCR sequencing, we monitored the fate of RNA-lipoplex vaccine-induced CD8 TILs and changes to the TME following neoantigen vaccination.
💡 Key Findings: Vaccine-induced CD8 T cells are short-lived in the TME
- TME remodeling: Neoantigen RNA-LPX vaccination remodeled the TME, driving robust T cell infiltration and promoting a pro-inflammatory myeloid compartment. This was effective at eliminating small, immature tumors, but only delayed growth in larger, established tumors.
- Rapid T cell loss: While vaccine-induced CD8 T cells were long-lived in the blood, intratumoral T cells rapidly declined in abundance and diversity shortly after the last vaccination.
- Transcriptional signatures of dysfunction: scRNA-seq revealed that this T cell contraction was associated with a pro-apoptotic program, and the surviving TILs showed transcriptional signatures of cellular stress and impaired activation, reverting to a pre-vaccination-like state.
- Recurrent vaccination drives activity: Crucially, implementing a recurrent vaccination schedule effectively replenished the pool of proliferative and cytotoxic neoantigen-specific CD8 TILs in the tumor, leading to enhanced therapeutic efficacy and better tumor growth control.
🔗 Read the full pre-print on bioRxiv: https://lnkd.in/gYq_fB2h
|
|
Scooped by
Gilbert C FAURE
July 20, 2025 5:19 AM
|
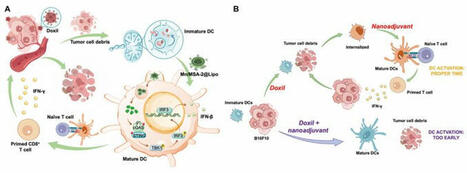
#Immunotherapy | "Right Time, Right Place" | Lymph Node-targeted temporally programmed #STING nanoadjuvant delivery unlocks synergistic chemotherapy-induced anti-#Tumor #Immunity | Breaking at Science Magazine Advances |
Stimulator of interferon genes (STING) agonists have attracted notable attention for their potent immune activation capabilities. However, their clinical application is hindered by systemic toxicity and delivery inefficiencies.
Here*, researchers addressed these challenges by developing a lymph node–targeted STING agonist nanoadjuvant (Mn/MSA-2@Lipo) combined with a temporally optimized delivery strategy. Mn/MSA-2@Lipo uses manganese ions to amplify STING pathway activation while achieving efficient lymph node accumulation and antigen presentation.
They first induced immunogenic cell death (ICD) through chemotherapy to release tumor antigens, followed by the administration of the nanoadjuvant at an optimized time interval, the approach effectively synchronizes dendritic cell (DC) antigen uptake and maturation. This combination therapy notably enhanced antitumor immunity in melanoma and breast cancer models, achieving complete tumor regression and inducing long-lasting immune memory, all while demonstrating an excellent safety profile.
These findings highlight the critical importance of delivery timing optimization, offering a promising strategy for the clinical translation of STING agonists and the design of advanced immunotherapies.
*https://lnkd.in/epVJs-GE
Celentyx Ltd #immunooncology #drugdiscovery www.celentyx.com
Professor Nicholas Barnes PhD, FBPhS Omar Qureshi Catherine Brady
SUMMARY FIGURE | (A) Schematic of temporally programmed STING nanoadjuvant delivery unlocks synergistic chemotherapy-induced antitumor immunity | (B). Schematic representation of the temporally programmed delivery strategy. The top panel illustrates the optimal sequence of chemotherapy and nanoadjuvant delivery. Administering Mn/MSA-2@Lipo 48 hours after Doxil allows DCs to capture tumor antigens prior to maturation, enabling efficient cross-presentation to CD8+ T cells in the tdLNs. This strategy enhances CD8+ T cell activation, subsequent tumor cell destruction, and long-term immune memory. The bottom panel depicts premature adjuvant administration, leading to early DC maturation, reduced phagocytic capacity, and diminished antitumor immune responses |
|
|
Scooped by
Gilbert C FAURE
January 3, 2025 3:30 AM
|
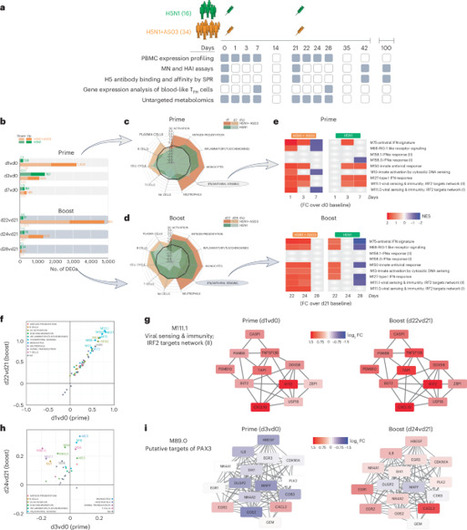
We performed a systems vaccinology analysis to investigate immune responses in humans to an H5N1 influenza vaccine, with and without the AS03 adjuvant, to identify factors influencing antibody response magnitude and durability. Our findings revealed a platelet and adhesion-related blood transcriptional signature on day 7 that predicted the longevity of the antibody response, suggesting a potential role for platelets in modulating antibody response durability. As platelets originate from megakaryocytes, we explored the effect of thrombopoietin (TPO)-mediated megakaryocyte activation on antibody response longevity. We found that TPO administration enhanced the durability of vaccine-induced antibody responses. TPO-activated megakaryocytes also promoted survival of human bone-marrow plasma cells through integrin β1/β2-mediated cell–cell interactions, along with survival factors APRIL and the MIF–CD74 axis. Using machine learning, we developed a classifier based on this platelet-associated signature, which predicted antibody response longevity across six vaccines from seven independent trials, highlighting a conserved mechanism for vaccine durability. Pulendran and colleagues define a molecular signature that can be used to predict the durability of antibody responses to vaccination and reveal important insights into the mechanisms by which vaccines induce durable immunity.
|
|
Scooped by
Gilbert C FAURE
November 28, 2023 3:24 AM
|
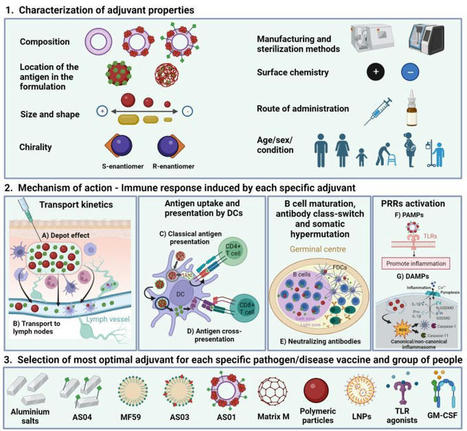
Check out our new Review in European Journal of Immunology Wiley on the past, present and future of rational polymer-based vaccine #adjuvant design! Myself…
|
|
Scooped by
Gilbert C FAURE
November 17, 2021 3:59 AM
|
Sjögren’s syndrome (SjS) is a frequent systemic autoimmune disease responsible for a major decrease in patients’ quality of life, potentially leading to life-threatening conditions while facing an unmet therapeutic need. Hence, we assessed the immunogenicity, efficacy, and tolerance of IFN-Kinoid (IFN-K), an anti-IFNα vaccination strategy, in a well-known mouse model of systemic autoimmunity with SjS-like features: MRL/MpJ-Faslpr/lpr (MRL/lpr) mice. Two cohorts (with ISA51 or SWE01 as adjuvants) of 26 female MRL/lpr were divided in parallel groups, “controls” (not treated, PBS and Keyhole Limpet Hemocyanin [KLH] groups) or “IFN-K” and followed up for 122 days. Eight-week-old mice received intra-muscular injections (days 0, 7, 28, 56 and 84) of PBS, KLH or IFN-K, emulsified in the appropriate adjuvant, and blood samples were serially collected. At sacrifice, surviving mice were euthanized and their organs were harvested for histopathological analysis (focus score in salivary/lacrimal glands) and IFN signature evaluation. SjS-like features were monitored. IFN-K induced a disease-modifying polyclonal anti-IFNα antibody response in all treated mice with high IFNα neutralization capacities, type 1 IFN signature’s reduction and disease features’ (ocular and oral sicca syndrome, neuropathy, focus score, glandular production of BAFF) improvement, as reflected by the decrease in Murine Sjögren’s Syndrome Disease Activity Index (MuSSDAI) modelled on EULAR Sjögren’s Syndrome Diseas
|
|
Rescooped by
Gilbert C FAURE
from Cancer Vaccines Collection
January 28, 2021 3:52 AM
|
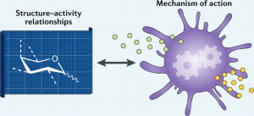
Modern subunit vaccines based on homogeneous antigens offer more precise targeting and improved safety compared with traditional whole-pathogen vaccines. However, they are also less immunogenic and require an adjuvant to increase the immunogenicity of the antigen and potentiate the immune response. Unfortunately, few adjuvants have sufficient potency and low enough toxicity for clinical use, highlighting the urgent need for new, potent and safe adjuvants. Notably, a number of natural and synthetic carbohydrate structures have been used as adjuvants in clinical trials, and two have recently been approved in human vaccines. However, naturally derived carbohydrate adjuvants are heterogeneous, difficult to obtain and, in some cases, unstable. In addition, their molecular mechanisms of action are generally not fully understood, partly owing to the lack of tools to elucidate their immune-potentiating effects, thus hampering the rational development of optimized adjuvants. To address these challenges, modification of the natural product structure using synthetic chemistry emerges as an attractive approach to develop well-defined, improved carbohydrate-containing adjuvants and chemical probes for mechanistic investigation. This Review describes selected examples of natural and synthetic carbohydrate-based adjuvants and their application in synthetic self-adjuvanting vaccines, while also discussing current understanding of their molecular mechanisms of action.
Carbohydrate adjuvants potentiate immune responses through diverse mechanisms. This Review highlights carbohydrate-based adjuvants, providing insights into structure–activity relationships and applications in vaccine development, while discussing current knowledge of the mechanisms by which they potentiate and modulate the immune response.
Via Krishan Maggon
|
|
Scooped by
Gilbert C FAURE
October 5, 2020 3:05 AM
|
Aluminum salts and squalene based oil-in-water emulsions (SE) are widely used adjuvants in licensed vaccines, yet their mechanisms are not fully known. Here we report that induction of antibody responses displays different kinetics dependent on the adjuvant used. SE facilitated a rapid antibody response in contrast to aluminum hydroxide (AH) and the depot-forming cationic liposome-based adjuvant (CAF01). Antigen given with the SE adjuvant rapidly reached follicular B cells in the draining lymph node, whereas antigen formulated in AH or CAF01 remained at the site of injection as a depot. Removal of the injection site early after immunization abrogated antibody responses only when antigen was given in the depot-forming adjuvants. Despite initial delays in B cell activation and germinal center (GC) formation when antigen was given in depot-forming adjuvants, the antibody levels reached higher magnitudes than when the antigen was formulated in SE. This study demonstrates that the kinetic aspect of antibody responses is critical in adjuvant benchmarking and suggests that the optimal vaccination regime depends on the adjuvant used.
|
|
Scooped by
Gilbert C FAURE
July 5, 2020 5:33 AM
|
Research ArticleAIDS/HIVImmunology Free access | 10.1172/jci.insight.135057 Protein-based, but not viral vector alone, HIV vaccine boosting drives an IgG1-biased polyfunctional humoral immune response Stephanie Fischinger,1,2 Sally Shin,1 Carolyn M. Boudreau,1,3 Margaret Ackerman,4 Supachai Rerks-Ngarm,5 Punnee Pitisuttithum,6 Sorachai Nitayaphan,7 Jerome H. Kim,8 Merlin L. Robb,9,10 Nelson L. Michael,10 Robert J. O’Connell,7,10 Sandhya Vasan,7,9,10 Hendrik Streeck,2,11 and Galit Alter1 First published June 18, 2020 - More info Abstract The RV144 HIV-1 vaccine trial results showed moderate reduction in viral infections among vaccinees as well as induction of antibody-dependent cellular cytotoxicity and vaccine-specific IgG and IgG3 responses directed at variable loop regions 1 and 2 of the HIV envelope protein. However, with the recent failure of the HVTN 702 clinical trial, comprehensive profiling of humoral immune responses may provide insight for these disappointing results. One of the changes included in the HVTN 702 study was the addition of a late boost, aimed at augmenting peak immunity and durability. The companion vaccine trial RV305 was designed to permit the evaluation of the immunologic impact of late boosting with either the boosting protein antigen alone, the canarypox viral vector ALVAC alone, or a combination of both. Although previous data showed elevated levels of IgG antibodies in both boosting arms, regardless of ALVAC-HIV vector incorporation, the effect on shaping antibody effector function remains unclear. Thus, here we analyzed the antibody and functional profile induced by RV305 boosting regimens and found that although IgG1 levels increased in both arms that included protein boosting, IgG3 levels were reduced compared with the original RV144 vaccine strategy. Most functional responses increased upon protein boosting, regardless of the viral vector-priming agent incorporation. These data suggest that the addition of a late protein boost alone is sufficient to increase functionally potent vaccine-specific antibodies previously associated with reduced risk of infection with HIV. Introduction Treatment options for HIV-1 and AIDS have reversed the death sentence once associated with an HIV diagnosis. However, global control and eradication of the disease are hindered by limited access to medication, adherence to daily medication, and health care for some populations (1). Additionally, HIV-infected people on long-term treatment continue to experience a number of health complications, including increased risk for particular cancers, cardiovascular disease, and liver damage (2). Therefore, the development of a vaccine that demonstrates protection against HIV remains a public health priority for eradicating the pandemic (3, 4). To date, 4 HIV vaccine phase II and III trials have been conducted, with only one showing a modest level of reduction with infection acquisition. RV144, also known as the Thai trial, was a phase III community-based HIV-1 vaccine trial that showed 60.5% and 31.2% efficacy 12 and 42 months after final vaccination (NCT00223080; refs. 5, 6). Despite the absence of neutralizing antibodies, analyses of immune correlates of reduced risk of infection pointed to an enrichment of high levels of IgG1 and IgG3 responses to variable loop regions 1 and 2 (V1V2) of the HIV envelope (Env) protein and to lower levels of vaccine-induced IgA among uninfected compared with infected vaccinees (7). Moreover, additional analyses revealed enhanced complement deposition in RV144 vaccinees associated with reduced risk of infection (8), as well as more polyfunctional vaccine responses compared with previous protein-based vaccine trials (9). Collectively, these data pointed to the critical importance of functional antibodies, correlated with an array of Fc-mediated effector functions in reduced HIV acquisition risk, following the RV144 prime and boost vaccine regimen. Owing to the promising but short-lived efficacy of RV144, it was hypothesized that the addition of late boosts might augment the vaccine response and drive a more durable functional immune response. Thus, boosts were added to the HVTN 702 efficacy trial recently terminated in South Africa (10). The disappointing termination of the HVTN 702 trial, owing to futility, raises the possibility that the original RV144 correlates from a low-risk population may not have been sufficiently robust against higher-risk exposure in young women in Africa, or that alterations in the regimen, owing to added boosts, may have altered the humoral immune response, providing less protection from infection in the field. To determine differences in RV144 and newly boosted vaccine-induced immune responses, we focused on the RV305 trial, developed to investigate whether late boosts with AIDSVAX protein alone, ALVAC-HIV vector vaccine alone, or a combination of both could selectively augment antibody correlates of reduced risk of infection found in RV144 (11, 12), with the hypothesis that the innate stimulatory vector functions could potentially have critical value for driving enhanced functional antibodies. The RV305 trial reenrolled 162 RV144 vaccinees, who completed the whole vaccination schedule 6 to 8 years after the follow-up period of RV144, in a placebo-controlled, double-blinded trial. Subjects were randomized into 1 of 3 groups that received 2 boosts with either canarypox viral vector (ALVAC) alone, the AIDSVAX B/E gp120 Env protein alone, or a combination of both (13). RV305 analyses pointed to the critical role of the AIDSVAX B/E protein, but not to the ALVAC viral vector in inducing humoral responses. The boost drove higher antibody titers against various Env antigens (gp120 and V1V2), above levels observed at the peak RV144 vaccine time point in plasma as well as in mucosal secretions (14). Moreover, antibody titers were shown to increase after the first but not after the second boost in RV305 vaccinees. Unfortunately, late boosting did not induce a more durable antibody response, as responses waned quickly after boosting across all groups (13). Furthermore, analysis of B cell responses in RV305 vaccinees showed that a pool of Env CD4-binding site reactive memory B cells were expanded and produced antibodies with longer third heavy chain complementarity-determining regions (14), pointing to a potentially advantageous level of affinity maturation and B cell receptor evolution. However, whether the different boosting strategies altered the qualitative profile of the vaccine-elicited antibody response and antibody functionality of the originally primed RV144-induced vaccine response remains unknown. Thus, here we used a systems serology approach to comprehensively dissect the qualitative profiles induced across the RV305 vaccine groups to gain a deeper sense of protein, viral vector, or combined vaccine boosting impact. We demonstrate that boosting with ALVAC-HIV alone did not result in increased antibody levels or vaccine-induced functional humoral immune responses compared with RV305 placebo recipients. In contrast, delayed protein boosting drove robust functional humoral immune responses, shifting away from IgG3, through the induction of functionally enhanced IgG1 responses. Results The goal of the RV305 trial was to assess the impact of booster immunizations 6–8 years after completion of RV144 on immune responses (Figure 1A). RV144 vaccinees were reboosted with 2 additional administrations of either ALVAC-HIV or AIDSVAX B/E alone or a combination of both. Figure 1 AIDSVAX protein boosting alone or in combination with ALVAC drives an IgG1-focused immune profile. (A) The diagram shows the vaccination schedule of RV144 linked to RV305. RV305 reenrolled healthy RV144 participants and administered 2 boosts of AIDSVAX B/E, ALVAC, or a combination of the two. (B) Spider plots show the relative antibody titers MFIs (z-scored) via Luminex against different vaccine antigens at week 26 for RV144 (blue), combination (maroon), AIDSVAX (orange) and ALVAC (yellow) for IgG1 (left) and IgG3 (right). Each line represents the median of the z-scored values for each vaccine group of the isotype MFI. (C) The dot plots show relative gp120MN-specific antibody level MFIs across the subclasses and isotypes (IgG1, IgG2, IgG3, IgG4, IgA, and IgM). Each dot represents one vaccinee. Data are shown as mean ± SEM. A Kruskal Wallis test was performed to test for statistical differences across groups. *P < 0.05, **P < 0.01, ***P < 0.001, and ****P < 0.0001. The dotted line shows placebo levels. Antibody subclass responses are similar across boosting approaches. Previous RV305 studies highlighted the presence of higher levels of IgG1 and IgA after boosting compared with the RV144 peak immunogenicity time point. Moreover, both neutralizing antibodies against tier 1 viruses and increased CD4+ functionality were observed (13). However, comparative studies of RV144 and the failed AIDSVAX B/E vaccine trial VAX003 suggested that changes in antibody subclass levels, associated with the selection of more functional IgG1 and IgG3 antibody subclasses (9), were associated with reduced risk of infection among RV144 vaccinees (12). Thus, we initially sought to define whether the addition of the viral vector priming ALVAC-HIV immunogen, owing to its potentially adjuvanting viral properties, could enhance and/or shift subclass selection during the boosting phase. Therefore, subclass V1V2 and gp120 levels were assessed against the canarypox-expressed gp120 (92TH023) and AIDSVAX B/E gp120 (MN and AE244) antigens. As previously shown, IgG1 responses were robustly boosted but exhibited similar antigenic profiles in the AIDSVAX B/E and combination arms (Figure 1B). However, marginal increases in IgG3 were observed upon boosting across either arm (Supplemental Figure 1; supplemental material available online with this article; https://doi.org/10.1172/jci.insight.135057DS1), in contrast to RV144 vaccinees who possessed significantly higher IgG3 levels at peak immunogenicity (Figure 1B). Moreover, IgG1 and IgG3 levels were not boosted in the arm using ALVAC-HIV alone (Figure 1B). Slight, insignificant differences were observed in V1V2 responses in the AIDSVAX B/E and combination groups, with slightly elevated V1V2 A244 and lower V1V2 Case A2 responses in the AIDSVAX B/E alone group (Figure 1B). Addition of the protein antigen is key to enhancing gp120 IgG levels. Because differences in subclass selection profiles were associated with reduced risk of infection in the RV144 trial, a full analysis of antibody profiles was conducted across the RV305 arms. Across all antibody subclasses and isotypes, individuals immunized with ALVAC-HIV alone had low antibody levels comparable to placebo-immunized individuals, suggesting that reboosting with the ALVAC vector vaccine did not elicit a detectable antibody response, consistent with previous reports (ref. 13; Figure 1C). AIDSVAX alone or in combination with ALVAC induced equal levels of IgG1, IgG2, IgG4, and IgA at higher levels than that observed in the original RV144 peak response. These observations indicate a beneficial effect of repeated boosting with a protein antigen to increase antibody titers. IgM levels were comparably low across all vaccine groups, despite higher levels in some RV144 vaccinees compared with the combination boost arm. This points to a maturation of the naive HIV-specific response among all AIDSVAX-boosted individuals, although comparably higher overall titers among individuals receiving the protein antigen were observed. Notably, in previous analyses of immune correlates, HIV-specific IgG3 levels were associated with reduced risk of infection (12), and IgA was associated with enhanced risk of infection (11). All boosting strategies failed to increase IgG3 responses (Figure 1C), highlighting a maturation and selection of potential memory HIV-specific IgG responses, since IgG1 and IgG4 levels were boosted. Boosting with protein, but not viral vector ALVAC-HIV alone, resulted in increased IgA levels (Figure 1C) along with higher IgG4, both thought to interfere with IgG1 and IgG3 antibody functional potency (9). Thus, collectively, boosting significantly skews the responses away from more naive IgG isotypes and/or subclasses (IgM and IgG3). However, protein boosting was required to drive enhanced functional antibody selection. Combination and AIDSVAX induce highest functional levels. Given these differences in antibody subclass selection, we next determined whether the functional profiles of the vaccine-induced immune response shifted with titers or were qualitatively enhanced in the combination boost arm. For most functional measurements, combination and AIDSVAX alone induced the highest levels across all functional assays (Figure 2A). Both protein-containing boosting arms and RV144 vaccinees exhibited enhanced vaccine- specific function across all assays (Figure 2A), suggesting that ALVAC-HIV alone did not enhance antibody effector function in any appreciable manner across all functional measurements. Yet, protein boosting only significantly increased neutrophil phagocytosis (ADNP), complement deposition (ADCD), and NK cell chemokine secretion compared with RV144 vaccination alone (Figure 2A). These data suggest that late boosting returns antibody-dependent monocyte phagocytosis (ADCP), NK cell degranulation (CD107a), and IFN-γ back to RV144 levels, while significantly boosting other innate immune effector functions. Although previous studies have shown that CD107a expression correlated with cytokine secretion (15), different NK cell subsets show differences in their capacity to produce cytokines (16). Therefore, different cell subsets could be activated differentially by vaccination, resulting in CD107a expression, IFN-γ, and MIP-1β secretion differences. MIP-1β secretion typically induced at highest rates after stimulation and was most sensitive to differences in antibody quality (17). Interestingly, correlational analysis between vaccine-induced isotype and/or subclasses and effector functions (Figure 2B) pointed to the dominant role of IgG1 in driving antibody effector functions across RV144 and protein-containing boosting arms. However, IgG3 levels in RV144 vaccinees were significantly correlated with ADCD, and only weakly, nonsignificantly correlated with ADCP, ADNP, NK degranulation, and NK IFN-γ secretion. These relationships were nearly eliminated with boosting in the combination and AIDSVAX-only arms. Instead, weak relationships were observed with other isotypes and/or subclasses, including IgA heterogeneous associations with ADCP, ADNP, ADCD, and NK cell functions across the 2 protein boosting arms that did not reach significance after Bonferroni’s correction. Given the constitutive expression of the FcαR on neutrophils, the direct functional role of IgA can only be examined in this readout; however, the influence of IgA on functions in collaboration with IgA is possible. Figure 2 Late boosting with AIDSVAX or ALVAC/AIDSVAX elevated ADNP, ADCD, and MIP-1β and resulted in more durable ADCP. (A) The dot plots show functional responses for the different vaccine groups against gp120 MN. Each dot represents one vaccinee. Data are shown as mean ± SEM. ADCP, PS, ADNP PS, ADCD, MFI, and ADNKA (percent positive NK cells for CD107a, IFN-γ, and MIP-1β) are depicted. Dotted lines indicate the average activity in the placebo vaccinees. (B) Heatmaps show Spearman’s correlations for each functional measurement with Luminex antibody levels for: RV144, combination, AIDSVAX, and ALVAC. The color indicates the Spearman r value: positive correlation (red), negative correlation with a Bonferroni’s adjustment for multiple comparisons (blue), *P < 0.05, **P < 0.01, ***P < 0.001, and ****P < 0.0001. (C) The dot plots show ADCP, ADNP, and ADCD over time, starting at week 0 (baseline), to week 26 (2 weeks post second boost) week 72 (durability time point). Each graph shows group 1 (dark red), 2 (orange), and 3 (yellow) for each function, and the same individuals are connected by lines. ADCD, antibody-dependent complement deposition; ADCP, Antibody-dependent cellular phagocytosis; ADNKA, antibody-dependent NK cell activation; ADNP, antibody-dependent neutrophil phagocytosis; PS, phagoscore. These data support the argument for a consistently dominant role of IgG1 in driving antibody function across all vaccine groups that may be fine-tuned in the setting of additional antibody isotypes and/or subclasses. Thus, whereas boosting appears to improve the overall functional profile of the humoral immune response, limited differences were observed again at the univariate level across the protein-containing boosting groups. We next investigated whether the vaccine regimens altered the durability of the functional response. Therefore, functional profiling was performed at baseline, peak immunogenicity (week 24), and at a later time point (week 72). Although the functions did not increase significantly over the follow-up among ALVAC-only vaccinees, ADCP, ADNP, and ADCD clearly peaked at peak immunogenicity (Figure 2C). Protein-boosted groups showed similar trends across all functions, with ADNP and ADCD rising and falling to baseline levels by week 72. Conversely, ADCP activity remained elevated above background at week 72, suggesting that some, but not other, functions may persist for longer periods of time in both protein-boosted groups. These data point to indistinguishable trajectories of the vaccine-induced functional humoral immune response over time with a persistent and durable ADCP response. Combination and AIDSVAX induce significantly different immune profiles from RV144 and ALVAC. Despite the lack of univariate differences across the boosting arms, we next aimed to determine whether multivariate differences could be discerned across the groups. A supervised multivariate analysis was applied to the peak RV305 and RV144 data. Canonical discriminant analysis, unlike principal component analysis, is a supervised multivariate analysis that explores the linear combinations of quantitative variables that provide maximal separation between groups. Using this discriminant analysis, with all 118 data points, including antigen-specific functional, isotype, subclass, and Fc receptor (FcR) measurements for each subject (n = 247), clear separation was observed across several groups (Figure 3A). Interestingly, RV144 split as a completely independent profile from all other vaccine groups; placebo and ALVAC-only boosted individuals were inseparable in this analysis. Conversely, the 2 arms that received the protein AIDSVAX boost clustered together as overlapping profiles. These data clearly illustrate the marginal effect of the ALVAC vector boost alone, but the critical impact of the protein boost in reshaping the RV144 vaccine induced immune response. Figure 3 Multivariate determinants of differences across boosting regimens. A total of 118 data points, including functional measurements for gp120 MN and all antigens described in “Methods” for Fc-receptor and isotyping and/or subclassing, have been used for multivariate analysis. (A) The discriminant analysis shows the separation of RV144 and RV305 vaccine arms, including the RV305 placebo subjects. (B) The LASSO partial least squares discriminant analysis shows the separation between the RV305 combination vs. AIDSVAX alone vaccine recipients. Each dot represents one participant. (C) The variable importance in the projection scores are ordered and scaled according to their importance for model separation. Variables that point to the right are enriched in AIDSVAX-only recipients, whereas the features directed to the left are higher in recipients of the combination vaccine. Despite the limited separation between the AIDSVAX only and ALVAC/AIDSVAX arms by univariate and discriminant analysis, we next aimed to use a more rigorous multivariate approach to determine whether any differences existed between the 2 vaccine arms. Using a multivariate LASSO partial least squares discriminant analysis (PLSDA) model, in which all antibody features were first down selected to prevent overfitting, and to define the minimal features that distinguish the arms, some level of separation was observed between the combination and AIDSVAX arms (Figure 3B). Both regimens resulted in distinct V1V2 immunodominant reactivity profiles that had been previously associated with reduced risk of infection (11). Although the combination vaccine drove higher levels of IgG2 breadth of binding, IgM responses to V1V2, IgG4 responses, and NK cell responses, AIDSVAX drove an FcR -biased response to Clade AE antigens, higher complement C1q binding, as well as IgG1 titers to the Case A2 V1V2 (Figure 3C). Whereas many of these were not significantly different at a univariate level, the combination of a number of features were ultimately able to separate out the vaccine profiles, highlighting subtle, largely epitope-specific functional differences across the vaccine responses. Therefore, these higher-resolution analyses point to fine-detailed differences in the immune response; however, how these differences are relevant clinically remains unclear. Finally, to gain a deeper understanding on how the boosting reshaped the RV144 vaccine-induced immune response, RV144 and the matched combination arm were compared in a LASSO PLSDA model. RV144 and RV305 AIDSVAX/ALVAC immunized individuals exhibited completely distinct, nonoverlapping functional humoral immune profiles (Figure 4A) marked by elevated binding to FcR 2A (Figure 4, B and C) involved in phagocytosis (18), complement binding, and less desirable elevated IgG4 responses. Conversely, RV144 vaccinees possessed higher IgG3 breadth and IgM responses, both of which were lost with additional boosting as observed in the univariate analysis (Figure 4, B and C). Thus, whereas the potentially protective IgG3 response was lost from the RV144 profile in RV144 vaccinees, the boost matured the immune response to a robust FcR--binding profile poised to drive antibody effector function. The small number of 8 features needed for separation between the RV144 and RV305 profiles point toward qualitative rather than primarily quantitative differences in the immune response tailored by boosting. After late boosting in RV305, regardless of the protein immunization strategy, these individuals were able to leverage more FcR 2A binding, skewing the humoral response toward a highly functional but low IgG3 profile. Figure 4 RV144 drove an IgG3-focused but less functional profile compared with vaccinees boosted with AIDSVAX boost alone or in combination with ALVAC-HIV. (A) The partial lease squares discriminant analysis plot depicts the features associated with separation of RV305 (combination and AIDSVAX recipients) and RV144 vaccinees. Each dot represents one participant with all measurements, including measures from all antigens and Fc receptor binding. (B) The variable importance in the projection scores are ranked according to their importance, and direction corresponds to enrichment in each group. (C) The dot plots show the top 6 variable importance in the projection features as univariate comparison between the AIDSVAX/combination and RV144 group. Mann-Whitney test was performed with a Bonferroni’s correction to define significance. ****P < 0.0001. Discussion Reduced rates of infection among RV144 vaccinees provided great hope to the HIV vaccine research field that protection could potentially be achieved (5). However, the RV144 replication in South Africa, the HVTN 702 trial, was recently terminated due to futility (10). Given the differences established in the vaccine regimens across the studies (19), with the addition of the late boost in the HVTN 702 study, here we sought to comprehensively dissect the effect of late boosting on vaccine-induced immunity. Owing to issues with waning immunity following RV144 vaccination (5), the RV305 study aimed to test the immunological impact of boosting that was included in the HVTN 702 trial. Within the RV305 study, the potential adjuvanting activity of ALVAC-HIV as well as the protein boost were explored. Whereas previous studies showed that IgG1 and IgA levels increased compared with RV144 peak immunogenicity levels in AIDSVAX and combination vaccine groups, to date functional responses as well as subclass distributions had not been thoroughly dissected (13). To further evaluate RV305-induced vaccine profiles, using systems serology we confirmed that protein boosting alone significantly boosted vaccine responses. At a univariate level, protein boosting alone, regardless of ALVAC addition, resulted in significant boosting at both quantitative and qualitative levels, in an IgG-dominated manner. Although boosting did not augment the overall level of ADCP and NK cell degranulation or IFN-γ secretion by vaccine-induced antibodies, boosting augmented ADNP, ADCD, and NK cell-mediated chemokine secretion, pointing to qualitative improvements with the addition of the boosting. Moreover, whereas the majority of antibody functions declined quickly upon follow-up, ADCP responses remained significantly elevated, indicating additional durability in some functional vaccine-induced immunity with boosting. Whereas IgG3, the most functional antibody subclass in humans, was identified as an immune correlate of reduced risk of infection in the RV144 vaccine trial (12), all boosting strategies in RV305 drove class switching away from this functional subclass (Figure 1C). The boosted IgG response was largely more effective at driving functional activity compared with the RV144 responses, suggesting that despite this loss of IgG3, the increased IgG1 titers were highly functional (Figure 2A), albeit less functional at a per antibody level compared with those elicited in the RV144 vaccine trial. Likewise, depletion IgG3 studies led to a loss of function in RV144 vaccinees, highlighting the importance of IgG3 in polyclonal RV144 functionality (9). However, IgG3 depletion did not completely deplete polyclonal functionality, pointing to a critical role for IgG1 as a critical mediator of vaccine-induced effector function. Given the short IgG3 half-life (20), the induction of more functional IgG1 is likely to be a more stable target vaccine profile for future vaccines; however, with IgG3, polyclonal pools may have the capacity to drive enhanced antibody effector function. Thus, vaccine strategies that eliminate IgG3 may fail to fully leverage all necessary antibody effector functions, such as ADCD that was tightly linked to IgG3 levels, which may be required for long-lasting protection against HIV. In addition to boosted IgG1 levels, boosting with either combination or AIDSVAX alone also increased IgG4 levels, which have been associated negatively with antibody functionality (21). Previous studies have shown that repeated boosting, as was performed in VAX003, results in class switching and increase of less-functional IgG4 antibodies (9). However, adjuvant use may temper the level of subclass selection, potentially offering an approach to enhance the functional quality of the vaccine-induced humoral immune response. For example, whereas VAX003 and RV144 used alum as an adjuvant, the use of MF59 and AS01 as adjuvants has demonstrated induction of superior antibody functionality and increased IgG1 levels (22). In a previous study, using a MF59-adjuvanted influenza vaccine demonstrated the induction of robust IgG1, along with increasing IgG4 titers (23). Surprisingly, although MF59 induced robust phagocytic and complement fixing antibodies in parallel to increasing antibody titers, the vaccine-induced immune response lacked the ability to recruit NK cells, a function that has been linked to reduced risk of infection in the RV144 correlates analyses (11). Therefore, the lack of efficacy observed in HVTN 702 may be related to altered antibody functional profiles driven both by changes in boosting as well as in adjuvant selection. Although the majority of functions declined after peak immunogenicity, ADCP remained significantly elevated (Figure 2C). Emerging data from multiple nonhuman primate vaccine studies, using distinct immunization strategies, argue for a critical protective role of phagocytosis against infection (24, 25). Although ADCP levels did not increase significantly in RV305 compared with RV144 vaccinees, the durability of ADCP in the protein-boosted subjects may offer extended protection. How these ADCP responses persisted in the setting of rapidly waning IgG titers (13) remains to be defined, but points to the differences in quantitative and qualitative vaccine-induced immune persistence that may greatly impact the durability of protection. Thus, whereas late boosting failed to introduce long-lived IgG responses (13), late boosting with protein antigens resulted in a profound improvement in antibody effector function and the persistence of elevated levels of ADCP (Figure 2, A and C); however whether these persisting responses may not have been sufficiently high to confer protection in HVTN 702 remains to be defined. Collectively, subtle differences existed in the vaccine-induced immune profile across the protein alone and combination of viral vector ALVAC and protein boost, but suggested that the protein boost alone may be sufficient to drive highly functional vaccine-induced immune responses (Figure 3, B and C). Collectively, late boosting altered the overall RV144 vaccine-induced humoral profiles. Given the recent failure of HVTN 702, these data point to the possibility that boost-driven alterations may have skewed the response away from RV144 profiles or that distinct and/or more robust responses may be required to confer protection in the aggressive South African epidemic in young women. However, novel adjuvants (22), poised to drive enhanced functionality, paired with rational late boosting with newly designed structurally and/or sequence-enhanced antigens (26) may result in the generation of an optimized vaccine able to provide higher levels of protection from infection at a global level. Methods Sample selection. Plasma samples from 88 uninfected RV144 vaccinees (5) (NCT00223080) (not matched to RV305 participants) at the peak immunogenicity time point (week 24) were assayed and compared with 132 RV305 vaccinees at week 0, 26, and 72. RV144 vaccinees received 2 priming injections with ALVAC-HIV (encoding vCP1521, Sanofi Pasteur) followed by 2 prime and boost injections with the ALVAC-HIV and AISVAX B/E recombinant protein boost (including gp120 A244 and MN, Global Solutions for Infectious Diseases). The RV305 trial (NCT01435135) reenrolled 162 RV144 vaccinees who completed the whole vaccination schedule 6 to 8 years after the follow-up period of RV144 (13). The RV305 study included 3 vaccine arms, each including 45 participants, and 9 individuals in each placebo group. The same priming and boosting vaccines were used as in the RV144 trial: the ALVAC prime and AIDSVAX B/E boost. Group 1 received a combination of the ALVAC-HIV and AIDVAX B/E vaccination (45 individuals available), group 2 received the boosting AIDVAX B/E alone (44 individuals available), and group 3 received ALVAC-HIV alone (43 individuals available). Vaccines were given at week 0 and 24 (Figure 1A). All RV305 samples (n = 132) were profiled at week 26 (peak immunogenicity time point) and partially at week 72 (n = 132). Samples were run in duplicate per assay and across 2 biological replicates. Antibody titer measurements and FcR binding. Antigen-specific antibody subclass, isotype, and FcR-binding levels were measured using a customized multiplexed Luminex assay, as previously described (27). A panel of V1V2 and gp120 antigens were used, including: V1V2 92TH023, V1V2 A244, V1V2 MN, gp120 92TH023, gp120 MN, and gp120 A244 (all from Duke University) and V1V2 Case A2 (Immune tech, IT-001-214p). Briefly, antigens were coupled to fluorescent carboxyl-modified microspheres (Luminex). Antigen-coupled Luminex beads were then washed and incubated with plasma samples (1:1000 for IgG, IgG1, and all FcRs; 1:250 for all other readouts), and antibody titers were detected using a PE-conjugated antibody for each subclass, isotype (IgG, IgG1, IgG2, IgG3, IgG4, IgA, and IgM; Southern Biotech), FcR (FCR2AH, 2AR, 2B, 3AF, 3AV, and 3B; Duke Protein Production facility), or complement (C1q, Duke Protein Production Facility). Samples were analyzed on a Bioplex 3D reader (Bio-Rad) using Exponent software. Breadth of antibody subclasses and FcR binding was calculated for all mentioned antigens as the number of antigens that bound above the median z-score value for each subclass or FcR, respectively. Functional measurements. Bead-based assays were used to quantify ADCP, ADNP, and ADCD, as previously described (28–30). Fluorescent streptavidin beads (Thermo Fisher Scientific) were coupled to biotinylated antigen (gp120 MN) and incubated with diluted plasma (ADCP 1:500, ADNP 1:100, and ADCD 1:10). A phagocytosis score was calculated for ADCP and ADNP as (percentage of bead-positive cells) × (MFI of bead-positive cells) divided by 10,000. ADCD was reported as MFI of C3 deposition. For antibody-dependent NK cell-activating functions, an ELISA-based surrogate assay was employed, as previously described (31). Briefly, plates were coated with 3 μg of antigen (gp120 MN), and samples were added at a 1:25 dilution and incubated for 2 hours at 37°C (32). NK cells were isolated the day prior via RosetteSep (Stem Cell Technologies) from healthy buffy coats and rested overnight in 1 ng/mL IL-15 (Stemcell). NK cells were then added to the immune complex containing plates and incubated for 5 hours at 37°C in the presence of CD107a PE-Cy5 (BD), Golgi stop (BD), and Brefeldin A (BFA, MilliporeSigma) staining cocktail. Following the incubation, cells were fixed with Perm A (Life Tech), stained for surface markers with anti-CD16 APC-Cy7 (BD), anti-CD56 PE-Cy7 (BD), and anti-CD3 PacBlue (BD), and permeabilized with Perm B (Life Tech). Anti-IFN-γ FITC (BD) and anti-MIP-1β PE (BD) antibodies were used for intracellular staining. NK cells were defined as CD3–, CD16+, and CD56+. Data were reported as percentage of cells positive for CD107a, MIP-1β, or IFN-γ. Acquisition of all flow data was performed on an iQue Screener plus (IntelliCyt). Statistics. Flow data was analyzed using the iQue Screener plus (Intellicyte) software. Data analysis and graphs were generated using GraphPad Prism version 8 for Mac (GraphPad Software). For comparison between 2 groups (Figure 4C), 2-tailed Mann-Whitney test was applied. For comparison of more than 2 groups (Figure 1C and Figure 2A), Kruskal-Wallis with Dunn’s multiple comparison test was used. Correlation matrixes were generated via Prism, and Spearman’s correlation was performed. Bonferroni’s post hoc test was applied as indicated for multiple comparisons (Figure 2B and Figure 4C). JMP version 13.2.0 was employed for the linear canonical discriminant analysis with common covariance. The minimum signature of antibody features and functional measurements needed for differentiating vaccine groups were determined using a LASSO feature down-selection using MATLAB software (version 2018B, MathWorks) followed by visualization by PLSDA (33). For RV305 AIDSVAX versus combination (Figure 3), a ROC 10-fold cross-validation was used (72.8% accuracy, AUC 0.56). For RV144 versus RV305 AIDSVAX/combination analyses (Figure 4), the ROC 1-fold cross-validation yielded 91.5% accuracy and 0.90 AUC. Study approval. Written informed consent was received from all participants before inclusion in the study. This research was approved by the Institutional Review Board of Massachusetts General Hospital (IRB approval no. 2015P000095 and no. 2014P000926). Author contributions SF and GA designed the research study. SF and SS conducted the experiments and acquired the functional data. MA provided additional biophysical data. SF and CMB analyzed the data. SV provided study samples. SF and GA wrote the manuscript. SRN, PP, SN, SV, JHK, MLR, NLM, RJOC, and HS gave valuable comments and input on the manuscript. All authors contributed to the final version of the manuscript. Supplemental material Acknowledgments We would like to thank the US Military HIV Research Program for specimens from the RV144 and RV305 vaccine trial. This work was supported by the NIH under award R37AI080289, the Ragon Institute Sundry, and the Massachusetts General Hospital Executive Committee on Research Scholars Program. Footnotes Conflict of interest: The authors have declared that no conflict of interest exists. Copyright: © 2020, American Society for Clinical Investigation. Reference information: JCI Insight. 2020;5(12):e135057.https://doi.org/10.1172/jci.insight.135057. References Tafuma TA, et al. Barriers to HIV service utilisation by people living with HIV in two provinces of Zimbabwe: Results from 2016 baseline assessment. South Afr J HIV Med. 2018;19(1):721. View this article via: PubMed Google Scholar Casper C, Crane H, Menon M, Money D. HIV/AIDS Comorbidities: Impact on cancer, noncommunicable diseases, and reproductive health. In: Holmes KK, Bertozzi S, Bloom BR, Jha P, eds. Major Infectious Diseases. Washington, DC, USA: The International Bank for Reconstruction and Development/The World Bank; 2017. Prevent HIV, Test and Treat All - WHO Support for Country Impact. World Health Organization Web Site. https://www.who.int/hiv/pub/progressreports/2016-progress-report/en/ Accessed May 18, 2020. Day TA, Kublin JG. Lessons learned from HIV vaccine clinical efficacy trials. Curr HIV Res. 2013;11(6):441–449. View this article via: PubMed Google Scholar Rerks-Ngarm S, et al. Vaccination with ALVAC and AIDSVAX to prevent HIV-1 infection in Thailand. N Engl J Med. 2009;361(23):2209–2220. View this article via: PubMed CrossRef Google Scholar Robb ML, et al. Risk behaviour and time as covariates for efficacy of the HIV vaccine regimen ALVAC-HIV (vCP1521) and AIDSVAX B/E: a post-hoc analysis of the Thai phase 3 efficacy trial RV 144. Lancet Infect Dis. 2012;12(7):531–537. View this article via: PubMed CrossRef Google Scholar Corey L, Gilbert PB, Tomaras GD, Haynes BF, Pantaleo G, Fauci AS. Immune correlates of vaccine protection against HIV-1 acquisition. Sci Transl Med. 2015;7(310):310rv7. View this article via: PubMed CrossRef Google Scholar Perez LG, et al. V1V2-specific complement activating serum IgG as a correlate of reduced HIV-1 infection risk in RV144. PLoS One. 2017;12(7):e0180720. View this article via: PubMed CrossRef Google Scholar Chung AW, et al. Polyfunctional Fc-effector profiles mediated by IgG subclass selection distinguish RV144 and VAX003 vaccines. Sci Transl Med. 2014;6(228):228ra38. View this article via: PubMed CrossRef Google Scholar [No authors listed]. Experimental HIV Vaccine Regimen Ineffective in Preventing HIV. National Institutes of Health Web Site. https://www.nih.gov/news-events/news-releases/experimental-hiv-vaccine-regimen-ineffective-preventing-hiv Published February 3, 2020. Accessed May 18, 2020. Haynes BF, et al. Immune-correlates analysis of an HIV-1 vaccine efficacy trial. N Engl J Med. 2012;366(14):1275–1286. View this article via: PubMed CrossRef Google Scholar Yates NL, et al. Vaccine-induced Env V1-V2 IgG3 correlates with lower HIV-1 infection risk and declines soon after vaccination. Sci Transl Med. 2014;6(228):228ra39. View this article via: PubMed CrossRef Google Scholar Rerks-Ngarm S, et al. Randomized, double-blind evaluation of late boost strategies for HIV-uninfected vaccine recipients in the RV144 HIV vaccine efficacy trial. J Infect Dis. 2017;215(8):1255–1263. View this article via: PubMed CrossRef Google Scholar Easterhoff D, et al. Boosting of HIV envelope CD4 binding site antibodies with long variable heavy third complementarity determining region in the randomized double blind RV305 HIV-1 vaccine trial. PLoS Pathog. 2017;13(2):e1006182. View this article via: PubMed CrossRef Google Scholar Alter G, Malenfant JM, Altfeld M. CD107a as a functional marker for the identification of natural killer cell activity. J Immunol Methods. 2004;294(1-2):15–22. View this article via: PubMed CrossRef Google Scholar Aktas E, Kucuksezer UC, Bilgic S, Erten G, Deniz G. Relationship between CD107a expression and cytotoxic activity. Cell Immunol. 2009;254(2):149–154. View this article via: PubMed CrossRef Google Scholar Lin L, et al. Human NK cells licensed by killer Ig receptor genes have an altered cytokine program that modifies CD4+ T cell function. J Immunol. 2014;193(2):940–949. View this article via: PubMed CrossRef Google Scholar Forthal DN. Functions of antibodies. Microbiol Spectr. 2014;2(4):1–17. Gray GE, Michael NL. Cautious optimism for HIV vaccine science. Curr Opin HIV AIDS. 2013;8(5):367–368. View this article via: PubMed CrossRef Google Scholar Damelang T, Rogerson SJ, Kent SJ, Chung AW. Role of IgG3 in infectious diseases. Trends Immunol. 2019;40(3):197–211. View this article via: PubMed CrossRef Google Scholar Ackerman ME, et al. Polyfunctional HIV-specific antibody responses are associated with spontaneous HIV control. PLoS Pathog. 2016;12(1):e1005315. View this article via: PubMed CrossRef Google Scholar Phillips B, et al. Adjuvant-dependent enhancement of HIV Env-specific antibody responses in infant rhesus macaques. J Virol. 2018;92(20):e01051-18. View this article via: PubMed Google Scholar Boudreau CM, Yu WH, Suscovich TJ, Talbot HK, Edwards KM, Alter G. Selective induction of antibody effector functional responses using MF59-adjuvanted vaccination. J Clin Invest. 2020;130(2):662–672. View this article via: JCI PubMed CrossRef Google Scholar Barouch DH, et al. Protective efficacy of adenovirus/protein vaccines against SIV challenges in rhesus monkeys. Science. 2015;349(6245):320–324. View this article via: PubMed CrossRef Google Scholar Barouch DH, et al. Protective efficacy of a global HIV-1 mosaic vaccine against heterologous SHIV challenges in rhesus monkeys. Cell. 2013;155(3):531–539. View this article via: PubMed CrossRef Google Scholar Liljeroos L, Malito E, Ferlenghi I, Bottomley MJ. Structural and computational biology in the design of immunogenic vaccine antigens. J Immunol Res. 2015;2015:156241. View this article via: PubMed Google Scholar Brown EP, et al. High-throughput, multiplexed IgG subclassing of antigen-specific antibodies from clinical samples. J Immunol Methods. 2012;386(1–2):117–123. View this article via: PubMed Google Scholar Ackerman ME, et al. A robust, high-throughput assay to determine the phagocytic activity of clinical antibody samples. J Immunol Methods. 2011;366(1–2):8–19. View this article via: PubMed Google Scholar Karsten CB, et al. A versatile high-throughput assay to characterize antibody-mediated neutrophil phagocytosis. J Immunol Methods. 2019;471:46–56. View this article via: PubMed CrossRef Google Scholar Fischinger S, et al. A high-throughput, bead-based, antigen-specific assay to assess the ability of antibodies to induce complement activation. J Immunol Methods. 2019;473:112630. View this article via: PubMed Google Scholar Lu LL, et al. IFN-γ-independent immune markers of Mycobacterium tuberculosis exposure. Nat Med. 2019;25(6):977–987. View this article via: PubMed CrossRef Google Scholar Lu LL, et al. A functional role for antibodies in tuberculosis. Cell. 2016;167(2):433–443.e14. View this article via: PubMed CrossRef Google Scholar Lau KS, Juchheim AM, Cavaliere KR, Philips SR, Lauffenburger DA, Haigis KM. In vivo systems analysis identifies spatial and temporal aspects of the modulation of TNF-α-induced apoptosis and proliferation by MAPKs. Sci Signal. 2011;4(165):ra16. View this article via: PubMed Google Scholar Version history Version 1 (June 18, 2020): Electronic publication

|
Suggested by
Société Francaise d'Immunologie
May 30, 2020 2:22 AM
|
To Editor COVID-19, caused by the new corona virus (SARS-CoV-2), is an emerging, rapidly evolving disease that needs rapid intervention as it shows high spread mortality rates within very short time. Interestingly, the reported cases show different severity of symptoms, ranging from mild to severe with no symptoms in some cases. Although very limited studies investigated the immune responses toward COVID-19, a recent study conducted by researchers at the Peter Doherty Institute for Infection and Immunity in Australia, assessed the immune responses in the blood from a patient with COVID-19 disease with mild severity [1]. They looked at the cellular and humoral immune responses at different time points during the infection; i.e. before, during and after resolution of the disease and recovery of the patient. Their longitudinal analysis showed a robust immune response across different cell types associates with clinical recovery. These findings are similar to what the same group have reported before in patients with influenza infection [2], [3], Accordingly, we suggest a link between the quality of the immunity and recovery from COVID-19, at least in part, in patients with mild symptoms. Indeed, different susceptibilities to COVID-19 disease were observed between different age groups where children showed lower rate of infection than adults and elderly. Although the mechanism behind these differences in infection severity and susceptibility is not clear, one possible explanation could be the difference in the quality and quantity of the immune performance that is shaped by the history of recent infections and/or vaccinations. We present here the hypothesis that the resultant immunity against prior influenza infection would, at least in part, foster immunity against SARS-CoV-2. This hypothesis is supported by which the similarity in the quality of immunity toward both viruses. and by the previous studies showing cross reactivity of immunity between Flu and coronavirus [4] due to the similarity in their structures [5], [6]. Besides the cross reactivity effect, the anti-Flu immune responses can induce bystander immunity [7] that is expected to non-specifically augment immunity against other viral infection such as SARS-CoV-2. Furthermore, influenza vaccination itself would generate sustained immunity that overall enhance immunity against SARS-CoV-2. This would explain why the rate of SARS-CoV-2 in children is low since they catch flu more than adults do [8]. As such, it is expected that their immune systems be often alarmed against influenza, generating bystander immunity that harness the immune responses against related viral infection. Under this setting, we hypothesize that children generate multifactorial immunity with the repeated influenza exposure that would offer bystander immune response in case they became infected with the new SARS-CoV-2. It might be possible also that individuals who received prior Flu vaccination might show mild severity of COVID-19 because of Flu-induced bystander effect of the generated immune responses which itself might cross react against SARS-CoV-2. Due to this cross reactivity between Flu and SARS-CoV-2, we suggest that the Flu-induced bystander immunity is more of beneficial effects to COVID-19 than those suggested by MMR and BCG vaccines [9], [10]. Indeed, the zero COVID-19 patient (the Chinese patient suspected to be the first case infected with the new corona virus) who was released from the hospital couple of weeks after her diagnosis declared that the symptoms were almost like those of her repeated flu infection [11]. Given the safety of Flu vaccine in adult, we recommend the use of Flu vaccine, at least in part, as a bystander adjuvant to minimize the severity of COVID-19 disease. We have no conflicts of interest to disclose.

|
Scooped by
Krishan Maggon
March 25, 2020 12:24 PM
|
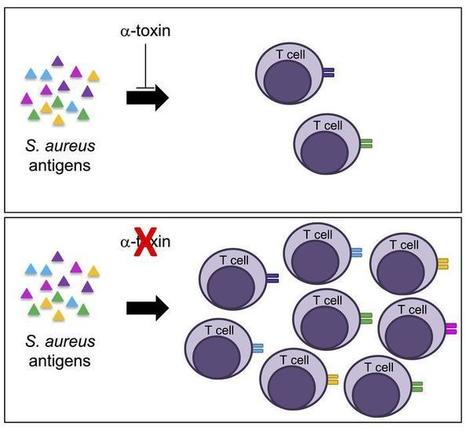
To recapitulate the clinical observation that tissue-specific responses to S. aureus shape immunity, we challenged mice with S. aureus USA300/LAC via intravenous or subcutaneous routes to model bacteremia and skin infection (Figure 1A). Bacteremic mice experienced approximately 15%–20% weight loss, regaining weight over 12 to 14 days (Supplemental Figure 1A; supplemental material available online with this article; https://doi.org/10.1172/JCI130728DS1), whereas mice exposed to skin infection harbored lesions that peaked within 2 days and resolved by day 14 (Supplemental Figure 1B). We challenged mice with S. aureus skin infection on day 40, and assessed bacterial control 4 days later. Mice challenged with intravenous S. aureus USA300/LAC exhibited smaller lesions during the secondary skin challenge than did mice exposed to a primary skin infection, as evidenced by tissue pathology (Figure 1B), dermonecrosis (Figure 1C), and bacterial burden (Figure 1D). Given the role of S. aureus α-toxin (Hla) in primary and recurrent skin infection (18, 19, 21, 22), we evaluated the anti-Hla response and found that bacteremia elicited higher IgG levels against Hla (Supplemental Figure 1C) and staphylococcal lysates (Supplemental Figure 1D) compared with primary skin infection. Following the secondary infection, initial skin exposure resulted in a limited anti-Hla response, as previously observed (22), relative to the response in mice initially subjected to bacteremia (Supplemental Figure 1C). In contrast, anti-staphylococcal antibody titers were indistinguishable (Supplemental Figure 1D), suggesting specificity of the response. Primary skin infection was associated with increased CD19+ B cells in the draining lymph node (dLN) compared with bacteremic infection, whereas splenic B cell recovery was similar (Supplemental Figure 1E), suggesting that the reduced antibody response following primary skin infection was not solely attributable to a quantitative B cell defect. To further evaluate the importance of the antibody response, primary intravenous challenge of mice deficient in mature B cells (μMT) revealed poor control of dermonecrosis (Supplemental Figure 1, F and G) and bacterial burden (Supplemental Figure 1H) during secondary skin infection compared with WT mice, a finding that correlated with loss of the anti-Hla response (Supplemental Figure 1I). Delivery of an identical inoculum (5 × 10⁶) for primary skin and bacteremic infection recapitulated these findings (Supplemental Figure 1, J and K). Although the clinical and pathologic endpoints of bacteremia and skin infection differ, these models reflect the observation in humans that S. aureus immunity depends on the initial infection site. We therefore viewed these models as comparative tools to interrogate host immunity. Figure 1 Primary S. aureusskin infection blunts the development of immunity. (A) Experimental timeline of primary intravenous (5 × 10⁶ CFU/mouse) and skin infections (1 × 10⁸ CFU/mouse) and skin reinfection (1 × 10⁸ CFU/mouse). (B) Representative gross and histopathologic (H&E-stained) images of skin lesions on postinfection day 4. Arrows denote dermonecrosis. Scale bars: 1000 μm. (C) Quantitation of dermonecrotic area following secondary skin infection in mice subjected to primary skin or intravenous challenge. (D) CFU analysis of lesions from mice in C. ****P < 0.0001, by parametric 2-tailed Student’s t test after log10 transformation and confirmation of normality with Shapiro-Wilk and Anderson-Darling tests. Data are representative of 3 (A–C) and 2 (D) independent experiments. We hypothesized that the αβ-T cell response may underlie tissue-specific features of immunity. Consistent with this, antibody-mediated depletion of CD4+ T cells concurrent with primary bacteremia (Supplemental Figure 1L) abrogated the anti-Hla response (Supplemental Figure 1M) and eliminated secondary infection protection (Supplemental Figure 1, N and O). Although multiple studies have analyzed cellular injury during skin infection (18, 21, 22), these studies have not evaluated antigen-specific T cell responses in vivo. To this end, we used the OT-II CD4+ T cell system (24) in combination with OVA-expressing S. aureus USA300/LAC (USA300OVA). OVA was not detectable when expressed via the lgt promoter (pww412OVA) (Supplemental Figure 2, A and B; see complete unedited blots in the supplemental material), however, expression was achieved using a modified promoter-enhancer element (pKLOVA). To track antigen-specific CD4+ T cell responses, we transferred CD45.1+ OT-II T cells into mice prior to intravenous or skin challenge with USA300OVA or an empty vector–harboring control strain (USA300CTL) (Figure 2A). By postinfection day 7, we observed that OT-II T cells accumulated in the skin dLNs of mice following primary infection via both routes (Figure 2B, left), whereas only bacteremia prompted splenic OT-II T cell accumulation (Figure 2B, middle). OVA-specific T cell recovery following skin infection decreased to baseline 14 days after challenge, whereas an approximately 10-fold increase in OT-II T cells persisted after intravenous infection. To assess whether primary infection produced antigen-specific memory T cells, we analyzed the expression of central memory CD44hiCD62Lhi (CM) and effector memory CD44hiCD62Llo (EM) cell markers. Both infection routes induced EM and CM responses on day 7 (Figure 2C), with an EM predominance in the spleen after bacteremia. Only primary bacteremia elicited a detectable memory OT-II T cell response until day 14. Figure 2 Antigen-specific T cell priming depends on tissue site of infection. (A) Experimental timeline of infection with S. aureus USA300OVA and cellular analysis. (B) Quantification of OT-II T cells harvested from skin dLNs and spleen 7 days after primary infection (1 × 10⁸ CFU/mouse for skin infection, and 5 × 10⁶ CFU/mouse for bacteremia) and from pooled dLNs and spleen 14 days after infection. (C) OT-II T cells as in B, classified into EM, CM, and naive phenotypes. (D) Analysis of IFN-γ expression by cells harvested from infected mice. (E) Timeline of infection and cellular analysis following secondary infection. (F) OVA-specific T cell quantification from pooled dLNs and spleens following secondary infection in mice as in E. Each dot represents 1 independent group of least 5 mice. *P < 0.05 and **P < 0.01, by 1-way ANOVA with Sidak’s multiple comparisons test (B and C) or parametric 2-tailed Student’s t test (D). Data are representative of 3 independent experiments (A–D). T cell differentiation toward effector and memory cell phenotypes during infection is shaped by local cues from antigen-presenting cells and the cytokine milieu. Although an IL-17–predominant response to S. aureus infection correlates with epithelial protection (14, 15, 25), an IFN-γ–dominant T cell response is elicited by systemic infection and required for protection (16). Our model enables assessment of the cytokine response in antigen-specific T cells and quantification of the memory response. Evaluation of OVA-specific T cells elicited by primary bacteremia revealed an increased percentage of IFN-γ–producing cells (Figure 2D); the IL-4, IL-10, and IL-17 responses did not distinguish tissue sites (Supplemental Figure 2C). To assess the recall response, mice received USA300OVA intravenously or intradermally and were then rechallenged on day 40 to generate skin infection (Figure 2E). Bacteremia elicited an increase of approximately 3-fold in OT-II T cell accumulation 3 days after rechallenge relative to that seen with skin infection (Figure 2F), with a divergent trend toward CD44hi memory T cell accumulation (Supplemental Figure 2D). Primary skin infection with an isogenic Hla mutant (USA300 hla::erm) protects against skin rechallenge (22). We hypothesized that Hla may modulate DC–T cell crosstalk during primary infection, as CD11b+ and CD103+ dermal DCs and epidermal Langerhans cells (LCs) are principal skin antigen-presenting cells (26). We subjected mice to USA300 or USA300 hla::erm skin infection, and evaluated DC numbers 4 days after infection. Administration of USA300 led to a reduction in the dLN and skin DC populations, which were restored in the absence of Hla (Figure 3A). Analysis of specific cell subpopulations revealed preservation of CD11b+ (Figure 3B) and CD103+ (Figure 3C) DCs in USA300 hla::erm–infected mice. LC numbers showed a trend consistent with protection following USA300 hla::erm infection, with a significant increase in the dLNs (Figure 3D). Diminution of the DC compartment may be the result of direct cytotoxicity by Hla or other S. aureus toxins, or may reflect tissue injury, in which local cellular damage engenders a microenvironment that is unfavorable for DC survival. Figure 3 Hla alters the skin DC response. (A) Total DC accumulation in skin dLNs and skin in mice subjected to primary skin infection with USA300 or USA300 hla::erm (1 × 10⁸ CFU/mouse). CD11b+ DC (B), CD103+ DC (C), and LC (D) accumulation following infection as in A. *P < 0.05 and **P < 0.01, by parametric 2-tailed Student’s t test. Data are representative of 3 independent experiments. To evaluate the impact of Hla on memory T cell induction, OT-II T cell recipients were infected via the subcutaneous route with USA300OVA or USA300 OVA hla::erm, and OT-II T cell accumulation was assessed 7 days after infection. Although these conditions only elicited a minimal anti–OVA IgG response (OD450: USA300OVA, 0.07 ± 0.01; USA300OVA hla::erm, 0.06 ± 0.03 vs. OVA-immunized control 0.8 ± 0.01), Hla deletion augmented EM and CM cell numbers in skin dLNs (Figure 4A) and spleen (Figure 4B). OT-II T cells were recovered from the skin only during infection with USA300 OVA hla::erm (Figure 4C). Together, these data demonstrate that Hla impairs the memory response, thereby limiting antigen-specific T cell localization. Figure 4 Modulation of the antigen-specific T cell response by Hla. (A) OT-II T cell quantification in the dLNs and (B) spleen, classified into EM, CM, and naive phenotypes 7 days after infection with USA300OVA or USA300OVA hla::erm (1 × 10⁸ CFU/mouse). (C) Skin OT-II T cell accumulation 7 days after infection as in A. (D) DCs in the dLNs and skin in mice subjected to adjuvant only or HlaH35L vaccination prior to USA300OVA infection. (E) OT-II T cell quantification in the dLNs and spleen in mice subjected to adjuvant only or HlaH35L vaccination prior to infection with USA300OVA. (F) Quantification of EM cells from mice as in E. (G) Skin gross pathology 4 days after infection in mice born to adjuvant only or HlaH35L-vaccinated dams. (H) Quantification of OT-II T cells in the dLNs and spleen following infection of mice with USA300OVA as in G. (I) EM T cell phenotype analysis of cells harvested as in H. *P < 0.05, **P < 0.01, ***P < 0.001, and ****P < 0.0001, by multiple t test comparison with Bonferroni-Dunn correction (A and B), parametric 2-tailed Student’s t test (C–E and H), or 2-way ANOVA with Sidak’s multiple comparisons test (F and I). Data are representative of 2 independent experiments. We sought to examine whether active immunization against Hla would protect the cellular immune response during skin infection. Mice were immunized with adjuvant or inactive Hla (HlaH35L) prior to skin challenge. DCs were protected at the dLN and skin sites after infection (Figure 4D), with accumulation of DCs and LCs observed in HlaH35L-immunized mice (Supplemental Figure 2, E, F, and G). We found that DC compartment preservation was associated with enhanced generation of antigen-specific T cells (Figure 4E) that exhibited an effector phenotype (Figure 4F). S. aureus recovery was reduced in skin lesions of immunized mice (Supplemental Figure 2H), mirroring findings upon infection with an Hla-deficient strain (21). S. aureus expresses leukocidins and phenol-soluble modulins that target DCs, inhibiting antigen uptake, presentation, and T cell proliferation (27, 28). As species-specific cellular receptors define the activity of multiple staphylococcal toxins (29), our observations of the role of Hla in modulating the murine antigen–specific T cell response suggest that this response may also be modified in humans through the combined cellular action of toxins. S. aureus may thus rely on multiple virulence factors in skin infection to simultaneously cause injury and manipulate host immunity. S. aureus colonizes up to 50% of infants by 8 weeks of age (30), raising the possibility that immunity is templated early in life. Indeed, studies in a Staphylococcus epidermidis neonatal skin colonization model using an antigen-specific reporter T cell system revealed that early antigen exposure promotes immunologic tolerance, characterized by the establishment of commensal-specific Tregs (31). To determine whether Hla neutralization is sufficient to protect the T cell compartment using a strategy suited for early life intervention, we evaluated the impact of maternal immunization. Mice born to HlaH35L-immunized dams had protection against skin infection relative to the offspring of control-immunized dams (Figure 4G). Enhanced OT-II T cell recovery (Figure 4H) characterized by an increase in EM cells was seen in the offspring of HlaH35L-immunized dams (Figure 4I), suggesting that passive transfer of maternally derived Hla-neutralizing antibodies engenders protection of the antigen-specific T cell response. These studies underscore the importance of T cell–mediated immunity in protection against S. aureus disease. The T cell response will not only reflect the tissue environment during primary infection, but modulate the B cell–derived humoral response. Therefore, a detailed understanding of T cell specificity and effector phenotype will be beneficial to elicit vaccine-derived protective immunity. As our studies assess the T cell response to a single exogenous antigen, further analysis of endogenous T cells elicited by infection will be necessary to discern whether Hla exposure alters T cell receptor diversity and specificity of the host antibody response. If the effects of Hla on T cell–mediated immunity occur during initial skin exposure in humans, the T cell repertoire may be perturbed by colonization or infection in infancy. This consideration has 3 important implications: first, individuals with S. aureus exposure harbor a preexisting T cell repertoire influenced by the pathogen. Thus, post-exposure vaccine trials may not be capable of favorably altering the diversity of the T cell response or specific effector functions necessary for protective immunity. Second, strategies such as maternal immunization and/or infant vaccination may be required to generate population-level protective immunity. Third, the strategic design of vaccine adjuvant and tissue delivery systems will be essential to instruct the T cell effector and memory response. By removing the suppressive effects of Hla on host immune function, immunization against Hla may expand antigen-specific T cell diversity and allow natural S. aureus exposure to amplify the T cell repertoire rather than elicit tolerogenic or suppressive responses. As potential S. aureus vaccine targets exhibit human specificity including the T cell superantigens, leukocidins LukAB, HlgCB, and Panton-Valentine leukocidin (PVL) (29), it will be essential to expand our understanding of the tissue-specific immune response to S. aureus infection beyond the constraints of mouse modeling. Further analysis of the early human response to S. aureus may thus provide insight on vaccine design.
|
|
Scooped by
Krishan Maggon
March 2, 2020 3:48 AM
|
Research ArticleOtology Free access | 10.1172/jci.insight.132880 Ultrasound-induced microbubble cavitation via a transcanal or transcranial approach facilitates inner ear drug delivery Ai-Ho Liao,1,2 Chih-Hung Wang,3,4,5 Ping-Yu Weng,6 Yi-Chun Lin,3 Hao Wang,4 Hang-Kang Chen,3 Hao-Li Liu,7 Ho-Chiao Chuang,6 and Cheng-Ping Shih4 First published January 2, 2020 - More info Abstract Ultrasound-induced microbubble (USMB) cavitation is widely used to promote drug delivery. Our previous study investigated USMB targeting the round window membrane by applying the ultrasound transducer to the tympanic bulla. In the present study, we further extended the use of this technology to enhance drug delivery to the inner ear by introducing the ultrasound transducer into the external auditory canal (EAC) or applying it to the skull. Using a 3-dimensional–printed diffusion apparatus mimicking the pathway for ultrasound passing through and reaching the middle ear cavity in vitro, the models simulating the transcanal and transcranial approach demonstrated 4.8-fold– and 3.7-fold–higher delivery efficiencies, respectively. In an in vivo model of guinea pigs, by filling tympanic bulla with microbubbles and biotin-FITC, USMB applied transcanally and transcranially induced 2.8-fold and 1.5-fold increases in biotin-FITC delivery efficiencies, respectively. In addition, the gentamicin uptake by cochlear and vestibular hair cells and gentamicin-induced hair cell loss were significantly enhanced following transcanal application of USMB. On the 28th day after transcanal USMB, safety assessment showed no significant changes in the hearing thresholds and the integrity of cochlea. These are the first results to our knowledge to demonstrate the feasibility and support the potential clinical application of applying USMB via EAC to facilitate drug delivery into the inner ear. Graphical Abstract Introduction The clinical administration of drugs to the inner ear can be performed systemically or locally (1). The local intratympanic injection of drugs has generally been used since 1990 and is recognized as the most effective and least harmful current method. The treatment agent is injected into the middle ear cavity via an intratympanic injection, and it enters the inner ear via absorption by the round window membrane (RWM) and oval window (2, 3). The distribution of the drug in the inner ear depends on which window it enters the inner ear through and whether it is administered systemically or locally. The perilymph circulation in the inner ear is slow, and the blood-labyrinth barrier prevents a drug in the blood from entering the inner ear; both mechanisms make the systemic route for inner ear drug delivery inefficient (1). Moreover, the drug will accumulate in cochlea at only a low concentration; therefore, many methods are currently being investigated to improve the permeability of the RWM for local drug delivery. Some efficient carriers such as poly (lactic-co-glycolic acid) nanoparticles and phospholipid-based nanoparticles are used as inner ear nanoparticulate carriers to produce better therapeutic effects and to maintain long-term particle circulation in the perilymph (4, 5). Some agents such as collagenase (6), histamine and local anesthetic phenols (7), and hyaluronic acid (8) have been applied to the RWM to destroy its outer epithelial cells and thereby enhance drug delivery without resorting to surgery. However, these approaches may cause infection in the middle ear cavity and damage the RWM — or even the inner ear, itself (9). Therefore, identifying a simple and effective method that does not damage the structure of the cochlea is an important issue for inner ear drug delivery. A previous in vitro study created microperforations in the RWM with a 12.5-μm–diameter needle to enhance diffusion through the membrane (10). Two designs of multiple (4 or 8) serrated needles were investigated, and it was found that an octagonal needle arrangement produced an oval-shaped perforation of the RWM that performed better than when using 4 needles (11). However, the ability to create a hole of an appropriate size in the RWM during surgical manipulation without a deleterious increase in the intracochlear pressure remains to be demonstrated. Improved versions of the microbubbles (MBs) that are commonly used as ultrasound (US) contrast agents have recently be used to improve the diagnostic confidence in echography and in combination with US as a tool for drug delivery and therapeutic monitoring. Applying this technique to clinical use requires evaluations of the sonoporation mechanisms, US parameters, and drug types and doses (12). Transcranial noninvasive MRI-guided focused US is a method of disrupting the blood-brain barrier (BBB) for enhancing brain tumor treatments via i.v. injected MBs interacting with the US (13). Additionally, MB echoes can be detected with passive cavitation detection (PCD) for real-time feedback control the BBB disruption during focused US-induced MB (USMB) cavitation (14, 15). The use of focused USMB cavitation for BBB disruption is receiving considerable attention, and there are now widely accepted measures of safety and a good understanding of its clinical relevance (16). However, the feasibility of this noninvasive technique has not been widely investigated for other applications. Our previous study demonstrated the practical application of using USMB to increase the permeability of the RWM, in which a surgical technique was used to remove the temporal bone and expose the membrane (17). We subsequently expanded that technique to explore the delivery of dexamethasone mediated by USMB and its protective effects against noise exposure in animal models (18). In clinical practice, the transcanal approach is often indicated for transtympanic injections of drugs to treat various inner ear diseases and is applied to most patients undergoing endoscopic ear surgery (19). The transcanal approach has the advantage of conveniently and directly reaching the middle ear without needing to make an external incision. The present study used 2 nonsurgical techniques (transcanal and transcranial USMB approaches) to facilitate drug delivery into the inner ear through the RWM in vivo. Before performing the animal experiments, the feasibilities of the USMB techniques for transcanal and transcranial approaches were demonstrated in vitro with a 3-dimensional–printed (3D-printed) diffusion apparatus that mimics 2 pathways for the US sonication: (a) through the external auditory canal and tympanic membrane, reaching the middle ear cavity and targeting the RWM, and (b) through the skull bone, reaching the middle ear cavity and targeting the RWM. For measuring drug diffusion through the guinea pig RWM, some previous studies have used 3D-printed acrylic holders adapted to the round window niche using 3-mL Franz diffusion cells (10, 11). However, the large volume of these Franz cells and the time-consuming procedures necessary to obtain transport parameters greatly restrict their application. A previous study demonstrated a 3D-printed, pocket-size diffusion cell as an in vitro tool for analyzing skin permeation (20). Therefore, a potentially new 3D-printed diffusion apparatus for the initial assessment of drug permeation through the RWM was necessary to simulate the volume of the middle ear cavity, which might affect the efficacy of USMB cavitation for inner ear drug delivery. Moreover, PCD was used to evaluate the use of stable or inertial USMB cavitation for inner ear drug delivery. Since the transcanal and transcranial delivery methods are noninvasive, it is expected to be straightforward to translate USMB cavitation to the clinical enhancement of inner ear drug delivery in the near future. Results Optimizing the in vivo parameters for middle ear USMB. High-frequency US images of 1.4 × 10⁷ MBs/mL albumin-shelled MBs without and with US sonication at 1, 2, 3, and 4 W/cm2 for 1 minute are shown in Figure 1, A–E, respectively; the signal intensities in Figure 1, A–E, are quantified in Figure 1F. The image intensity of the MBs before US sonication was 21.1 ± 0.2 dB, and 7.5 ± 0.9, 4.9 ± 0.9, 3.8 ± 0.3, and 3.8 ± 0.4 dB with US sonication at 1, 2, 3, and 4 W/cm2 for 1 minute, respectively. The efficiencies of MB destruction for US sonication at power densities of 1, 2, 3, and 4 W/cm2 for 30 seconds were 64.45%, 76.78%, 81.99%, and 81.99%, respectively. The temperature in the chamber during sonication at the different US powers increased by 1.25°C–1.80°C. In this experiment, applying US at a power density of 3 W/cm2 for 1 minute almost destroyed the MBs, and this was the highest efficiency setting for the subsequent in vivo transcanal and transcranial approaches. Figure 1 High-frequency US images of MBs before and after US sonication. (A–E) Images were obtained before application of US (A) and following application of US at power densities of 1 (B), 2 (C), 3 (D), and 4 (E) W/cm2 for 1 minute. Diameter of round areas in the images 4 mm. (F) Quantification of the signal intensities. Multigroup comparisons using 1-way ANOVA, followed by post hoc Tukey’s tests. Values are expressed as mean ± SD (n = 5 per group). US, ultrasound; MBs, microbubbles. *P < 0.05, **P < 0.01, ***P < 0.001, #P < 0.001 relative to control group; 1-way ANOVA followed by Tukey’s multiple-comparisons test and 2-tailed Student’s t test. High-frequency US images of MBs without and with US sonication at 1, 2, 3, and 4 W/cm2 for 3 minutes through the skull bone are shown in Figure 2, A–E, respectively; the corresponding image intensities of the MBs were 20.1 ± 0.9, 8.6 ± 1.5, 6.0 ± 0.6, 4.1 ± 0.2, and 4.2 ± 0.6 dB, respectively. The efficiencies of MB destruction for US sonication at power densities of 1, 2, 3, and 4 W/cm2 for 3 minutes were 57.20%, 70.15%, 79.60%, and 79.10%, respectively. The temperatures on the skull bone and in the chamber of the phantom during US sonication at the different powers increased by 3.90°C–8.80°C and 1.10°C–2.30°C, respectively. The results indicate that the albumin-shelled MBs were significantly destroyed after being sonicated with US at 3 W/cm2 through either the tympanic membrane or the skull bone (P < 0.001, Figure 1F; P < 0.001, Figure 2F). Therefore, the highest US power density of 3 W/cm2 (for 1 and 3 minutes in the transcanal and transcranial approaches, respectively) was used in the subsequent in vitro and in vivo experiments. Figure 2 High-frequency US images of MBs before and after US sonication through the skull base. (A–E) Images were obtained before US (A) and following application of US at power densities of 1 (B), 2 (C), 3 (D), and 4 (E) W/cm2 for 3 minutes. The diameter of the round area in the images is 4 mm. (F) Quantification of the signal intensities. Multigroup comparisons using 1-way ANOVA, followed by post hoc Tukey’s tests. Values are expressed as mean ± SD (n = 5 per group). *P < 0.05, **P < 0.01, ***P < 0.001, #P < 0.001 relative to control group; 1-way ANOVA followed by Tukey’s multiple-comparisons test and 2-tailed Student’s t test. In vitro cavitation detection. In vitro tube-phantom experiments were conducted to characterize how the energy spectrum density changed with MB infusion. Figure 3 shows the area under the receiver operating characteristics curve (AUC) for 2 MB concentrations (1, original, 1.40 × 10⁸ MBs/mL; 10×, 10-fold dilution 1.40 × 10⁷ MBs/mL) for 120 seconds (60–180 seconds). The detected AUC increased with the injections of MBs at the 60th second and returned to the baseline value when the injection of MBs into the tube phantom was stopped after 180 seconds. In Figure 3A, the AUCs for the inertial cavitation and stable cavitation of MBs at the 10× and 1× dilutions from 60–180 seconds were 3102 ± 899 (inertial cavitation, MBs 10×), 1449 ± 340 (inertial cavitation, MBs 1×), 1263 ± 323 (stable cavitation, MBs 10×), and 641 ± 145 (stable cavitation, MBs 1×). In Figure 3B, with US sonication through the skull bone, the detected AUCs for the inertial cavitation and stable cavitation of MBs at the 10× and 1× dilutions from 60–180 seconds were 2292 ± 555 (inertial cavitation, MBs 10×), 2006 ± 220 (inertial cavitation, MBs 1×), 960 ± 242 (stable cavitation, MBs 10×), and 796 ± 88 (stable cavitation, MBs 1×). US sonication at a power density of 3 W/cm2 resulted in inertial cavitation that was more significant than stable cavitation at a dilution of either 10× or 1×, especially after injecting MBs. When the US sonication was applied through the skull bone, the detected average AUCs decreased in all experimental groups due to the attenuation caused by the bone. Moreover, the inertial cavitation was highest for MBs at the 10× dilution, and so this was used in the subsequent in vitro and in vivo experiments. Figure 3 In vitro cavitation detection of 2 dilutions of MBs during US sonication. (A) Energy spectra acquired from PCD during US sonication for 2 dilutions of MBs. (B) Energy spectra acquired from PCD during US sonication through the skull bone for 2 dilutions of MBs. (C) Quantification of the energy density of stable cavitation and inertial cavitation in A and B (n = 7 per group). Data are mean ± SD values. PCD, passive cavitation detection; US, ultrasound; MBs, microbubbles. *P < 0.05, **P < 0.01, ***P < 0.001; 2-tailed Student’s t test. In vitro efficacy of USMBs for RWM permeation. Figure 4A shows the biotin-FITC concentrations in the 4 groups for membrane penetration as analyzed using a fluorometer. In the 3D-printed diffusion cell model, the USMB cavitation greatly improved the biotin-FITC delivery in groups M1 (the single-membrane model), M1-20° (the single-membrane model, simulating the deviating the US transducer 20° from the center), M2 (the 2-membranes model, simulating the transcanal approach), and M1+B (the single-membrane model through the skull bone, simulating the transcranial approach) by about 6.9, 5.7, 4.8, and 3.7 times, respectively, compared with solely soaking biotin-FITC within the diffusion cell. The concentration differed significantly (P < 0.05) between the round window soaking (RWS) and USM (USMB treatments) groups. Figure 4 In vitro and in vivo efficacy of USMBs for RWM permeation. (A) In vitro biotin-FITC concentrations in the 4 experimental groups (M1, M1-20°, M2, and M1+B) with the 3D-printed diffusion apparatus (n = 10). (B) In vivo biotin-FITC concentrations in the perilymphatic fluid of the inner ear of the USM and RWS groups in the transcanal and transcranial arms (n = 4). *P < 0.05, ***P < 0.001; 2-tailed Student’s t test. Data are mean ± SD values. Transcanal or transcranial USMB promote the delivery of drugs into the inner ear without auditory damage. To confirm the efficiency of in vivo USMB-mediated drug delivery to the inner ear system, biotin-FITC was used as the delivery agent in the guinea pig model. The results for the inner ear perilymph in the transcanal and transcranial arms are shown in Figure 4B. In the transcanal arm, the fluorescence intensity of biotin-FITC when using the transcanal approach was significantly higher in the USM group than in the RWS group (4620 ± 202.9 vs. 1633 ± 72.6, P = 0.013). When performing the transcranial approach, the USM group also exhibited a higher level of biotin-FITC than that in the RWS group (10,113 ± 338.8 vs. 6700.0 ± 69.7, P = 0.049). The application of USMBs increased the delivery of biotin-FITC by approximately 2.8-fold in the transcanal approach and 1.5-fold in the transcranial approach. These findings demonstrate that exposure to USMB via either of the 2 approaches facilitated the delivery of drugs into the inner ear and that this was higher in the transcanal approach than the transcranial approach. Since the transcanal approach is also a more practical procedure for clinical application, the transcanal USM group was assessed in the following experiments. Gentamicin was used to further assess the efficacy of using transcanal USMB to enhance drug delivery to the inner ear. In the clinical situation, gentamicin can be injected intratympanically to treat patients with Ménière’s disease to improve the episodes of vertigo that they experience (21). In the USM group of the present experiments, 200 μL of a mixture of gentamicin (40 μg/mL) and MBs (1.40 × 10⁷ MBs/mL) were injected into the middle ear cavity; then, US sonication was performed via the transcanal approach. The RWS group only received the injection of the mixture. The control group only received the injection of gentamicin solution without MBs. Two days after the exposure to USMBs, the cochlear and vestibular tissue was harvested for analyzing the uptake of gentamicin. In parallel with phalloidin, myosin 7a, a hair cell marker, was also used to label the hair cells to determine gentamicin uptake of the hair cells in these groups. There was a marked disparity in the distribution of gentamicin between these 2 groups (Figure 5). The USM group exhibited robust fluorescence of gentamicin labeling in the inner and outer hair cells in all turns of the cochlea — especially in the basal turn. In contrast, the RWS and control groups presented with weak and sparse gentamicin labeling in the basal and second turns, and no fluorescence was detected in the third turn. Compared with the RWS and control groups, the USM group exhibited greater uptake of gentamicin in the hair cells in all turns of the cochlea (Figure 5). In utricle and saccule of the vestibula, the USM group exhibited the most intense fluorescence of gentamicin labeling in the hair cells. The RWS and control groups presented with scattered labeling (Figure 6). These results demonstrate that transcanal USMBs enhance the uptake of gentamicin by hair cells and suggest that this technique can be applied to facilitate the administration of drugs delivered into the inner ear through the RWM. Figure 5 Exposure to USMBs enhances the cellular uptake of gentamicin in the cochlea. Samples were obtained from the cochleae 2 days after gentamicin treatments. Representative confocal microscopic images of indirect immunofluorescence staining show stronger localization of gentamicin uptake (green) in the USM group than in the RWS and control (gentamicin treatment without MBs) groups in the basal, second, and third turns. Four repetitions of this experiments were conducted. Myosin 7a, cell bodies (red); phalloidin, stereocilia bundles (magenta); DAPI, nuclei (blue). Scale bar: 50 μm. USM, ultrasound microbubble treatment; RWS, round window soaking; GM, gentamicin. Figure 6 Exposure to USMBs enhances the cellular uptake of gentamicin in the utricle and saccule. Samples were obtained from the vestibule end organs 2 days after gentamicin treatments. Representative confocal microscopic images show the localization of gentamicin uptake (green) by indirect immunofluorescence staining. Four repetitions of this experiments were conducted. Myosin 7a, cell bodies (red); phalloidin, stereocilia bundles (magenta); DAPI, nuclei (blue). Scale bar: 50 μm. USM, ultrasound microbubble treatment; RWS, round window soaking; GM, gentamicin. Subsequently, a longer-term analysis of hair cell loss in the cochlea and vestibule was performed to follow up on the enhancement of gentamicin delivery by USMBs. Two weeks after the gentamicin treatment, the cochlear and vestibular tissues were harvested for analysis of the hair cell loss. The number of myosin 7a–positive cells in the inner and outer hair cell regions was smaller in the USM group than in the RWS group (Figure 7). The basal turn of the USM group showed the severest hair cell loss. In the utricle and saccule, the USM group exhibited a drastically reduced density of myosin 7a–positive cells and severe damage to the stereocilia bundles in the sensory epithelium (Figure 8), whereas the RWS group presented a greater density of myosin 7a–positive cells and less loss of stereocilia bundles in the sensory epithelium. These results demonstrate that USMB-assisted gentamicin treatment is more effective for vestibular ablation than is the current clinical practice. Therefore, USMB-assisted drug delivery may represent an option for treatment of patients with Ménière’s disease. Figure 7 Exposure to USMB leads to a severer hair cell loss in the basal and second turns of the cochlea. Samples were obtained from the cochleae 2 weeks after gentamicin treatments. Representative confocal microscopic images demonstrate fewer cells stained by myosin 7a in the USM group than the RWS group in the basal turn and second turn. Four repetitions of this experiments were conducted. Phalloidin, stereocilia bundles (green); myosin 7a, cell bodies (red); DAPI, nuclei (blue). Scale bar: 50 μm. Figure 8 Exposure to USMB leads to a severer hair cell loss in the utricle and saccule of the vestibule. Samples were obtained from the vestibule 2 weeks after gentamicin treatments. Representative confocal microscopic images demonstrate that cells stained by myosin 7a in the utricle and saccule from the USM group are diminished more than the RWS group. Four repetitions of this experiments were conducted. Phalloidin, stereocilia bundles (green); myosin 7a, cell bodies (red); DAPI, nuclei (blue). Scale bar: 50 μm. Finally, the presence of any auditory compromise related to this technique was investigated in order to assess its safety. The integrity of the tympanic membrane following exposure to USMB was inspected using an operating microscope. No perforation of the tympanic membrane was found in the USM group at 4 weeks after the US sonication. The loss of hair cells in the surface preparations of the organ of Corti was also investigated after exposure to USMB (Figure 9A). The results indicated that there was no significant hair cell loss in any of the 3 turns of the cochlea at 4 weeks following the exposure. Functional assessments of hearing showed no significant difference in the auditory brainstem response (ABR) threshold at any of the tested frequencies after exposure to USMBs in the USM group (Figure 9B), as well as no differences in ABR thresholds between the USM and RWS groups. These data suggest that the transcanal approach for exposure to USMB does not cause either structural or functional damage in the inner ear. Figure 9 Hearing assessment and evaluation of the integrity of cochlear sensory epithelium in guinea pigs 28 days after ultrasound microbubble (USMB) treatments. (A) Representative images of cochlear surface preparations by immunofluorescence staining shows the nuclei (blue, DAPI), filamentous actin (green, phalloidin), and cell bodies (red, myosin 7a). Four repetitions of this experiments were conducted. Scale bar: 50 μm. (B) The auditory brainstem response (ABR) threshold recording with click and tone-burst stimuli before (day 0) and at a 1-month follow-up after USMB treatments. The results are expressed as the mean ± SEM, with n = 4 for each bar; 2-tailed Student’s t test. RWS, round window soaking; USM, ultrasound microbubble treatment. Discussion The clinical application of using USMB cavitation to promote inner ear drug delivery requires evaluations of the sonoporation mechanisms, US parameters, and the delivery methods for US sonication and MBs. Intratympanic injection is currently the most popular method for delivering drugs into the inner ear, since it can be delivered without encountering the blood-labyrinth barrier or systemic side effects and has been used in clinical applications for many years (22). In the present study, MBs mixed with a fluorescent drug were delivered into the middle ear cavity via a transtympanic injection, and US was then applied to the temporal bone of the skull (transcranial approach) or the external auditory canal (transcanal approach) to induce the cavitation of MBs and increase the permeability of the RWM in order to enhance drug delivery. PCD was performed either directly or through the skull bone to quantify the stable cavitation and inertial cavitation. Figure 3 shows that the average AUCs for the inertial cavitation of MBs at dilutions of 10× (1.40 × 107 MBs/mL) and 1× (1.40 × 108 MBs/mL) were significantly higher than those for stable cavitation, irrespective of whether or not the US sonication was applied through the skull bone (P < 0.01). Moreover, the 10× dilution of MBs provided the optimal concentration for inertial USMB cavitation. These results are consistent with the results shown in Figures 1 and 2. Although the destruction efficiencies of MBs under US sonication applied through the skull bone at power densities of 3 and 4 W/cm2 reached 79.1%–79.6%, the duration of sonication was 3 minutes, which was longer than the sonication duration (1 minute) in the group with US sonication applied through the tympanic membrane. We found that sonication at a power density of 3 W/cm2 for 1 minute in the transcanal approach and 3 minutes in the transcranial approach can disrupt most of the MBs and induce inertial cavitation more effectively; therefore, these parameters and conditions were used in the in vitro and in vivo experiments. However, thermal effects of USMB cavitation were more obvious on the surface of the cranium (temperature increase, 6.40°C ± 0.70°C) and in the chamber loaded with MBs (temperature increase, 2.04°C ± 0.29°C) in the transcranial approach than in the transcanal approach (temperature increase in the chamber, 1.75°C ± 0.15°C). The longer duration of sonication in the transcranial approach resulted in a significant temperature increase on the surface of the cranium, which may raise safety concerns about any adverse events when applied for clinical trial. A temperature elevation of 1°C–1.5°C has been recommended to be applied indefinitely without concern on safety grounds (23). It therefore seems unlikely that the thermal adverse effects were involved in our transcanal approach. In 1997, the US Food and Drug Administration suggested that the use of synthetic membranes, such as polysulfone or cellulose acetate, in drug-diffusion studies involving Franz cells is suitable for assessing the performance of topical formulations when biological skin is not readily available (24, 25). This led to several studies that assessed topical drug diffusion using porous synthetic membranes (24, 26, 27). For assessment of in vitro inner ear drug delivery, several formulations and methodologies have been investigated using a modified diffusion cell setup with a synthetic membrane (4.5–5.0 μm pore size) (28–31). For example, in a modified in vitro diffusion cell experiment, the synthetic membrane was regarded as akin to the RWM, as it separated the donor chamber above (simulating the middle ear cavity) from the receptor chamber below (simulating the inner ear) for evaluation of intratympanic formulations for inner ear delivery (28). We therefore used synthetic cellulose membranes in the present study to mimic the tympanic membrane and the RWM and to detect the effects of USMB on inner ear permeation. The results obtained using the 3D-printed diffusion apparatus indicated that the delivery efficiency was 4.8-fold higher in the 2–synthetic membranes model (group M2, simulating the transcanal approach) and 3.7-fold higher in the single-membrane model through the skull bone (group M1+B, simulating the transcranial approach). Therefore, the sonication in the simulated transcanal approach at 3 W/cm2 for 1 minute enhanced the drug delivery by more than 29.7% compared with that in the simulated transcranial approach (with each experiment performed 3 times). In the small-animal experiments, the application of USMBs increased the drug delivery by approximately 2.8-fold via the transcanal approach and 1.5-fold via the transcranial approach. Although drug delivery can be facilitated using either transcanal or transcranial exposure to USMB, the transcanal approach is superior for several reasons. First, the efficiency of delivery into the inner ear was higher for the transcanal than for the transcranial approach. Second, the middle ear cavity is very small, the structure of the ear is very intricate, and the skull bone of the guinea pig is thinner than 1 mm (32). By contrast, the use of the transcranial method in the human temporal bone for inner ear drug delivery is restricted by the pneumatization of the bone, which is typically 6–7 mm thick (33, 34). A third reason is that the transcanal approach is currently regarded as the ideal route for minimally invasive ear surgery (35). Compared with the retroauricular approach, the transcanal approach offers advantages that include no skin incision, no hair loss, and a short recovery time. The administration of drugs for treating diseases of the middle and inner ears is often accomplished using transtympanic injections via the external auditory canal (36). A fourth reason is that our immunofluorescence analysis of the gentamicin distribution in the cochlea by confocal microscopy showed that transcanal exposure to USMB clearly enhanced the uptake of gentamicin by the hair cells. Accordingly, transcanal exposure to USMB appears to be an effective, noninvasive method for delivering drugs to the inner ear and can be easily applied in clinical practice. Our assessments of its safety demonstrated intact hearing function and no significant hair cell loss in any of the 3 turns of the cochlea at 4 weeks following the US sonication. Some shortcoming of the procedures applied in our study need to be overcome before translating the techniques to clinical applications. First, an intracanal incision was made in the animal in order to place the US transducer in the ear canal close to the tympanic membrane. The clinical requirement of not performing such an incision would require the size and shape of the US transducer to be customized based on the lumen of the human ear canal. Second, our technique involved repeated intratympanic injections of the mixture of drug and MBs for 3 repetitions of exposure to USMB. This is associated with a risk of persistent tympanic membrane perforation, although no perforation of the tympanic membrane was found in any of our animals at 4 weeks after exposure to USMB. A rate of 1.6% was reported for persistent perforation of the tympanic membrane following multiple intratympanic steroid injections (37). Modifying the USMB cavitation settings to reduce the number of the injections may avoid this complication and is another important issue to investigate further. Third, during exposure to USMB, the US probe was about 5 mm from the tympanic membrane, and this space needed to be filled with saline to ensure efficient US sonication. The US transducer should be refined so that the probe can be attached to the tympanic membrane and thereby avoid the need for water infusion into the ear canal during the US sonication of the middle ear. The design for such a facilitation of inner ear drug delivery needs to be further examined. The presence of the blood-labyrinth barrier hampers systemic drug administration to the inner ear; therefore, the different methods and devices for enhancing local drug delivery have been devised for improving medical therapies for inner ear diseases (38). Most of these delivery devices and drug carriers are applied via the external auditory canal. The present results suggest that the application of transcanal USMB to the middle and inner ears does not damage the inner ear or auditory responses. This study is the first to our knowledge to demonstrate that the noninvasive combination of US with MBs can enhance drug delivery via the external auditory canal into the inner ear. More investigations into refining this method and its mechanisms for use in clinical applications can be expected in the near future. In conclusion, this study investigates the feasibility of transcanal and transcranial approaches when performing USMB cavitation for enhancing the delivery of drugs to the inner ear. The PCD results indicate that the inertial cavitation of USMB is significantly higher than stable cavitation, irrespective of whether or not the US passes through the skull bone. The results obtained using the 3D-printed diffusion apparatus indicated that the delivery efficiency was higher for the transcanal USMB method than the transcranial method. This is due to the possibility that the skull bone of the guinea pigs may attenuate the US energy. The results obtained in the small-animal experiments suggest that applying USMB via a transcanal or transcranial approach targeting the middle ear would enhance drug delivery into the inner ear, with the transcanal approach exhibiting a higher delivery efficiency and shorter US sonication time. Moreover, the transcanal approach does not damage the inner ear or auditory responses. The present study shows that the use of noninvasive transcanal USMB for inner ear drug-delivery enhancement in further clinic applications can be expected. Methods Production of albumin-shelled MBs. Albumin-shelled MBs were prepared according to the procedure used in our previous studies (39, 40). Briefly, albumin-shelled MBs were generated by 2 minutes of sonication (Branson Ultrasonics) of a 10-mL solution containing 140 mg of albumin (Octapharma) and perfluorocarbon gas in physiological saline (pH 7.4, 0.9% sodium chloride). The albumin-shelled MBs had a diameter of 1.02 ± 0.11 μm (mean ± SD) and a concentration of 1.40 × 10⁸ MBs/mL. Optimization of US parameters for USMB cavitation by agarose phantoms. The sonication effects on MBs in vitro were evaluated by high-frequency US imaging using a commercial animal US imaging system (Prospect, S-Sharp Corporation) in tissue-mimicking agarose phantoms, as described previously (41). Briefly, a 2% agarose square-column phantom (10 × 20 × 20 mm3) was constructed with a 2 × 2 × 20 mm3 chamber at its center to load 400 μL of 1.4 × 10⁷ MBs/mL, followed by sonication through the tympanic membrane (which simulated transcanal USMB cavitation in the middle ear cavity) or through the skull bone (which mimicked transcranial US sonication). We used a 10-mm diameter US transducer (ST2000V, Nepagene) operating at 1 MHz. The power density was set at 1, 2, 3, or 4 W/cm2 with a duty cycle of 50% and a pulse repetition period of 250 ms for 1 minute in the transcanal group and 3 minutes in the transcranial group. High-frequency US images were obtained using a transducer with a central frequency of 40 MHz, with axial and lateral resolutions of 30 and 60 μm, respectively (Prospect, S-Sharp Corporation). The axial and lateral fields of view were 20 and 20 mm, respectively. Real-time B-mode imaging was performed, and the image planes were acquired with optimization of the gain and the time-gain compensation settings, which were kept constant throughout the experiments. Images were processed with custom MATLAB programs (The MathWorks) to evaluate the destruction efficiency. The region of interest was drawn over the entire MB-loaded chamber in 2D imaging planes by the operator, the dynamic range was set at 50 dB, and the average pre- and postsonication image intensities were measured in B-mode images. PCD. Our previous studies have suggested that USMB disruption (i.e., inertial cavitation) is required for effective transdermal drug delivery (42–44). Recent studies have demonstrated that the acoustic-emission signals acquired in PCD could be used to quantify the subharmonic-frequency component and inertial cavitation dose, which represent the index of stable cavitation and inertial cavitation, respectively (45, 46). We therefore set up such a PCD system to clarify the type of cavitation that occurred in the present study (Figure 10). The transducer of a US sonoporation system and a PCD were arranged confocally using a self-made holder, with an included angle of approximately 120°, which was limited by their focal lengths and physical dimensions (47). The US parameters for MB cavitation in vitro were established by performing experiments at a power intensity of 3 W/cm2. A polyethylene (PE) tube filled with degassed water was placed in a degassed water tank 7 mm below the PCD (measured from the US sonoporation transducer to the center of the PE tube). The total receiving time was 240 seconds, and 0.5 mL of MBs solution was injected at the 60th second. During US sonication (from 60th to 180th second), the detector was a single-element, spherically focused 1-MHz transducer (diameter of 12.5 mm; V303-SU, Olympus). The holder was mounted on a computer-controlled 2D motion stage (HR8, Nanomotion). The MB echoes were received by the 1-MHz transducer and then amplified by a broadband receiver (BR-640, Retec). The detected emissions were then quantified using spectrum-based energy-spectral-density analysis with MATLAB. Figure 10 The passive cavitation detection (PCD) setup for measuring USMB cavitation. Diffusion apparatus for RWM permeation. The large volume of the Franz cells (5–10 mL) and the time-consuming procedures necessary to obtain transport parameters were inappropriate for the RWM permeation assay. To overcome these issues, we designed a 3D-printed diffusion apparatus to mimic the pathway for US sonication passing through the external auditory canal (the transcanal approach) or through the mastoid bone (the transcranial approach) to verify their cavitation effects for the USMB in the middle ear cavity when targeting the RWM for drug delivery in vitro. This in vitro diffusion cell apparatus was constructed using an online computer-aided-design program and produced using a 3D printer (Dforce D300, Synmao Technology Enterprise). A glycol-modified version of PE terephthalate filament is a thermoplastic material that was used to 3D print the diffusion apparatus in this study. Two types of diffusion apparatus setups were designed with SolidWorks (Dassault Systèmes SolidWorks Corporation), as shown in Figure 11 (the 2-membranes model [group M2], simulating the transcanal approach in Figure 11, C and F, and the single-membrane model through the skull bone [group M1+B], simulating the transcranial approach in Figure 11D), which consisted of a 0.5-mL donor, an intervening cellulose membrane (1000 kDa; Orange Scientific), and 0.4-mL receiving compartments (Figure 11, A, B, and D); and 0.5-mL donor compartments, an external membrane, 0.25-mL interval chamber (the volume was consistent with the middle ear cavity), an internal membrane, and 0.4-mL receiving compartments (Figure 11, C and F). Figure 11D shows the donor chamber in Figure 11, A and E, capped by a 5 × 5 mm2 skull bone. Figure 11 In vitro and in vivo efficacy of USMBs for RWM permeation. The 3D-printed apparatus mimics the pathway for US sonication passing through in vitro when the US probe is placed in the external auditory canal or on the skull, passing through the tympanic membrane and the RWM when the US probe is placed in the external auditory canal, or passing through the bone and the RWM when the probe is placed on the skull in vitro. (A) Single-membrane model (group M1). (B) US transducer deviated 20° from the center in the single-membrane model (group M1-20°). (C) A 2-membrane model simulating the transcanal approach (group M2) involving placing the US probe in the external auditory canal. (D) A bony plate plus 1-membrane model simulates the transcranial approach (group M1+B), by placing the US probe on the skull. (E and F) SolidWorks designs of the custom 3D-printed single-membrane model (E) and the 2-membranes model (F). The drug delivery effect when the RWM was not directly sonicated by US was evaluated by deviating the US transducer 20° from the center (group M1-20°), as shown in Figure 11B. The parafilm (Pechiney Laboratory Safety Products and Apparel) occluded the outside seam of the apparatus in order to guarantee that the system was sealed. At the beginning of the experiments, each donor compartment was completely filled with the receiving medium, consisting of a 500-μL mixture of biotin-FITC (40 μg/mL; Anaspec) and MBs (1.40 × 10⁷ MBs/mL), and the probe of the sonoporation system was applied to the donor cells. The 1-MHz US transducer of the sonoporation system positioned 5 mm from the top of the membrane provided sonication at a power density of 3 W/cm2 (acoustic pressure, 0.266 MPa) for 1 minute in the single-membrane model (group M1 and group M1-20°) and 2-membrane model (group M2), and for 3 minutes in group M1+B. Samples obtained from the receiving compartment were analyzed by a fluorometer (Fluoroskan Ascent FL, ThermoLab Systems). Animal study and surgical procedures. The destructive effects of the USMB through the real tympanic membrane or bony plate were examined by harvesting skull bone and the bilateral tympanic membranes with the surrounding tympanic bone from 2 CO2 gas–sacrificed guinea pigs. These harvested materials were then used in an experiment of high-frequency US imaging of a tissue-mimicking agarose phantom (Figure 12A). A total of 30 pigmented male guinea pigs (weighing 250–350 g) with a normal Preyer reflex were assigned to the transcanal and transcranial arms of the experiments. Each arm was allocated to 3 groups: the USMB treatment (USM), RWS, and gentamicin only (GM) groups. Anesthesia was induced with an intramuscular injection of ketamine (Imalgene, Merial) at 80 mg/kg and xylazine (Rompun, Bayer HealthCare) at 10 mg/kg, and the animals were kept warm with a heating pad for all subsequent manipulations. In the transcanal arm animals, a small incision was made in the cartilaginous portion of the external auditory canal, and a speculum was inserted into the canal to provide a better view of the tympanic membrane and the manipulation approach (Figure 12B). For USMB treatment groups, 200 μL of a mixture of gentamicin (40 mg/mL; Biological Industries) and MBs (1.40 × 10⁷ MBs/mL) was injected through the antero-inferior region of the tympanic membrane into the middle ear cavity using a syringe with a 25-gauge needle. The US transducer was then inserted into the speculum and positioned 5 mm from the tympanic membrane. The space between the tympanic membrane and the probe was filled with saline as a conductive medium, followed by a 1-minute application of US sonication targeting the middle ear cavity at a power density of 3 W/cm2 (acoustic pressure, 0.266 MPa). These procedures were performed under an operating microscope (F-170, Carl Zeiss). At the end of the first course of US exposure, the solution mixture in the middle ear cavity was removed and replaced with a fresh mixture of gentamicin and MBs for the second course of US exposure. Following a third course of USMB treatment, the gentamicin/MBs mixture was retained in the middle ear cavity for 2 or 14 days, according to the experimental design. For control groups, the middle ear cavity was filled as above with 200 μL of a mixture of either gentamicin and MBs (for RWS group) or gentamicin and normal saline (for the GM group), and the mixture was allowed to soak the RWM for the same total duration as was used for the USM treatment. For experimental groups in the transcranial arm, the US exposure duration was extended to 3 minutes for each USMB course and a total of 3 courses was administered, as in the transcanal arm. The in vivo efficiency of USMB treatment of the RWM via the transcanal and transcranial arms was tested by replacing the mixture of gentamicin/MBs with biotin-FITC (40 μg/mL) and MBs (1.40 × 10⁷ MBs/mL), and the biotin-FITC/MBs mixture in the middle ear cavity was removed with a needle syringe at the end of the third course of USMB treatment. Figure 12 The ex vivo and in vivo experimental settings in the guinea pigs. (A) Photographs of the tympanic membrane taken from guinea pigs and covered on the top of a chamber (enlarged view) in the tissue-mimicking agarose phantoms. (B) Intraoperative photograph of transcanal US sonication implemented by placing the US probe in the external auditory canal, sonicating through the tympanic membrane, and causing USMB cavitation in the middle ear cavity of the guinea pigs. The tympanic membrane can be macroscopically visualized (enlarged view) with the aid of a speculum. After euthanizing guinea pigs with CO2 gas, the inner ear perilymph was immediately collected. The tympanic bulla was removed and a 10-μL microtip on a pipette was gently inserted through a cochleostomy inferior to the RWM for perilymph aspiration. The collected samples were then centrifuged immediately, stored at −80°C, and later processed for fluorescence analysis. ABR recording. The auditory function of the guinea pigs was assessed by recording ABRs as described previously (48). The animals were anesthetized and kept warm with a heating pad in a sound-attenuating chamber for the duration of the recording. Subdermal needle electrodes were inserted at the vertex (positive), below the pinna of the ear (negative), and at the back (ground) of the guinea pigs. Specific stimuli (clicks and 8-, 12-, 16-, 20-, 24-, and 32-kHz tone bursts) were produced by using SigGen software (Tucker-Davis Technologies) and delivered monaurally to the external auditory canal via an insert earphone. The average responses from 1024 stimuli at intensities ranging from 5–90 dB sound pressure level (SPL) for each frequency were collected by decreasing the sound intensity in 5-dB steps. The resulting ABR threshold was defined as the lowest intensity at which a reproducible deflection in the evoked response trace could be recognized. Cochlear surface preparation and immunofluorescence analysis of gentamicin uptake. Guinea pigs were euthanized, and their temporal bones were quickly removed. The cochleae were fixed by the intrascalar perfusion of 4% paraformaldehyde in PBS for 1 hour at room temperature. The tissues were rinsed with PBS, and the bone surrounding the organ of Corti was removed. The organ of Corti was then carefully dissected and immersed in the same fixative overnight. The tissues were then incubated with anti–myosin 7a polyclonal antibodies (1:100; NB120-3481, Novus Biologicals) for 2 hours. After 3 washes with PBS, the tissues were incubated with Alexa Fluor 555–conjugated goat anti-rabbit antibodies (1:500; A21428, Thermo Fisher Scientific) for 1 hour. Samples were incubated with Alexa Fluor 488–conjugated phalloidin (A12379, Thermo Fisher Scientific) for 30 minutes at room temperature, rinsed with PBS, mounted in DAPI Fluoromount-G mounting medium (SouthernBiotech), and covered with a coverslip for the analysis. The flat-surface preparation of the organ of Corti was examined over its entire length. For gentamicin immunofluorescence, the fixed cochlear tissues were incubated with PBS containing 0.3% Triton X-100 (Merck) for 30 minutes and then blocked with BlockPRO blocking buffer (Visual Protein Biotechnology) for 60 minutes at room temperature. The tissues were then incubated with anti-gentamicin monoclonal antibodies (1:100; 16101, QED Biosciences) and anti–myosin 7a polyclonal antibodies (1:100; NB120-3481, Novus Biologicals) for 2 hours. After 3 washes with PBS, the tissues were incubated with Alexa Fluor 488–conjugated donkey anti-mouse antibodies (1:200; A21202, Thermo Fisher Scientific) and Alexa Fluor 555–conjugated goat anti-rabbit antibodies (1:500; A21428, Thermo Fisher Scientific) for 1 hour. Then, samples were incubated with Alexa Fluor 633–conjugated phalloidin (1:100; A22284, Thermo Fisher Scientific) for 30 minutes at room temperature, rinsed with PBS, mounted in DAPI Fluoromount-G mounting medium, and covered with a coverslip. The fluorescence images were obtained using a confocal laser scanning microscope (Zeiss LSM 880, Carl Zeiss). Statistics. The obtained data were analyzed statistically using 2-tailed Student’s t test. Different groups were compared using 1-way ANOVA, followed by Tukey’s multiple-comparisons test. P < 0.05 was considered indicative of a significant difference. Study approval. This animal study was approved by the IACUC of the National Defense Medical Center, Taipei, Taiwan. The pigmented male guinea pigs (weighing 250–350 g) were used for experiments and cared for in accordance with protocols approved institutionally. Author contributions PYW, YCL, and HW performed the experiments. AHL and CPS wrote the manuscript with support from CHW. AHL, CPS, HKC, and CHW participated in planning and performing the experiments. AHL, CPS, PYW, and YCL participated in data analysis and interpretation. CPS, AHL, CHW, HLL, and HCC made substantial contributions to the conception and design of the research, data collection, and the editing of the manuscript. All of the authors have reviewed the manuscript and approved its final version. Acknowledgments This work was supported, in part, by grants from the Ministry of Science and Technology, Taiwan (MOST106-2221-E-011-043-MY3 to AHL, MOST107-2314-B-663-001-MY3 to CHW, and MOST107-2314-B-016-027 and MOST108-2314-B-016-038 to CPS); the Tri-Service General Hospital (TSGH-C107-009 to CHW, and TSGH-C108-011 and TSGH-A-109001 to CPS); the Taichung Armed Forces General Hospital (108A14 to CHW); the National Taiwan University of Science and Technology-Tri-Service General Hospital Joint Research Program (NTUST-TSGH-108-01 to AHL); the Medical Affairs Bureau Ministry of National Defense (MAB-108-005 to CHW and MAB-109-002 to CPS); and the Teh-Tzer Study Group for Human Medical Research Foundation (A1041001-2 to CHW). Footnotes Conflict of interest: The authors have declared that no conflict of interest exists. Copyright: © 2020, American Society for Clinical Investigation. Reference information: JCI Insight. 2020;5(3):e132880.https://doi.org/10.1172/jci.insight.132880. References Salt AN, Plontke SK. Pharmacokinetic principles in the inner ear: Influence of drug properties on intratympanic applications. Hear Res. 2018;368:28–40. View this article via: PubMed CrossRef Google Scholar King EB, Salt AN, Eastwood HT, O’Leary SJ. Direct entry of gadolinium into the vestibule following intratympanic applications in Guinea pigs and the influence of cochlear implantation. J Assoc Res Otolaryngol. 2011;12(6):741–751. View this article via: PubMed CrossRef Google Scholar Salt AN, King EB, Hartsock JJ, Gill RM, O’Leary SJ. Marker entry into vestibular perilymph via the stapes following applications to the round window niche of guinea pigs. Hear Res. 2012;283(1-2):14–23. View this article via: PubMed CrossRef Google Scholar Zhang L, Xu Y, Cao W, Xie S, Wen L, Chen G. Understanding the translocation mechanism of PLGA nanoparticles across round window membrane into the inner ear: a guideline for inner ear drug delivery based on nanomedicine. Int J Nanomedicine. 2018;13:479–492. View this article via: PubMed CrossRef Google Scholar Yang KJ, et al. Optimized phospholipid-based nanoparticles for inner ear drug delivery and therapy. Biomaterials. 2018;171:133–143. View this article via: PubMed CrossRef Google Scholar Wang H, et al. Efficient cochlear gene transfection in guinea-pigs with adeno-associated viral vectors by partial digestion of round window membrane. Gene Ther. 2012;19(3):255–263. View this article via: PubMed CrossRef Google Scholar Sun H, Huang A, Cao S. Current status and prospects of gene therapy for the inner ear. Hum Gene Ther. 2011;22(11):1311–1322. View this article via: PubMed CrossRef Google Scholar Creber NJ, Eastwood HT, Hampson AJ, Tan J, O’Leary SJ. Adjuvant agents enhance round window membrane permeability to dexamethasone and modulate basal to apical cochlear gradients. Eur J Pharm Sci. 2019;126:69–81. View this article via: PubMed CrossRef Google Scholar Juhn SK, et al. The role of inflammatory mediators in the pathogenesis of otitis media and sequelae. Clin Exp Otorhinolaryngol. 2008;1(3):117–138. View this article via: PubMed CrossRef Google Scholar Kelso CM, et al. Microperforations significantly enhance diffusion across round window membrane. Otol Neurotol. 2015;36(4):694–700. View this article via: PubMed CrossRef Google Scholar Stevens JP, Watanabe H, Kysar JW, Lalwani AK. Serrated needle design facilitates precise round window membrane perforation. J Biomed Mater Res A. 2016;104(7):1633–1637. View this article via: PubMed CrossRef Google Scholar Sennoga CA, et al. Microbubble-mediated ultrasound drug-delivery and therapeutic monitoring. Expert Opin Drug Deliv. 2017;14(9):1031–1043. View this article via: PubMed CrossRef Google Scholar Mainprize T, et al. Blood-Brain Barrier Opening in Primary Brain Tumors with Non-invasive MR-Guided Focused Ultrasound: A Clinical Safety and Feasibility Study. Sci Rep. 2019;9(1):321. View this article via: PubMed CrossRef Google Scholar O’Reilly MA, Hynynen K. Blood-brain barrier: real-time feedback-controlled focused ultrasound disruption by using an acoustic emissions-based controller. Radiology. 2012;263(1):96–106. View this article via: PubMed CrossRef Google Scholar Sun T, et al. Closed-loop control of targeted ultrasound drug delivery across the blood-brain/tumor barriers in a rat glioma model. Proc Natl Acad Sci USA. 2017;114(48):E10281–E10290. View this article via: PubMed CrossRef Google Scholar Song KH, Harvey BK, Borden MA. State-of-the-art of microbubble-assisted blood-brain barrier disruption. Theranostics. 2018;8(16):4393–4408. View this article via: PubMed CrossRef Google Scholar Shih CP, et al. Ultrasound-aided microbubbles facilitate the delivery of drugs to the inner ear via the round window membrane. J Control Release. 2013;167(2):167–174. View this article via: PubMed CrossRef Google Scholar Shih CP, et al. Middle-ear dexamethasone delivery via ultrasound microbubbles attenuates noise-induced hearing loss. Laryngoscope. 2019;129(8):1907–1914. View this article via: PubMed CrossRef Google Scholar Isaacson B, Nogueira JF. Endoscopic Management of Middle Ear and Temporal Bone Lesions. Otolaryngol Clin North Am. 2016;49(5):1205–1214. View this article via: PubMed CrossRef Google Scholar Suarato G, Spanò R, Bertorelli R, Diaspro A, Athanassiou A, Surdo S. 3D-printed, pocket-size diffusion cells for skin permeation investigation. Proceedings. 2018;2(13):945. View this article via: CrossRef Google Scholar Al-Awadi A, Olusi SO, Al-Zaid N, Prabha K. Serum B2-microglobulin concentration correlates with urinary concentrations of type 1 collagen cross-linked N-telopeptides and deoxypyridinoline in rheumatoid arthritis. Ann Saudi Med. 1998;18(2):113–116. View this article via: PubMed CrossRef Google Scholar Lee KH, Ryu SH, Lee HM, Park SK, Kim HJ, Chang J. Is Intratympanic Dexamathasone Injection Effective for the Treatment of Idiopathic Sudden Sensorineural Hearing Loss? J Audiol Otol. 2015;19(3):154–158. View this article via: PubMed CrossRef Google Scholar Ter Haar G. Ultrasonic imaging: safety considerations. Interface Focus. 2011;1(4):686–697. View this article via: PubMed CrossRef Google Scholar Salamanca CH, Barrera-Ocampo A, Lasso JC, Camacho N, Yarce CJ. Franz Diffusion Cell Approach for Pre-Formulation Characterisation of Ketoprofen Semi-Solid Dosage Forms. Pharmaceutics. 2018;10(3):E148. View this article via: PubMed Google Scholar In vitro release testing and in vivo bioequivalence documentation. 1997. FDA-SUPAC-SS. Guidance for industry. SUPAC-SS non-sterile semisolid dosage forms. Scale-up and postapproval changes: chemistry, manufacturing and controls. https://www.fda.gov/media/71141/download. Ng SF, Rouse J, Sanderson D, Eccleston G. A Comparative Study of Transmembrane Diffusion and Permeation of Ibuprofen across Synthetic Membranes Using Franz Diffusion Cells. Pharmaceutics. 2010;2(2):209–223. View this article via: PubMed CrossRef Google Scholar Ng SF, Rouse JJ, Sanderson FD, Meidan V, Eccleston GM. Validation of a static Franz diffusion cell system for in vitro permeation studies. AAPS PharmSciTech. 2010;11(3):1432–1441. View this article via: PubMed CrossRef Google Scholar Wazen JM, Stevens JP, Watanabe H, Kysar JW, Lalwani AK. Silver/silver chloride microneedles can detect penetration through the round window membrane. J Biomed Mater Res Part B Appl Biomater. 2017;105(2):307–311. View this article via: PubMed CrossRef Google Scholar Feng L, Ward JA, Li SK, Tolia G, Hao J, Choo DI. Assessment of PLGA-PEG-PLGA copolymer hydrogel for sustained drug delivery in the ear. Curr Drug Deliv. 2014;11(2):279–286. View this article via: PubMed CrossRef Google Scholar Park SH, Moon IS. Round window membrane vibration may increase the effect of intratympanic dexamethasone injection. Laryngoscope. 2014;124(6):1444–1451. View this article via: PubMed CrossRef Google Scholar Liu H, Feng L, Tolia G, Liddell MR, Hao J, Li SK. Evaluation of intratympanic formulations for inner ear delivery: methodology and sustained release formulation testing. Drug Dev Ind Pharm. 2014;40(7):896–903. View this article via: PubMed CrossRef Google Scholar Wysocki J. Topographical anatomy of the guinea pig temporal bone. Hear Res. 2005;199(1-2):103–110. View this article via: PubMed CrossRef Google Scholar Guignard J, Arnold A, Weisstanner C, Caversaccio M, Stieger C. A Bone-Thickness Map as a Guide for Bone-Anchored Port Implantation Surgery in the Temporal Bone. Materials (Basel). 2013;6(11):5291–5301. View this article via: PubMed CrossRef Google Scholar Song SW, Jun BC, Kim H, Cho Y. Evaluation of temporal bone pneumatization with growth using 3D reconstructed image of computed tomography. Auris Nasus Larynx. 2017;44(5):522–527. View this article via: PubMed CrossRef Google Scholar Furukawa T, Watanabe T, Ito T, Kubota T, Kakehata S. Feasibility and advantages of transcanal endoscopic myringoplasty. Otol Neurotol. 2014;35(4):e140–e145. View this article via: PubMed CrossRef Google Scholar Light JP, Silverstein H. Transtympanic perfusion: indications and limitations. Curr Opin Otolaryngol Head Neck Surg. 2004;12(5):378–383. View this article via: PubMed CrossRef Google Scholar Topf MC, et al. Rate of tympanic membrane perforation after intratympanic steroid injection. Am J Otolaryngol. 2017;38(1):21–25. View this article via: PubMed CrossRef Google Scholar Mäder K, Lehner E, Liebau A, Plontke SK. Controlled drug release to the inner ear: Concepts, materials, mechanisms, and performance. Hear Res. 2018;368:49–66. View this article via: PubMed CrossRef Google Scholar Liao AH, Lu YJ, Lin YC, Chen HK, Sytwu HK, Wang CH. Effectiveness of a Layer-by-Layer Microbubbles-Based Delivery System for Applying Minoxidil to Enhance Hair Growth. Theranostics. 2016;6(6):817–827. View this article via: PubMed CrossRef Google Scholar Liao AH, et al. Combining Microbubble Contrast Agent with Pulsed-Laser Irradiation for Transdermal Drug Delivery. Pharmaceutics. 2018;10(4):E175. View this article via: PubMed Google Scholar Chen HK, et al. Insonation of Systemically Delivered Cisplatin-Loaded Microbubbles Significantly Attenuates Nephrotoxicity of Chemotherapy in Experimental Models of Head and Neck Cancer. Cancers (Basel). 2018;10(9):E311. View this article via: PubMed Google Scholar Oberli MA, Schoellhammer CM, Langer R, Blankschtein D. Ultrasound-enhanced transdermal delivery: recent advances and future challenges. Ther Deliv. 2014;5(7):843–857. View this article via: PubMed CrossRef Google Scholar Prausnitz MR, Langer R. Transdermal drug delivery. Nat Biotechnol. 2008;26(11):1261–1268. View this article via: PubMed CrossRef Google Scholar Liao AH,
|
|
|
Scooped by
Gilbert C FAURE
May 23, 5:24 AM
|
The activation of pattern recognition receptors (PRRs) orchestrates inflammation and regulates adaptive immunity. To test whether tuning inflammation through PRR stimulation enhanced the efficacy of mRNA vaccines, we combined an mRNA-based vaccine generated against the ancestral spike protein of SARS-CoV-2 with mannadjuvant, a formulation of fungal mannan and aluminum hydroxide targeting the PRR dectin-2. In mice and non-human primates, mannadjuvant increased the magnitude and durability of the response elicited by the mRNA-based vaccine, and it also led to the induction of neutralizing antibodies directed against variants of concern with a high escape capacity, overcoming antigenic imprinting. Mechanistically, prolonged type I interferon (IFN) production and potentiated interleukin-1 (IL-1) signaling locally within the draining lymph node in mice or in human cells were necessary and sufficient to exert the effect of mannadjuvant. Our data indicate that antifungal PRRs can be harnessed to create more potent and durable mRNA-based vaccines. Jena, Qu et al. show that mannadjuvant, a formulation of fungal mannan and aluminum hydroxide, increases the magnitude, durability and breadth of the response elicited by mRNA-based vaccines against SARS-CoV-2 variants in mice and non-human primates.
|
|
Scooped by
Gilbert C FAURE
January 2, 4:38 AM
|
Over the past century, #vaccines have transformed #publichealth, most recently playing a critical role in combating the #COVID19 #pandemic. While prophylactic #cancer vaccines have successfully prevented malignancies caused by infectious agents, we are now seeing real clinical promise from therapeutic #cancervaccines designed to train the #immunesystem to eliminate established tumors.
Emerging data show encouraging outcomes:
▪️ Adjuvant setting: vaccines in #melanoma and #pancreaticcancer may reduce minimal residual disease and relapse
▪️Macrometastatic setting: in-situ vaccines have induced systemic tumor regressions in advanced #lungcancer, #breastcancer, and #lymphoma
▪️Advances are being driven by deeper understanding of tumor #immunology, incorporation of smarter vaccine components, integration of omics and #AI in vaccine design, and synergy with #immune #checkpointinhibitors
This work highlights the potential of next-generation cancer vaccines to improve outcomes and quality of life for patients worldwide. A fascinating and hopeful step forward for #cancerimmunotherapy.
Authors: Orrin Pail, MD • Matthew Lin, PhD • Theodora Anagnostou, MD • Brian Brown, PhD • Joshua Brody, MD.
Institutions: The Tisch Cancer Institute, Icahn School of Medicine at Mount Sinai, New York, NY, USA, Precision Immunology Institute, Icahn School of Medicine at Mount Sinai, New York, NY, USA, Icahn Genomics Institute, Icahn School of Medicine at Mount Sinai, New York, NY, USA, Perlmutter Cancer Center, NYU Langone Health, New York, NY, USA
🗃️ See comments section for reference.
|
|
Scooped by
Gilbert C FAURE
August 1, 2025 3:30 AM
|
📣 We have today announced the launch of the world’s first library of immune-boosting adjuvants that can be ‘taken off the shelf’ and used to enhance new vaccines being developed against epidemic and pandemic threats.
The $2.5 million project—funded and led by CEPI—will act as a matchmaking service, helping vaccine developers select the best vaccine-adjuvant combinations to make their vaccines more potent and effective. The UK’s Medicines and Healthcare products Regulatory Agency will host the repository of 25 adjuvants shared by leading research institutes and medical companies around the world.
Vaccine-enhancing adjuvants have played a powerful role in transforming our response to deadly diseases over the past century. The ingredients are added to the majority of vaccines to enhance the immune response, creating stronger and longer lasting protection against infections than the vaccine alone.
In the case of an outbreak of a new Disease X, the adjuvant library could help quickly identify the top-performing vaccine-adjuvant pairings to contain the spread of the virus before it reaches pandemic proportions.
🔗 Discover more in the link below.
|
|
Scooped by
Gilbert C FAURE
February 20, 2025 6:40 AM
|
A fundamental challenge for cancer vaccines is to generate long-lived functional T cells that are specific for tumour antigens. Here we find that mRNA–lipoplex vaccines against somatic mutation-derived neoantigens may solve this challenge in pancreatic ductal adenocarcinoma (PDAC), a lethal cancer with few mutations. At an extended 3.2-year median follow-up from a phase 1 trial of surgery, atezolizumab (PD-L1 inhibitory antibody), autogene cevumeran1 (individualized neoantigen vaccine with backbone-optimized uridine mRNA–lipoplex nanoparticles) and modified (m) FOLFIRINOX (chemotherapy) in patients with PDAC, we find that responders with vaccine-induced T cells (n = 8) have prolonged recurrence-free survival (RFS; median not reached) compared with non-responders without vaccine-induced T cells (n = 8; median RFS 13.4 months; P = 0.007). In responders, autogene cevumeran induces CD8+ T cell clones with an average estimated lifespan of 7.7 years (range 1.5 to roughly 100 years), with approximately 20% of clones having latent multi-decade lifespans that may outlive hosts. Eighty-six percent of clones per patient persist at substantial frequencies approximately 3 years post-vaccination, including clones with high avidity to PDAC neoepitopes. Using PhenoTrack, a novel computational strategy to trace single T cell phenotypes, we uncover that vaccine-induced clones are undetectable in pre-vaccination tissues, and assume a cytotoxic, tissue-resident memory-like T cell state up to three years post-vaccination with preserved neoantigen-specific effector function. Two responders recurred and evidenced fewer vaccine-induced T cells. Furthermore, recurrent PDACs were pruned of vaccine-targeted cancer clones. Thus, in PDAC, autogene cevumeran induces de novo CD8+ T cells with multiyear longevity, substantial magnitude and durable effector functions that may delay PDAC recurrence. Adjuvant mRNA–lipoplex neoantigen vaccines may thus solve a pivotal obstacle for cancer vaccination. In a phase 1 trial, patients with pancreatic ductal adenocarcinoma who were treated with surgery and bespoke neoantigen mRNA vaccines combined with anti-PD-L1 and chemotherapy exhibited marked long-lived persistence of neoantigen-specific CD8+ T cell clones, which correlated with prolonged recurrence-free survival at a 3.2-year follow-up.
|
|
Scooped by
Gilbert C FAURE
March 29, 2024 6:15 AM
|
Protection results from GSK Shingrix vaccines against #Shingles are impressive. Guess which adjuvant was used?
👉A #TLR4 agonist of course 🦠
The results…
|
|
Scooped by
Gilbert C FAURE
August 1, 2022 4:34 AM
|
GSK’s Derek O’Hagan shares his thoughts on the evolution of adjuvants, the importance of systems vaccinology, and the road ahead for RNA vaccines.Derek O’Hagan is Senior Advisor Vaccines R&D and GSK Fellow
at GSK. He is a qualified pharmacist and former academic researcher,
who has worked on vaccine delivery and adjuvants in the
pharmaceutical industry since 1993. In the mid 1990s, he worked
on the novel emulsion adjuvant MF59, which is now included in
a licensed flu vaccine in more than 40 countries. Prior to joining
GSK, he was Global Head of Vaccine Chemistry and Formulation
Research for Novartis Vaccines and was part of the team that established
the Novartis program on self-amplifying RNA vaccines, now
active in GSK. He has served on the Board of Scientific Advisors
for the Controlled Release Society and is a Fellow of the American
Association of Pharmaceutical Scientists.
|
|
Scooped by
Gilbert C FAURE
May 19, 2021 11:37 AM
|
Trial participants have 10 times more antibodies in their systems than patients recovering from COVID-19 Picture: Vials on a production line at a GSK factory that will be used in the collaboration with Canada’s Medicago. FRANCOIS LO PRESTI/AGENCE FRANCE-PRESSE/GETTY IMAGES Pharmaceutical giant GlaxoSmithKline GSK, -0.70% and Canadian vaccine maker Medicago have reported promising results from a Phase 2 clinical trial of their COVID-19 vaccine candidate. In a joint statement posted on Tuesday, the companies say the study shows trial participants have 10 times more antibodies in their systems than patients recovering from COVID-19. They reported that there were no severe adverse reactions among trial participants. It will be good news for GSK, which has been overshadowed by vaccine progress made by rivals, and it may relieve pressure on Chief Executive Emma Walmsley after Elliott Management, an activist investor, took a recent stake in the business. This COVID-19 collaboration involves Medicago providing the plant-derived vaccine candidate, which is tested in combination with GSK’s pandemic adjuvant, a substance intended to increases of otherwise affect an immune response to a vaccine. It is different because most proteins for vaccines are grown in the cells of insects, while Medicago’s protein is grown in plants. Dr. Thomas Breuer, chief medical officer of GSK’s vaccine division, said: “We are delighted to see that the results suggest a very strong immune response. Medicago’s COVID-19 vaccine candidate combined with GSK’s pandemic adjuvant was also well tolerated, reinforcing its potential benefits. We now look forward to the outcome of the ongoing Phase 3 trial of this refrigerator-stable vaccine candidate as the next step forward in our contribution to the global response to the pandemic.” Phase 3 of the trial started in March, involving volunteers in Canada, the U.S., the U.K. and Brazil, with additional sites expected to be added in the coming weeks. The vaccine candidate has received fast-track designation by the U.S. Food and Drug Administration, and Health Canada has initiated a review of Medicago’s COVID-19 rolling submission. Article Credit: marketwatch
|
|
Scooped by
Krishan Maggon
October 8, 2020 1:40 PM
|
KEY POINTS Pre-existing BCG immunity influences T cell responses of subunit booster vaccines. M. tuberculosis–specific subunit vaccines bypass this mechanism and improve protection. Abstract Despite the fact that the majority of people in tuberculosis (TB)–endemic areas are vaccinated with the Bacillus Calmette–Guérin (BCG) vaccine, TB remains the leading infectious cause of death. Data from both animal models and humans show that BCG and subunit vaccines induce T cells of different phenotypes, and little is known about how BCG priming influences subsequent booster vaccines. To test this, we designed a novel Mycobacterium tuberculosis–specific (or “non-BCG”) subunit vaccine with protective efficacy in both mice and guinea pigs and compared it to a known BCG boosting vaccine. In naive mice, this M. tuberculosis–specific vaccine induced similar protection compared with the BCG boosting vaccine. However, in BCG-primed animals, only the M. tuberculosis–specific vaccine added significantly to the BCG-induced protection. This correlated with the priming of T cells with a lower degree of differentiation and improved lung-homing capacity. These results have implications for TB vaccine design. This article is featured in Top Reads, p.1979 Introduction Mycobacterium tuberculosis infection is the leading cause of death because of a single infectious agent and has been in the top 10 causes of death worldwide for years (1).The only vaccine currently available against tuberculosis (TB) is M. bovis Bacillus Calmette–Guérin (BCG). When administered in early life, BCG efficiently prevents severe forms of childhood TB, but the efficacy against pulmonary disease in adulthood, the most common form of TB disease, is variable (2, 3). Thus, a new vaccine that prevents active pulmonary TB is needed to reduce M. tuberculosis transmission and TB-related mortality. CD4 T cells have been shown to be critical for host resistance to M. tuberculosis infections and are therefore the most common cell type targeted in preclinical and clinical TB vaccine development (4, 5). During M. tuberculosis infection, Ag expression and presentation have a major effect on differentiation and function of CD4 T cells. Recent mouse studies have shown that TB infection drives the differentiation of M. tuberculosis–specific CD4 T cells away from central memory T cells (e.g., secreting IL-2) toward effector/effector memory T cells that predominantly secrete IFN-γ (6). This results in a loss of self-renewing T cell subsets because of an impairment in the IL-2–producing capacity and a reduced capacity to traffic into the infected lung parenchyma (7, 8). Circulating T cells’ ability to populate the lung parenchyma has been established as a necessity for T cell–mediated protection in the lung (7, 9), possibly because a direct recognition of infected cells by CD4 T cells via the TCR is required (10). Thus, the ability to resist functional differentiation and home into inflamed lung tissues are key features for long-term protective CD4 T cells (7, 9). Similar to M. tuberculosis infection, the live mycobacterial BCG vaccine has been shown to promote differentiation and functional exhaustion of CD4 T cells in parenteral BCG-vaccinated mice, resulting in a failure to efficiently maintain long-term protection against M. tuberculosis (11–13). A recent study comparing different TB vaccines in clinical testing suggests that BCG may also induce more differentiated T cells than subunit vaccines in people (14). In line with this, we have recently shown that vaccination with an adjuvanted protein subunit vaccine (H56/CAF01) elicits less differentiated CD4 T cells with the capacity to localize to the infected parenchyma (15). In naive animals, such T cells are readily induced, but it has proven difficult to substantially reprogram the immune response after M. tuberculosis exposure by subunit vaccination (16–20). Given the similarities between the immune response arising from BCG vaccination and M. tuberculosis infection, we hypothesize that pre-existing “BCG-imprinted” T cells dictate the phenotype of the immune response induced by subsequent subunit booster vaccines. To investigate this, we designed two novel vaccines, H64 and H74, that selectively incorporated M. tuberculosis–specific (or “non-BCG”) Ags and compared the protective efficacy and T cell phenotype to a known booster vaccine sharing all of its Ags with BCG (H65) (21). Thus, H65 was tested as a classical BCG booster vaccine, whereas the H64 and H74 subunit vaccines supplement BCG’s Ag repertoire with M. tuberculosis–specific Ags. For comparability, the three vaccines consisted of six Ags that were either secreted by or associated with the type VII secretion system (also called the ESX secretion systems). H64 and H74 consisted of ESX-1–associated Ags (M. tuberculosis specific), whereas H65 consisted of Ags associated to ESX-2, 3, and 5 (also present in BCG). We first confirmed that the ESX-1 Ags were protective in mice and guinea pigs and that the level of protection was similar to the BCG boosting vaccine H65. We then moved on to show that in BCG-primed mice, the CD4 T cells induced by the H65 booster vaccine were more differentiated than the CD4 T cells induced by the ESX-1–based vaccine. Importantly, the T cells specific for the ESX-1 vaccine maintained their polyfunctionality and low differentiation status during chronic M. tuberculosis infection and were superior in entering the M. tuberculosis–infected lung parenchyma. As a result, the lung bacterial burden was significantly decreased in the BCG plus ESX-1 vaccination group compared with the groups with either BCG alone or BCG boosted with the H65 vaccine. These data add to the body of evidence supporting the use of ESX-1–associated (or other M. tuberculosis–specific/non-BCG) Ags in future TB vaccines (16, 22–25) and address the potential influence of BCG priming on subsequent booster vaccines. Materials and Methods Animals Six- to ten-week-old female mice or 400–500 g outbred female Hartley guinea pigs (Charles River Laboratories) were rested for 1 wk prior to initiation of any experimental procedures. Except for the M. tuberculosis Beijing HN878 challenge study, all mouse experiments were performed with female CB6F1 mice (Envigo) at Statens Serum Institut according to the Danish Ministry of Justice and Animal Protection Committees under permit 2014-15-2934-01065 and in compliance with European Union Directive 2010/63/EU. Mice were provided with radiation-sterilized food (Harlan Scandinavia) and water ad libitum and handled in accordance with the Danish Ministry of Justice and Animal Protection Committee regulations by authorized personnel. Infected mice were housed in a biosafety level 3 facility in cages contained within laminar flow safety enclosures (Scantainer, Scanbur). In the challenge study with the hypervirulent M. tuberculosis Beijing HN878, female C57BL/6 mice were purchased from SLC (Shizuoka, Japan). All animal experiments were performed according to the Korean Food and Drug Administration regulations and guidelines. The experimental protocols were reviewed and approved by the Ethics Committee and Institutional Animal Care and Use Committee (Permit Number: 2017-0264). All in vivo experiments were carried out under barrier conditions in an animal biological safety level 3 facility at the Avison Biomedical Research Center at Yonsei College of Medicine. Guinea pigs were maintained under animal biosafety level 3 barrier conditions in isolator cages (Thoren Caging Systems, Hazleton, PA) at Colorado State University. All experimental procedures were conducted in accordance with the Public Health Service Policy on the Humane Care and Use of Laboratory Animals and approved by the Colorado State University Institutional Animal Care and Use Committee (approval no. 13-4565A). Recombinant proteins All DNA constructs used in this study were made by chemical synthesis and codon optimized for expression in Escherichia coli before insertion into the pJ 411 expression vector (ATUM, Menlo Park, CA). Hybrid H64 and H74 were protein fusions without linkers between the six open reading frames. To minimize protein aggregation, all codons encoding cysteine were replaced with serine codons, five in H74 and three in H64. In both fusions, we added a His tag at the N-terminal end (MHHHHHH-). After transformation into E. coli BL21 (DE3) (Agilent Technologies), protein expression was induced with 1 mM isopropyl β-d-1-thiogalactopyranoside in 3-l cultures, and the proteins were purified from inclusion bodies by a three-step process as previously described (26). Hybrid H56 and H65 were designed as earlier described (21, 27) and expressed and purified in the same way as H74 and H64. The products were pure full-length products (>99% purity) with a protein concentration between 0.3 and 0.7 mg/ml and a total yield between 4 and 15 mg for the protein batches produced for this work. The identity of all purified protein batches was confirmed by mass spectrometry analysis (matrix-assisted laser desorption/ionization–time-of-flight). Immunizations and infections Mice were immunized s.c. three times at 2-wk intervals at the base of the tail with the fusion protein formulated in a cationic liposome adjuvant. Cationic liposomes (CAF01, 250 μg dimethyldioctadecyl-ammonium/50 μg trehalose 6,6-dibehenate) were emulsified with 1–10 μg fusion protein in 10 mM sterile Tris buffer (pH 7.4) to a final volume of 200 μl for each injection. Negative control mice received three equivalent doses of saline, and positive control mice received a single dose of 1 × 10⁵ CFU M. bovis BCG Danish 1331 (Statens Serum Institut, Copenhagen, Denmark) given s.c. in the first round of immunization. In M. bovis BCG boost experiments, mice received one s.c. injection of 1 × 10⁵ CFU M. bovis BCG Danish 1331 and were rested 8–26 wk, depending on the experiment, before vaccination three times with fusion protein as described above. Six weeks after the third immunization, mice were challenged with 50–100 M. tuberculosis strain Erdman (American Type Culture Collection), H37Rv (American Type Culture Collection 27294), Kazakhstan (mycobacterial interspersed repetitive units [MIRU] 1270-52), Vietnam (MIRU 1393-252), Beijing (MIRU 94-32), or Beijing HN878 suspended in PBS Tween 20 (0.05%). For M. tuberculosis strain Erdman, H37Rv, Beijing, Vietnam, and Kazakhstan, performed at Statens Serum Institut, we used a Biaera exposure system controlled by the AeroMP aerosol management, and for the hypervirulent M. tuberculosis strain Beijing HN878 experiment, performed at Yonsei College of Medicine, mice were infected with 60–70 virulent mycobacteria per mouse via the respiratory route using the inhalation chamber (Glas-Col, Terre Haute, IN). Guinea pigs (10/group), housed at Colorado State University, were immunized via the i.m. route and rested for 10 wk. A saline-treated and an intradermal M. bovis BCG–vaccinated group (inoculated with 103 CFU via the intradermal route) were included as a negative and positive control, respectively. Ten weeks postvaccination, guinea pigs were infected with a low-dose aerosol delivering ∼10 viable mycobacteria of virulent M. tuberculosis strain H37Rv into the lung of each animal. The animals were euthanized when they reached the set criteria established by the Institutional Animal Care and Use Committee, such as being moribund or exceeding acceptable weight loss and/or being affected in their respiratory rate (labored/heavy breathing). The body temperature was measured to track the clinical progression of the disease. For this, guinea pigs received a s.c. microchip implant (IPT-300 Bio Medic Data Systems, Seaford, DE) that allowed for the measurement of temperature and also carried information about experiment number and animal number. The body temperatures of individual guinea pigs were assessed each day at approximately the same time in the afternoon using a DAS-6006/7 scanner transponder (Bio Medic Data Systems). Isolation of cells and CFU measurements Spleen and lymph nodes from individual animals were kept at 4°C until processed through 70-μm nylon cell strainers (BD Pharmingen) followed by two washes and resuspension of the mononuclear cells in RPMI 1640 containing 5% FBS. Isolated lungs were transferred into Miltenyi C tubes containing HEPES/RPMI 1640 supplemented with collagenase (Roche/Sigma). The lungs were subsequently homogenized and digested for 30–45 min at 37°C and passed through cell strainers (BD Biosciences). After washing, the cells were resuspended in RPMI 1640 containing 5% FBS and stored at 4°C until use. For CFU measurements, lung homogenates were prepared in PBS Tween 80 (0.05%) from individual mice and plated at 3-fold serial dilutions on Middlebrook 7H11 Bacto Agar. After 3 wk of incubation at 37°C, the CFU were enumerated. Flow cytometry Single-cell suspensions of splenocytes or lung mononuclear cells (2 × 10⁶ cells/well) were stimulated in vitro in V-bottom 96-well plates at 37°C in 200 μl complete media containing anti-CD49d (1 μg/ml) and anti-CD28 (1 μg/ml) Abs in the presence of rAg (2 μg/ml) for 1 h. Subsequently, 10 μg/ml brefeldin A (Sigma-Aldrich) was added, and the incubation continued for another 5–6 h. Following overnight storage at 4°C, cells were washed in FACS buffer (PBS containing 0.1% sodium azide and 1% FBS) and stained 30 min at 4°C for surface markers with mAbs as indicated. We used 1:400 dilutions of anti-CD4–Brilliant Violet 510 (clone RM 4.5; BioLegend), anti-CD4–Brilliant Violet 786 (clone GK1.5; BioLegend), 1:100 dilutions of anti-CD4–PerCP (clone GK1.5; BioLegend), or 1:200 dilutions of anti-CD4–FITC (clone RM4.4; BD Biosciences) and 1:600 dilutions of anti-CD44–FITC (clone IM7; eBioscience) and anti-CD8–PerCP-Cy5.5 (clone 53-6.7; eBioscience). Cells were then washed in FACS buffer, permeabilized using the Cytofix/Cytoperm kit (BD Biosciences) according to the manufacturer’s instructions, and stained intracellularly for 30 min at 4°C in dilutions of 1:200 using anti–IFN-γ–PE-Cy7 or anti–IFN-γ–PerCP-Cy5.5 (clone XMG1.2; eBioscience), anti–TNF-α–PE or anti–TNF-α–PeCy7 (clone MP6-XT22; eBioscience), anti–IL-17–allophycocyanin (clone eBio17B7; eBioscience), or dilutions of 1:100 using anti–IL-2–allophycocyanin-Cy7 (clone JES6-5H4; BD Biosciences) mAbs. Cells were subsequently washed with BD Perm/Wash Buffer (BD Biosciences) and resuspended in FACS buffer. Data were collected by running the stained cells on a FACSCanto, FACSCalibur, or FACSFortesa flow cytometer (BD Biosciences) and analyzed using FlowJo software v.10.0.7. In vivo intravascular labeling of T cells At the day of the experiment, mice were injected i.v. with 2 μg of FITC-labeled Abs against CD45.2 in a total volume of 200 μl (clone 102; BioLegend, San Diego, CA). Three minutes after Ab injection, mice were euthanized, and single-cell suspensions were prepared as described above. Adoptive transfer and lung homing For coadoptive transfer studies, donor CD4 T cells from subunit-vaccinated and M. bovis BCG plus subunit–vaccinated animals were isolated by negative selection 3 wk after the last immunization. In brief, cells were isolated from spleen, medial iliac, inguinal, and axillary lymph nodes from eight individual vaccinated donor animals, pooled within the groups and enumerated. Untouched CD4 T cell enrichment was performed from 5 × 10⁸ cells per group using the EasySep Mouse CD4 T cell Enrichment Kit following the manufacturer’s instructions (STEMCELL Technologies). After enrichment, cells were counted, and the density was adjusted to 2.5 × 10⁷ cells per ml for each group (93–95% purity). For tracking, the purified cells were differentially stained for 10 min with 10 μM Cell Proliferation Dye eFluor 450 or 5 μM Cell Proliferation Dye eFluor 670 (Thermo Fisher Scientific). The proliferation dyes were quenched with PBS containing 20% FBS followed by washing and resuspension in PBS. Stained cells were mixed in a ∼1:1 ratio and coadoptively transferred into recipient mice that were infected with M. tuberculosis strain Erdman 3 wk prior. Two hundred microliters (5 × 10⁶ CD4 T cells) was injected into the lateral tail vein of individual recipient mice (the equivalent of one donor mouse per recipient mouse). Eighteen hours after transfer, recipient mice were injected with FITC-labeled anti-CD45.2 Abs for intravascular labeling (clone 102; BD Biosciences) and single-cell suspensions from the lung prepared as described above. Statistical analysis Prism 7 software (GraphPad Prism ver. 8.2.1, San Diego, CA) was used for all statistical analyses. Mean and SEM are indicated for log-transformed CFU counts. Mean and SD are indicated for immune responses. One-way ANOVA combined with Tukey multiple comparison test was used for comparing multiple groups. Statistical significant differences are indicated by asterisks in the figures: *p < 0.05, **p < 0.01, ***p < 0.001, and ****p < 0.0001. In the guinea pig experiment, the nonparametric log-rank test was used to compare the survival distributions of two samples comparing the survival curves for the vaccinated groups against the saline group. Results ESX-1–associated Ags (M. tuberculosis–specific) provide protection in mice and guinea pigs To investigate the influence of BCG priming on subsequent subunit vaccination, we first designed protective subunit vaccines that selectively incorporated M. tuberculosis–specific Ags, which are not shared with BCG. The M. tuberculosis genome encodes ∼4000 proteins, of which many are potential vaccine targets. However, ∼3900 of these have highly similar orthologs in the BCG genome, which significantly limits the number of potential Ags for this type of vaccine (28, 29). In our selection, we exploited that all BCG substrains lack the genomic locus “region of difference 1” (23), which includes the core genes for the ESX-1 secretion system. In virulent M. tuberculosis strains, ESX-1–secreted proteins are among the most immunogenic Ags and are frequently recognized in TB patients and latently infected individuals (30, 31). However, in BCG, the region of difference 1 deletion is expected to prevent priming of T cells against ESX-1–associated Ags, and we therefore selected among this group of proteins for the first subunit vaccine, referred to as H64. We selected six ESX-1–associated Ags for which proteome studies had identified the proteins in M. tuberculosis culture filtrate or membrane fractions (Table I) and constructed the H64 subunit vaccine as a recombinant fusion protein (Fig. 1A). In H64-vaccinated CB6F1 mice, the CD4 T cells recognized the EsxA, EspD, and EspR Ags (Fig. 1B), and we found that the subunit vaccine induced protection with protein doses ranging from 0.01 to 25 μg per vaccination peaking in the range of 1–5 μg (Fig. 1C). Based on this, an intermediate dose of 2 μg was selected for future mouse studies. Because disease progression and granuloma formation in M. tuberculosis–infected guinea pigs better mimic features of human TB pathology, we also tested the H64 vaccine in Hartley guinea pigs in a long-term infection model. Guinea pigs were challenged with a low dose of virulent M. tuberculosis H37Rv after vaccination with different doses of H64. Animals that reached predefined human end points (weight loss or impact on respiratory rate) were euthanized. Twenty-two weeks after being infected, all animals in the saline control group had been euthanized with a mean survival time of 16.2 wk (SD = ±1.8) (Supplemental Fig. 1A). In comparison, the mean survival time of the M. bovis BCG-vaccinated guinea pigs was 65.1 wk (±8.9). In the four H64-vaccinated groups, the mean survival time ranged from 22.4 wk (±2.3) to 41.6 wk (±9.0) (Fig. 1C). Statistical comparison confirmed that all vaccination groups were better protected than saline-vaccinated animals (p < 0.02, log-rank test). After having confirmed that the ESX-1–associated Ag combination was protective in both mice and guinea pigs, we continued our study of the H64 vaccine by testing its protective efficacy against different challenge strains. Because M. tuberculosis strains harbor genetic diversity that translates into significant differences in Ag diversity, immunogenicity, and virulence, we selected four clinically relevant M. tuberculosis strains belonging to different lineages (2–4) to ensure that the protective signal of H64 was robust and broadly relevant (Fig. 1D, Supplemental Fig. 1B) (32). Similarly to the results with M. tuberculosis Erdman in Fig. 1C, H64 vaccination induced significant protection against all four strains (p < 0.05 or lower) and was equal to or better than the protection obtained with the H56 subunit vaccine that was included to benchmark the new vaccine. In the experiment with H37Rv, H64 was more protective than BCG, but with the other clinical strains, BCG induced similar or better protection than H64 (Fig. 1D). To test how the vaccine performed against a more “aggressive” strain, we challenged mice with M. tuberculosis HN878, which is regarded as hypervirulent because of its rapid growth and induction of severe lung inflammation in mice (33). In this model, both BCG and H64 protected efficiently at week 4 of the infection (p < 0.001), but by week 12, BCG had lost most of its protection, whereas bacterial numbers in H64-vaccinated animals remained significantly lower than BCG as well as the saline control (Fig. 1E, p < 0.005 and p < 0.0001, respectively). View inlineView popup Table I. M. tuberculosis Ags in the H64 fusion protein FIGURE 1. H64 (ESX-1–associated Ags) provide protection against M. tuberculosis in mice and guinea pigs. (A) Illustration of the subunit vaccine H64. The fusion protein is based on ESX-1–associated Ags and does not share Ags with M. bovis BCG. The figure is not drawn to scale. The m.w. of the individual Ags is given in Table I. (B) Ag recognition of splenocytes after immunizing CB6F1 mice with H64 (n = 3). Single-cell cytokine expression was measured by flow cytometry. Any CD4 cell that produced either IFN-γ, TNF-α, and/or IL-2 in response to Ag stimulation was taken as Ag specific. The spleen cells were stimulated with single Ags from H64. EsxH stimulation was included as a negative control (“Control”). Bars and lines illustrate the mean and SD for each Ag. (C) Black curve: protective efficacy studies in CB6F1 mice. Animals were immunized with different doses of H64 in CAF01 adjuvant. The bacterial load was measured in lungs from individual mice 6 wk after M. tuberculosis Erdman challenge (n = 8). The number of bacteria was logarithmic transformed and subtracted from the bacteria numbers in a nonvaccinated control group. Blue curve: protective efficacy studies in guinea pigs (performed at Colorado State University). Guinea pigs were immunized with different doses of H64 in CAF01 and euthanized when predefined humane end points were met after M. tuberculosis infection. Kaplan–Meier survival curves (Supplemental Fig. 1A) were used to estimate the mean survival time for guinea pigs in each of the vaccination groups (n = 10). SDs are shown for each data point. (D) CB6F1 mice immunized with H64, H56, or M. bovis BCG or injected with saline were infected for 6 wk with one of four clinical isolates of M. tuberculosis: H37Rv, Vietnam, Nepal, and Kazakhstan (n = 6–8 per group). MIRU typing in Supplemental Fig. 1B. CFU Log10/lung ± SEM. One-way ANOVA was used for statistical comparison with the saline group for each strain; degree of freedom = 24. (E) H64 or M. bovis BCG immunized or saline-injected C57BL/6 mice were infected 6 wk after immunization with the hypervirulent M. tuberculosis strain Beijing HN878 (performed at Yonsei College of Medicine). After 4- and 12-wk infection, the bacterial burden was measured in the lung (n = 5–8). Mean values and SEMs are illustrated. One-way ANOVA was used for statistical comparison between groups for each time point; degree of freedom = 18. *p < 0.05, **p < 0.01, ***p < 0.001, ****p < 0.0001. In parallel to working with H64, we designed an additional ESX-1 fusion protein in which EspF and PE35 (not immunogenic in H64) were replaced with the Ags EspB and EspA to potentially optimize immunogenicity and/or efficacy (Fig. 2A, Table II). In H74-vaccinated animals, there was a dominant CD4 T cell response to EspB and an increased recognition of EsxA and EspD (Fig. 2B). Similar to H64, H74 induced protective efficacy over a broad range of vaccination doses peaking between 1 and 5 μg (Supplemental Fig. 1C). Because both vaccines were designed to be used in BCG-primed animals, we did a direct head-to-head comparison in this setting. After challenge with M. tuberculosis Erdman, both vaccines induced robust protection on top of BCG at all the measured time points (Fig. 2C). However, at the late time point (20 wk postinfection), lung bacterial numbers were reduced by 1.7 log10 in the BCG control group (p < 0.0001), 1.88 log10 in the BCG-H64–vaccinated group, and 2.22 log10 in the BCG-H74–vaccinated group compared with the saline group. The bacterial burden was thus significantly lower in the H74-vaccinated animals (p < 0.01), and H74 was selected as the ESX-1 vaccine for further studies. FIGURE 2. Improved Ag recognition and protection of H74 compared with H64. (A) Illustration of the subunit vaccine H74. The fusion protein is based on ESX-1–associated Ags. Ags shared with H64 are in light green. The length in amino acids of the individual Ags is given in Table I. (B) Ag recognition of splenocytes isolated from H74-immunized CB6F1 mice (n = 4). The cells were stimulated with single Ags from H74, and EsxH stimulation was included as negative control (Control). CD4 T cells producing either IFN-γ, TNF-α, and/or IL-2 in response to Ag stimulation were taken as Ag specific. Means and SDs are shown for each Ag. (C) Six months after being M. bovis BCG–vaccinated, CB6F1 mice were divided into three groups and vaccinated with either H64 or H74 or saline injected. An age-matched control group was included that did not receive any of the vaccines. All animals were aerosol infected with M. tuberculosis Erdman, and the number of mycobacteria was measured in individual lungs from immunized and nonimmunized mice 6, 12, and 20 wk postinfection (n = 8 per time point). Vertical lines illustrate SEMs. One-way ANOVA was used for statistical comparison between groups at the late time point; degree of freedom = 28. **p < 0.01, ****p < 0.0001. View inlineView popup Table II. M. tuberculosis Ags in the H74 fusion protein In summary, we designed two novel vaccines based exclusively on ESX-1–associated Ags H64 and H74 which demonstrated robust protection in both mice and guinea pigs. H74 was selected for further studies in BCG-primed animals. In BCG-vaccinated mice, ESX-1–associated Ags induce less differentiated CD4 T cells and improve protection compared with BCG boosting It has been demonstrated that BCG vaccination induces highly differentiated T cells (34), but it has not been systematically investigated how this influences T cell quality and protection of subsequent subunit vaccine boosters. We approached this issue by first comparing the protective efficacy of the ESX-1–based H74 vaccine and a BCG booster vaccine (H65), described in a previous study (21). H65 consists of six EsxA family proteins related to ESX-2, -3, or -5 that are all present in BCG (Fig. 3A). Naive mice were immunized with either H65 or H74 as standalone vaccines. Six weeks after M. tuberculosis aerosol challenge, both vaccines reduced the bacterial load by more than 1.0 log10 relative to nonvaccinated animals (p < 0.0001) with no statistical difference between them (Fig. 3B). Having confirmed that the two vaccines induced similar levels of protection in naive mice, we continued by comparing their efficacy in mice that were BCG primed 6 mo prior to subunit vaccination. Twelve weeks after M. tuberculosis Erdman challenge, BCG vaccination reduced the lung bacterial number by 0.85 log10 (p < 0.05). In two separate experiments, H65 boosting did not add significantly to this protection (Fig. 3C, top, Supplemental Fig. 2A), whereas vaccination with the H74 vaccine enhanced the BCG-induced protection (p < 0.05), resulting in a 1.78 log10 reduction of the number of bacteria relative to the nonvaccinated group (p < 0.0001). This observation was robust as similar results were found in a second study with the clinical strain M. tuberculosis Kazakhstan (Fig. 3C, bottom), showing consistently that although the protection was equal in naive mice, the ESX-1 vaccine (M. tuberculosis–specific) induced better protection than the BCG boosting vaccine in BCG-primed animals. FIGURE 3. H74 vaccination (ESX-1–associated Ags) improve protection in BCG-primed animals and induce less differentiated CD4 T cells compared with BCG boosting (H65). (A) Illustration of the BCG booster vaccine H65. All six Ags are shared with M. bovis BCG (21). (B) Groups of naive CB6F1 mice were vaccinated with H74 or H65, and control groups received either a BCG vaccination or saline injections (n = 8). The bacterial numbers were enumerated in lungs 6 wk after an aerosol M. tuberculosis Erdman infection. Means and SEMs are shown by bars and lines. One-way ANOVA was used for statistical analysis; degree of freedom = 27. (C) CB6F1 mice were BCG vaccinated followed by a resting period of 6 mo before being vaccinated with either H74 or H65 (n = 7–8). The bacterial numbers were measured in individual animals 12 wk after they were infected with M. tuberculosis strain Erdman (top) or 25 wk after M. tuberculosis Kazakhstan infection (bottom). One-way ANOVA was used for statistical analysis; degree of freedom = 25 and 26. (D) Timeline for measuring T cell responses in vaccinated CB6F1 mice pre– and post–M. tuberculosis Erdman challenge in the BCG prime–boost model. (E) Splenocytes isolated from CB6F1 mice vaccinated with BCG alone or boosted with H65 were stimulated with the H65 fusion protein. In parallel, splenocytes from BCG-vaccinated animals complemented with H74 were stimulated with the H74 fusion protein. Single-cell expression of cytokine IFN-γ, TNF-α, and IL-2 was measured by flow cytometry, and the frequencies of activated (CD44high) CD4 T cells expressing any of the possible combinations of cytokines are shown in a bar plot for each vaccination group with mean and SD indicated (n = 3). Means (gray bars) and SDs (vertical lines) are shown. The pies are a simplified view of the data illustrating cytokine coexpression patterns of the specific CD4 T cells. The five identified subgroups of cytokine-producing CD4 T cells were as follows: light blue, TNF-α+; dark blue, TNF-α+ and IL-2+; green, TNF-α+, IL-2+, and IFN-γ+; orange, IFN-γ+ and TNF-α+; and red, IFN-γ+. The dotted arches illustrate the fraction of specific CD4 T cells that produced IFN-γ (red) or did not produce cytokine IFN-γ (blue) in response to ex vivo Ag stimulation. The FDS was calculated as the ratio of IFN-γ producers/IFN-γ nonproducers as previously described (6). (F) Cytokine expression profiles were measured in spleens before and in lungs after M. tuberculosis Erdman infection, and the associated FDS score was calculated for each time point and vaccination group (n = 3–4 per time point). Filled circles and vertical bars represents means and SDs. **p < 0.01, ***p < 0.001, ****p < 0.0001. Next, we compared the phenotype of the subunit-specific CD4 T cell response among the vaccinated groups before and after M. tuberculosis challenge (Fig. 3D). We used the individual CD4 T cell cytokine expression profile as a specific and sensitive measure to assess the degree of differentiation (35). For each group, we calculated a simple functional differentiation score (FDS) based on the ratio of IFN-γ producers and nonproducers as has previously been suggested (6). In BCG-vaccinated animals, we found the highest degree of T cell differentiation (FDS = 4.0) with the majority of responding CD4 T cells expressing IFN-γ either alone or in combination with TNF-α and/or IL-2 (Fig. 3E, top). In the H65-boosted group, there was almost a 3-fold increase in the percentage of H65-specific CD4 T cells compared with BCG alone, but H65 boosting induced only minor changes in the cytokine expression profile of the CD4 T cells (FDS = 2.8, Fig. 3E, middle). In contrast, H74 vaccination induced CD4 T cells with a lower degree of differentiation with almost half of the responding T cells expressing TNF-α alone or TNF-α and IL-2 in combination (FDS = 1.0, Fig. 3E, bottom). After M. tuberculosis Erdman infection, the CD4 T cells recruited to the lung maintained an FDS score of ∼ 4.0 in BCG-vaccinated mice during the initial phase of the infection. However, this increased to 10.7 after 6 wk and to 26.1 after 12 wk of infection, clearly showing a further differentiation of the T cell pool during TB infection (Fig. 3F, top). In the H65-boosted group, there was a delay in the differentiation of the CD4 T cells, but at the late time point, the FDS score had increased to 12.8 (Fig. 3F, middle). In contrast, the FDS score for the vaccine-specific CD4 T cells remained around ∼1.0 for all time points in the H74-vaccinated group (Fig. 3F, bottom). Thus, the pool of H74-specific CD4 T cells effectively resisted infection-driven differentiation throughout a 12-wk infection period. We further investigated this in a follow-up study, in which BCG-primed animals were immunized simultaneously with H74 and H65 so that each animal served as its own internal control. In these animals, the H65-specific CD4 T cells had a mean FDS of 3.0 compared with 0.84 for the H74-specific CD4 T cells, confirming that BCG boosting leads to higher T cell differentiation than vaccination with M. tuberculosis–specific Ags (Supplemental Fig. 2B). Finally, ESAT-6 has been shown to be essential for postexposure protection (16), and of relevance to the vaccination of M. tuberculosis–exposed individuals, H74 vaccination induced less differentiated T cells and lower bacterial burdens in the modified Cornell model of latent TB infection, supporting ESX-1–based vaccines for this application (27, 36) (Supplemental Fig. 2C). In summary, in BCG-primed mice, H65 vaccination did neither lead to substantial improvements in T cell differentiation nor did it add significantly to the protection induced by BCG. Conversely, vaccination with ESX-1–associated Ags (H74) induced CD4 T cells with a low differentiation score, which remained low during M. tuberculosis infection. This correlated with a significantly increased protective efficacy. In BCG-vaccinated mice, ESX-1–associated Ags induce CD4 T cells with superior lung-homing capacity Recent studies directly link T cell differentiation status to the ability to enter the infected lung parenchyma and restrict mycobacterial growth (7, 9, 15, 37). In H56/CAF01-vaccinated mice, we have previously shown that lung parenchymal CD4 T cells (protected from anti-CD45 i.v. stain) are less differentiated and express increased levels of the parenchymal homing marker, CXCR3 (15). For this study, to directly link FDS with lung parenchymal trafficking, we first confirmed that there was a strong correlation between FDS and i.v. CD45 labeling in vaccinated animals (Supplemental Fig. 3). Because our data this far showed that pre-existing BCG immunity had a major influence on the differentiation status of subunit-specific CD4 T cells, we next investigated the impact of BCG boosting on lung-homing capacity. For this, we performed an adoptive transfer experiment using donor cells from H74- and H65-vaccinated mice with or without BCG priming. Before cell transfer, we confirmed that all four groups had a solid vaccine-specific CD4 T cell response and used the cytokine expression profiles to determine the degree of CD4 T cell differentiation (Fig. 4A, 4B). Importantly, the T cell differentiation was similar after H74 and H65 vaccination when administered as standalone vaccines, confirming there was no inherent difference in the priming capability of these vaccines. However, in BCG-primed mice, H65 boosting led to a higher T cell differentiation than H74 vaccination, as previously observed (Fig. 4B). FIGURE 4. H74 (ESX-1–associated Ags) induces CD4 T cells with superior lung-homing capacity in BCG-vaccinated mice. (A) Eight weeks after being BCG vaccinated, CB6F1 mice were vaccinated with H65 or H74. Three weeks later, splenocytes were stimulated with H65 or H74 fusion protein, and the expression of cytokines IFN-γ, IL-2, and TNF-α was measured by flow cytometry. CD4 T cells that produced at least one of the cytokines in response to Ag stimulation was regarded as “Ag specific” (n = 4 per group). The mean (gray bar) and SD is shown for each group. (B) The FDS score was calculated as the ratio of IFN-γ+/IFN-γ− cells based on the cytokine expression profile for the individual animal and plotted for each of the four vaccination groups. Horizontal lines represent means, vertical lines, and SDs. One-way ANOVA was used for statistical comparison; degree of freedom = 12. (C) The influence of BCG priming on the lung-homing capacity of H65- and H74-induced CD4 T cells. CD4 T cells were purified from spleens and lymph nodes and pooled within the vaccination groups before labeling with tracker dyes to distinguish cells from donor animals with and without BCG priming. After labeling, cells were mixed 1:1 (e.g., naive plus H65:BCG plus H65) and adoptively transferred to M. tuberculosis Erdman–infected mice. The next day, intravascular localized cells in the recipient mice were labeled using FITC CD45.2, and purified lung cells were stimulated with fusion proteins to identify cytokine expressing (“Ag-specific”) CD4 T cells. For the entire gating strategy, see Supplemental Fig. 4. (D) For each of the four vaccination groups, the percentage of vaccine-specific donor cells entering into the lung parenchyma was calculated, and the influence of BCG priming on vaccine-specific homing was compared for the two subunit vaccines. The lines connect measurements from the same recipient mouse (n = 4). The statistical comparison was done by two-tailed t tests. *p < 0.05. To compare the ability of the vaccine-specific CD4 T cells to enter infected lung parenchyma, we transferred mixed populations of CD4 T cells into M. tuberculosis–infected recipients. Donor CD4 T cells from the four vaccination groups were isolated by negative selection from spleens and inguinal lymph nodes and stained either with Cell Proliferation Dye eFluor 450 or Cell Proliferation Dye eFluor 670 to distinguish cells from BCG-primed animals and cells from animals receiving the subunit vaccine as a standalone. Stained cells were mixed in a ∼1:1 ratio (subunit:BCG prime plus subunit) and cotransferred into M. tuberculosis Erdman–infected recipients in a total 5 × 10⁶ donor CD4 T cells per recipient. Eighteen hours after transfer, recipient mice were injected with FITC-labeled anti-CD45.2 for intravascular labeling, and lung cells were harvested for flow cytometric analysis based on CDP450/670 as well as cytokine staining following H65/H74 stimulation (Fig. 4C, Supplemental Fig. 4). In mice receiving H65-specific cells, only 39.6–72.0% (mean 64%) of the cells from the BCG-H65–boosted donor mice were located in the lung parenchyma, whereas the range was 79.3–99.4% (mean 90%) for donor cells from H65-only vaccinated mice (Fig. 4D). In contrast, we found no significant differences in the percentage of H74-specific CD4 T cells in the parenchyma regardless of whether the cells came from H74 only or BCG-H74–vaccinated animals (range 78.0–99.4 and 72.0–99.4%, respectively, with means of 85.0 and 84.2%). These results clearly demonstrate that pre-existing BCG immunity significantly impacts the functionality of the T cells induced by subunit booster vaccines and that this mechanism can be efficiently bypassed by designing vaccines that selectively incorporate BCG-complementing TB Ags. Discussion The capacity of CD4 T cells to protect against M. tuberculosis is governed by their differentiation state and ability to localize to the site of infection (37). M. bovis BCG vaccination primes a polyfunctional CD4 T cell response that differentiates over time and gradually loses the ability to produce IL-2, proliferate, and to localize to the site of infection, which results in a loss of long-term protective efficacy (11–13). Heterologous prime–boost strategies, in which BCG vaccination is followed by a subunit vaccine boost, are aiming at improving the BCG-induced adaptive immunity in terms of magnitude, durability, and quality of the CD4 T cell response (38). In this study, we tested whether pre-existing BCG immunity impacts the vaccine response of either a “traditional” BCG booster vaccine (H65) or a complementary vaccine based on ESX-1–associated Ags that are specific for M. tuberculosis (H74 and H64, referred to collectively as “ESX-1 vaccines”). In the initial characterization of the ESX-1 vaccines, we demonstrated significant long-term protection in M. tuberculosis H37Rv–challenged guinea pigs as well as M. tuberculosis Erdman–challenged mice. To extend the study beyond the conventional laboratory M. tuberculosis strains, we challenged vaccinated mice with four different strains of M. tuberculosis belonging to three phylogenetically different lineages. The ESX-1 vaccine induced significant protection against all four strains, suggesting that the vaccine will be effective against a broad range of clinical isolates. Two of the selected isolates were part of the W-Beijing family of M. tuberculosis strains, one of them being the hypervirulent M. tuberculosis Beijing HN878. The Beijing strains are particularly relevant to include in this screening as they are highly prevalent, overrepresented among drug-resistant isolates (39), and significantly associated with HIV coinfection in human cases of TB meningitis (40). In a conventional protection readout at 4 wk postinfection, both the ESX-1 vaccine and BCG were highly protective against M. tuberculosis Beijing HN878. This was also true at the later time point for the ESX-1 vaccine, but in line with earlier studies (27, 41), BCG’s protective efficacy waned at the later stage of infection. In the prime–boost model, our data indicates that BCG vaccination has a major influence on the immune responses induced by subsequent subunit vaccines, depending on whether the Ags are shared with BCG or not. Specifically, we observed that boosting BCG with H65 only marginally changed the specific CD4 T cell differentiation status with little or no improvement of the protection. In contrast, BCG priming had minimal influence on the differentiation and functionality of CD4 T cells induced by the ESX-1 vaccine (not sharing Ags with BCG). The ESX-1 vaccine–specific T cells retained their differentiation status after M. tuberculosis infection, and their ability to enter the infected lung parenchyma was increased compared with the T cells in the H65-boosted group. As a result, the ESX-1 vaccine significantly augmented an already strong BCG-induced protection, and we obtained 1.8–2.9 log10 reduction in the lung bacterial load. Importantly, the BCG-priming vaccine was administered more than 6 mo prior to subunit vaccination, suggesting that it was the BCG “T cell imprint,” rather than ongoing bacterial multiplication, that influenced the response of the subunit booster vaccine. In other words, the BCG-specific CD4 T cells appeared to be “locked” with minimal capacity for reprograming into potentially more favorable phenotypes 6 mo later. This is likely because highly differentiated Th1 cells exhibit limited functional plasticity (42, 43) and that subunit boosting merely expands the existing pool (or a subset) of BCG-imprinted CD4 T cells. In addition, BCG may also induce a specific regulatory T cell response that could influence booster vaccines, although this was not investigated in this study (44, 45). Regardless, de novo priming of CD4 T cells using ESX-1–associated (or other M. tuberculosis–specific) Ags bypass this issue, which could be a useful strategy to increase durable protection in BCG-vaccinated populations. A limitation of this study was a lack of specific homing-related makers in the analysis, and in future studies, it will be important to establish whether vaccine-induced reduction of T cell differentiation leads to increased expression of such markers and/or increased contact between Ag-specific CD4 T cells and M. tuberculosis–infected macrophages in the lung. The mouse model has been extensively used to evaluate new prime–boost strategies using M. bovis BCG and subunit vaccines. The results have varied from no additional protection to almost 2 log10 protection compared with the BCG control group (46–48). It is difficult to do a comparative evaluation of these results as the studies differ with regard to vaccine design, mouse strain, M. tuberculosis challenge strain, BCG strain, and dose as well as the interval between prime–boost, boost–challenge, and challenge–sacrifice. However, by evaluating eight different available studies with BCG booster vaccines, we observed that the added protection of BCG boosting only was significant when the BCG-induced protection in itself was low (<0.5 log10) (47, 49–55). In light of our results, one explanation for this could be that a poor BCG vaccine take (or a waning response) will open up for better priming of less differentiated T cell response by the subunit vaccine. In humans, BCG will in most cases be administered to infants, and future booster vaccines are intended to be administered 10–15 y later and preferably before the protective efficacy of BCG wanes. It is not clear how pre-existing BCG immunity will influence subunit vaccination in this setting, and exposure to M. tuberculosis is also likely to play a dominant role in high-endemic areas. In this regard, results demonstrating that subunit vaccines can build on pre-existing M. tuberculosis immunity have been obtained in the recent phase IIb trial, in which M72/AS01e induced 49.7% vaccine efficacy against pulmonary disease in quantiferon positive individuals after 3 y of follow-up (56). Encouragingly, in this study, we also demonstrate that H74 vaccination significantly reduced bacterial burden in the modified Cornell model of postexposure vaccination. Similarly, regarding BCG-vaccinated quantiferon negative individuals, a recent study showed that it is possible to boost BCG protection with a subunit vaccine in adolescents and adults to some extent (57). In this study, H4:IC31 boosting led to 30.1% vaccine efficacy against sustained quantiferon conversion, and based on our data, we speculate that subunit vaccines with ESX-1–associated Ags have the potential to further improve on this result. Additionally, in the study by Nemes et al., BCG revaccination showed a vaccine efficacy of 40.5%, which has sparked renewed interest in using BCG revaccination as a readily applicable intervention (58). In such settings, the influence of recent “BCG imprinting” is likely to be significantly higher if BCG revaccination is to be combined with future subunit vaccines. In conclusion, mycobacterial priming by BCG vaccination induces highly differentiated CD4 T cells that, for at least 6 mo in the mouse model, restrict subsequent booster vaccines in priming additional protective T cells with sufficient memory and lung-homing potential. This phenomenon can efficiently be bypassed by designing vaccines with M. tuberculosis–specific Ags, like the ESX-1–associated Ags studied in this report. We suggest that future studies explore these findings in the human setting, in which it could also be investigated whether exposure to non-tuberculousis mycobacteria play a role in maintaining BCG immunity/T cell “imprint.” Disclosures C.A., N.P.H.K., I.S., E.H.K., T.L., E.M.A., M.R., I.R., P.A., and R.M. are employed by Statens Serum Institut, a nonprofit government research facility of which H56, H64, and H74 and the CAF01 adjuvant are proprietary products. C.A., P.A., and R.M. are coinventors of patents covering ESX-1–based vaccines. Acknowledgments We thank Joshua Woodworth for input on data interpretation and gratefully acknowledge Vivi Andersen and Camilla Rasmussen at Statens Serum Institut for excellent technical assistance. Footnotes This work was supported by The Danish Research Council (DFF - 7016-00310), the National Institutes of Health/National Institute of Allergy and Infectious Diseases (Grant 1R01AI135721-01), the European Union’s Horizon 2020 Framework Programme for Research and Innovation under Grant Agreement 643381 as part of the TBVAC2020 Consortium, and the National Institutes of Health/National Institute of Allergy and Infectious Diseases program Advanced Small Animal Models for the Testing of Candidate Therapeutic and Preventative Interventions against Mycobacteria (HHSN272201000009I-003, Task Order 12) at Colorado State University. The online version of this article contains supplemental material. Abbreviations used in this article: BCG Bacillus Calmette–Guérin FDS functional differentiation score MIRU mycobacterial interspersed repetitive unit TB tuberculosis. Received May 18, 2020. Accepted August 5, 2020. Copyright © 2020 by The American Association of Immunologists, Inc. This article is distributed under The American Association of Immunologists, Inc., Reuse Terms and Conditions for Author Choice articles. References ↵WHO. 2018. Global Tuberculosis Report 2018. World Health Organization, Geneva, Switzerland. ↵Trunz, B. B., P. Fine, C. Dye. 2006. Effect of BCG vaccination on childhood tuberculous meningitis and miliary tuberculosis worldwide: a meta-analysis and assessment of cost-effectiveness. Lancet 367: 1173–1180.OpenUrlCrossRefPubMed ↵Mangtani, P., I. Abubakar, C. Ariti, R. Beynon, L. Pimpin, P. E. M. Fine, L. C. Rodrigues, P. G. Smith, M. Lipman, P. F. Whiting, J. A. Sterne. 2014. Protection by BCG vaccine against tuberculosis: a systematic review of randomized controlled trials. Clin. Infect. Dis. 58: 470–480.OpenUrlCrossRefPubMed ↵Leveton, C., S. Barnass, B. Champion, S. Lucas, B. De Souza, M. Nicol, D. Banerjee, G. Rook. 1989. T-cell-mediated protection of mice against virulent Mycobacterium tuberculosis. Infect. Immun. 57: 390–395. ↵Green, A. M., R. Difazio, J. L. Flynn. 2013. IFN-γ from CD4 T cells is essential for host survival and enhances CD8 T cell function during Mycobacterium tuberculosis infection. J. Immunol. 190: 270–277. ↵Moguche, A. O., M. Musvosvi, A. Penn-Nicholson, C. R. Plumlee, H. Mearns, H. Geldenhuys, E. Smit, D. Abrahams, V. Rozot, O. Dintwe, et al. 2017. Antigen availability shapes T cell differentiation and function during tuberculosis. Cell Host Microbe 21: 695–706.e5.OpenUrlCrossRefPubMed ↵Sallin, M. A., S. Sakai, K. D. Kauffman, H. A. Young, J. Zhu, D. L. Barber. 2017. Th1 differentiation drives the accumulation of intravascular, non-protective CD4 T cells during tuberculosis. Cell Rep. 18: 3091–3104.OpenUrlCrossRef ↵He, H., P. N. Nehete, B. Nehete, E. Wieder, G. Yang, S. Buchl, K. J. Sastry. 2011. Functional impairment of central memory CD4 T cells is a potential early prognostic marker for changing viral load in SHIV-infected rhesus macaques. PLoS One 6: e19607. ↵Sakai, S., K. D. Kauffman, J. M. Schenkel, C. C. McBerry, K. D. Mayer-Barber, D. Masopust, D. L. Barber. 2014. Cutting edge: control of Mycobacterium tuberculosis infection by a subset of lung parenchyma-homing CD4 T cells. J. Immunol. 192: 2965–2969. ↵Srivastava, S., J. D. Ernst. 2013. Cutting edge: direct recognition of infected cells by CD4 T cells is required for control of intracellular Mycobacterium tuberculosis in vivo. J. Immunol. 191: 1016–1020. ↵Lindenstrøm, T., A. Moguche, M. Damborg, E. M. Agger, K. Urdahl, P. Andersen. 2018. T cells primed by live mycobacteria versus a tuberculosis subunit vaccine exhibit distinct functional properties. EBioMedicine 27: 27–39.OpenUrl Perdomo, C., U. Zedler, A. A. Kühl, L. Lozza, P. Saikali, L. E. Sander, A. Vogelzang, S. H. E. Kaufmann, A. Kupz. 2016. Mucosal BCG vaccination induces protective lung-resident memory T cell populations against tuberculosis. mBio 7: e01686-16. ↵Orme, I. M. 2010. The Achilles heel of BCG. Tuberculosis (Edinb.) 90: 329–332.OpenUrlCrossRef ↵Rodo, M. J., V. Rozot, E. Nemes, O. Dintwe, M. Hatherill, F. Little, T. J. Scriba. 2019. A comparison of antigen-specific T cell responses induced by six novel tuberculosis vaccine candidates. PLoS Pathog. 15: e1007643. ↵Woodworth, J. S., S. B. Cohen, A. O. Moguche, C. R. Plumlee, E. M. Agger, K. B. Urdahl, P. Andersen. 2017. Subunit vaccine H56/CAF01 induces a population of circulating CD4 T cells that traffic into the Mycobacterium tuberculosis-infected lung. Mucosal Immunol. 10: 555–564.OpenUrlCrossRefPubMed ↵Hoang, T., C. Aagaard, J. Dietrich, J. P. Cassidy, G. Dolganov, G. K. Schoolnik, C. V. Lundberg, E. M. Agger, P. Andersen. 2013. ESAT-6 (EsxA) and TB10.4 (EsxH) based vaccines for pre- and post-exposure tuberculosis vaccination. PLoS One 8: e80579. Billeskov, R., T. Lindenstrøm, J. Woodworth, C. Vilaplana, P. J. Cardona, J. P. Cassidy, R. Mortensen, E. M. Agger, P. Andersen. 2018. High antigen dose is detrimental to post-exposure vaccine protection against tuberculosis. Front. Immunol. 8: 1973.OpenUrl Henao-Tamayo, M., G. S. Palaniswamy, E. E. Smith, C. A. Shanley, B. Wang, I. M. Orme, R. J. Basaraba, N. M. DuTeau, D. Ordway. 2009. Post-exposure vaccination against Mycobacterium tuberculosis. Tuberculosis (Edinb.) 89: 142–148.OpenUrl Turner, J., E. R. Rhoades, M. Keen, J. T. Belisle, A. A. Frank, I. M. Orme. 2000. Effective preexposure tuberculosis vaccines fail to protect when they are given in an immunotherapeutic mode. Infect. Immun. 68: 1706–1709. ↵Taylor, J. L., O. C. Turner, R. J. Basaraba, J. T. Belisle, K. Huygen, I. M. Orme. 2003. Pulmonary necrosis resulting from DNA vaccination against tuberculosis. Infect. Immun. 71: 2192–2198. ↵Knudsen, N. P., S. Nørskov-Lauritsen, G. M. Dolganov, G. K. Schoolnik, T. Lindenstrøm, P. Andersen, E. M. Agger, C. Aagaard. 2014. Tuberculosis vaccine with high predicted population coverage and compatibility with modern diagnostics. Proc. Natl. Acad. Sci. USA 111: 1096–1101. ↵Aguilo, N., J. Gonzalo-Asensio, S. Alvarez-Arguedas, D. Marinova, A. B. Gomez, S. Uranga, R. Spallek, M. Singh, R. Audran, F. Spertini, C. Martin. 2017. Reactogenicity to major tuberculosis antigens absent in BCG is linked to improved protection against Mycobacterium tuberculosis. Nat. Commun. 8: 16085.OpenUrlCrossRef ↵Pym, A. S., P. Brodin, L. Majlessi, R. Brosch, C. Demangel, A. Williams, K. E. Griffiths, G. Marchal, C. Leclerc, S. T. Cole. 2003. Recombinant BCG exporting ESAT-6 confers enhanced protection against tuberculosis. Nat. Med. 9: 533–539.OpenUrlCrossRefPubMed Gröschel, M. I., F. Sayes, S. J. Shin, W. Frigui, A. Pawlik, M. Orgeur, R. Canetti, N. Honoré, R. Simeone, T. S. van der Werf, et al. 2017. Recombinant BCG expressing ESX-1 of Mycobacterium marinum combines low virulence with cytosolic immune signaling and improved TB protection. Cell Rep. 18: 2752–2765.OpenUrlCrossRef ↵Bottai, D., W. Frigui, S. Clark, E. Rayner, A. Zelmer, N. Andreu, M. I. de Jonge, G. J. Bancroft, A. Williams, P. Brodin, R. Brosch. 2015. Increased protective efficacy of recombinant BCG strains expressing virulence-neutral proteins of the ESX-1 secretion system. Vaccine 33: 2710–2718.OpenUrlCrossRefPubMed ↵Aagaard, C. S., T. T. Hoang, C. Vingsbo-Lundberg, J. Dietrich, P. Andersen. 2009. Quality and vaccine efficacy of CD4+ T cell responses directed to dominant and subdominant epitopes in ESAT-6 from Mycobacterium tuberculosis. J. Immunol. 183: 2659–2668. ↵Aagaard, C., T. Hoang, J. Dietrich, P. J. Cardona, A. Izzo, G. Dolganov, G. K. Schoolnik, J. P. Cassidy, R. Billeskov, P. Andersen. 2011. A multistage tuberculosis vaccine that confers efficient protection before and after exposure. Nat. Med. 17: 189–194.OpenUrlCrossRefPubMed ↵Cole, S. T., R. Brosch, J. Parkhill, T. Garnier, C. Churcher, D. Harris, S. V. Gordon, K. Eiglmeier, S. Gas, C. E. Barry III., et al. 1998. Deciphering the biology of Mycobacterium tuberculosis from the complete genome sequence. Nature 393: 537–544.OpenUrlCrossRefPubMed ↵Behr, M. A., M. A. Wilson, W. P. Gill, H. Salamon, G. K. Schoolnik, S. Rane, P. M. Small. 1999. Comparative genomics of BCG vaccines by whole-genome DNA microarray. Science 284: 1520–1523. ↵Millington, K. A., S. M. Fortune, J. Low, A. Garces, S. M. Hingley-Wilson, M. Wickremasinghe, O. M. Kon, A. Lalvani. 2011. Rv3615c is a highly immunodominant RD1 (region of difference 1)-dependent secreted antigen specific for Mycobacterium tuberculosis infection. Proc. Natl. Acad. Sci. USA 108: 5730–5735. ↵van Pinxteren, L. A., P. Ravn, E. M. Agger, J. Pollock, P. Andersen. 2000. Diagnosis of tuberculosis based on the two specific antigens ESAT-6 and CFP10. Clin. Diagn. Lab. Immunol. 7: 155–160.OpenUrlCrossRefPubMed ↵Coscolla, M., S. Gagneux. 2010. Does M. tuberculosis genomic diversity explain disease diversity? Drug Discov. Today Dis. Mech. 7: e43–e59.OpenUrlCrossRefPubMed ↵Manca, C., L. Tsenova, S. Freeman, A. K. Barczak, M. Tovey, P. J. Murray, C. Barry, G. Kaplan. 2005. Hypervirulent M. tuberculosis W/Beijing strains upregulate type I IFNs and increase expression of negative regulators of the Jak-Stat pathway. J. Interferon Cytokine Res. 25: 694–701.OpenUrlCrossRefPubMed ↵Nandakumar, S., S. Kannanganat, J. E. Posey, R. R. Amara, S. B. Sable. 2014. Attrition of T-cell functions and simultaneous upregulation of inhibitory markers correspond with the waning of BCG-induced protection against tuberculosis in mice. PLoS One 9: e113951. ↵Seder, R. A., P. A. Darrah, M. Roederer. 2008. T-cell quality in memory and protection: implications for vaccine design. [Published erratum appears in 2008 Nat. Rev. Immunol. 8: 486.] Nat. Rev. Immunol. 8: 247–258.OpenUrlCrossRefPubMed ↵McCune, R. M. Jr.., W. McDermott, R. Tompsett. 1956. The fate of Mycobacterium tuberculosis in mouse tissues as determined by the microbial enumeration technique. II. The conversion of tuberculous infection to the latent state by the administration of pyrazinamide and a companion drug. J. Exp. Med. 104: 763–802.OpenUrlAbstract ↵Sakai, S., K. D. Mayer-Barber, D. L. Barber. 2014. Defining features of protective CD4 T cell responses to Mycobacterium tuberculosis. Curr. Opin. Immunol. 29: 137–142.OpenUrlCrossRefPubMed ↵Lewinsohn, D. A., D. M. Lewinsohn, T. J. Scriba. 2017. Polyfunctional CD4+ T cells as targets for tuberculosis vaccination. Front. Immunol. 8: 1262.OpenUrlCrossRefPubMed ↵Glynn, J. R., J. Whiteley, P. J. Bifani, K. Kremer, D. van Soolingen. 2002. Worldwide occurrence of Beijing/W strains of Mycobacterium tuberculosis: a systematic review. Emerg. Infect. Dis. 8: 843–849.OpenUrlCrossRefPubMed ↵Caws, M., G. Thwaites, K. Stepniewska, T. N. Nguyen, T. H. Nguyen, T. P. Nguyen, N. T. Mai, M. D. Phan, H. L. Tran, T. H. Tran, et al. 2006. Beijing genotype of Mycobacterium tuberculosis is significantly associated with human immunodeficiency virus infection and multidrug resistance in cases of tube
|
|
Scooped by
Gilbert C FAURE
July 30, 2020 3:09 AM
|
PRR (Pattern Recognition Receptor) agonists have been widely tested as potent vaccine adjuvants. TLR7 (Toll-Like Receptor 7) and NOD2 (nucleotide-bind…
|
|
Scooped by
Gilbert C FAURE
June 4, 2020 11:41 AM
|
Achieving high levels of neutralizing antibodies to the spike protein of SARS-CoV-2 in a safe manner is likely to be crucial for an effective vaccine. Here, we propose that aluminium-based adjuvants might hold the key to this. Here, Peter Hotez and colleagues discuss the advantages of using an aluminium-based adjuvant in candidate COVID-19 vaccines.
|
|
Scooped by
Krishan Maggon
May 11, 2020 3:50 AM
|
We found that daily food exposure only induced low-level, cross-reactive IgA in a minority of mice. In contrast, induction of significant levels of peanut-specific IgA strictly required a mucosal adjuvant. Although induction of peanut-specific IgA required T cells and CD40L, it was T follicular helper (TFH) cell, germinal center, and T follicular regulatory (TFR) cell–independent. In contrast, IgG1 and IgE production to peanut required TFH cells. These data suggest an alternative paradigm in which the cellular mechanism of IgA production to food antigens is distinct from IgE and IgG1. We developed an equivalent assay to study this process in stool samples from healthy, nonallergic humans, which revealed substantial levels of peanut-specific IgA that were stable over time. Similar to mice, patients with loss of CD40L function had impaired titers of gut peanut-specific IgA. This work challenges two widely believed but untested paradigms about antibody production to dietary antigens: (i) the steady state/tolerogenic response to food antigens includes IgA production and (ii) TFH cells drive food-specific gut IgA.
|
|
Scooped by
Krishan Maggon
March 6, 2020 3:40 AM
|
High PROX1 expression is associated with a better prognosis and low stromal content in human CRCs. PROX1 is highly expressed in a subpopulation of CRC stem/progenitor cells (CSCs) in human WNThi MSS tumors, but not in WNTlo MSI tumors (28). We and others found that PROX1 sustains the metabolic fitness of CSCs and potentiates the growth of colon cancer cells in 3D organoid and mouse models (28, 29). To further study the clinical relevance of these observations, we analyzed the association of PROX1 with clinical outcomes in 444 patients from a prognostically annotated CRC gene expression data set (Gene Expression Omnibus [GEO] GSE39582) (30). Surprisingly, we found that high levels of PROX1 were associated with improved overall survival (Figure 1A). Analysis of pathways associated with PROX1 expression further showed that high PROX1 expression was positively correlated with WNT activation (Figure 1B), in agreement with previous data (28). Accordingly, PROX1 expression was highest in the WNThi CMS2 group (Figure 1C). Our clinical outcome analysis differed from the results of a previous histopathological study (31), therefore, we also analyzed tumors classified according to 5 intrinsic subtypes (6) and found that PROX1 expression was significantly higher in the WNThi CRIS-C, -D, and -E subtypes compared with expression in the poor-prognosis CRIS-B subtype (Figure 1D). Figure 1 High PROX1 expression is associated with better clinical outcomes and low stromal content. (A) Kaplan-Meier overall survival curves for patients with high or low PROX1 levels in MSS CRC tumors (GEO GSE39582; n = 444). Progression-free survival showed the same trend but did not reach significance (P = 0.3). (B) PROX1 expression correlation with WNT pathway activation in MSS CRCs (GSE39582; n = 444). Dashed line indicates the locally estimated scatterplot smoothing (LOESS) fit. (C) PROX1 expression in CRC CMS subgroups (GSE39582; n = 409). CMS1 MSI-like (n = 21); CMS2 high WNT signaling (n = 217); CMS3 KRAS-mutant and metabolic alterations (n = 63); CMS4 TGF-β–driven stromal and angiogenic activation (n = 108). P < 0.001, by 1-way ANOVA with Tukey’s multiple comparisons test. P < 0.001, for CMS2 verus CMS1; P = 0.001, for CMS2 versus CMS3; P = 0.003, for CMS2 versus CMS4. (D) PROX1 expression in intrinsic CRIS subtypes. CRIS-A: BRAF- or KRAS-mutated, secretory (n = 88); CRIS-B TGF-β signaling, EMT features (n = 59); CRIS-C KRAS WT, high ERBB/EGFR pathway activity, MYC copy number gains (n = 119); CRIS-D: high WNT, IGF2 amplification, and FGFR autocrine stimulation (n = 96); CRIS-E: high WNT, Paneth-like phenotype, and TP53-mutations (n = 82) in GSE39582 (n = 444). P < 0.001, by 1-way ANOVA with Tukey’s multiple comparisons test. (E) PROX1 expression negatively correlated with a tumor stromal signature in MSS CRCs (GSE39582; n = 444). The stromal gene signature is from ref. 80. Enrichment was computed using single-sample GSEA (81). Dashed line indicates the linear regression fit. (F) Scatterplot of the negative correlation between scores for PROX1 protein nuclear expression levels in tumor cells and for stromal content over the total tumor area, in MSS primary CRC samples (n = 114). (G) Representative images of CRC adenocarcinomas with high and low PROX1 scores. PROX1 staining (brown) and DNA counterstaining (blue) are shown. Scale bars: 200 μm. PROX1 expression was negatively correlated with a stromal gene signature (Figure 1E), consistent with decreased PROX1 expression in desmoplastic CMS4 CRCs (Figure 1C). For an independent validation of these data, we quantified PROX1 protein and stromal content of 114 primary MSS CRCs. We found that tumors with low nuclear PROX1 levels had greater stromal content (Figure 1, F and G, and Supplemental Table 1; supplemental material available online with this article; https://doi.org/10.1172/JCI129558DS1). These data indicate that low PROX1 expression is associated with reduced WNT activation, high stromal content, and worse clinical outcomes in human MSS CRCs. Inactivation of Prox1 attenuates WNT signaling in mouse intestinal tumors. We used Apcfl/fl Tp53fl/fl villin-CreERT2 (AP) and Apcfl/fl Tp53fl/fl Prox1fl/lf villin-CreERT2 (APP) mice, in which Apc, Tp53, and Prox1 can be conditionally inactivated in the intestinal epithelium to induce tumors, to determine whether Prox1 expression in cancer cells regulates tumor stromal content and properties. We induced tumors in both AP and APP mice by microinjection of tamoxifen into the cecum. With this approach, ectopic hyperactivation of WNT signaling occurs in a limited number of intestinal epithelial cells and leads to the development of a single, large, and frequently invasive cecal tumor that does not interfere with intestinal transit, thus allowing for the study of advanced tumors (Figure 2A and Supplemental Figure 1A). Figure 2 Inactivation of Prox1 generates desmoplastic, angiogenic, and T cell–excluded tumors. (A) Apcfl/fl Tp53fl/fl villin-CreERT2 (AP) and Apcfl/fl Tp53fl/fl Prox1flfl villin-CreERT2 (APP) tumor models used in the study. (B) Appearance and weights of tumors and WT cecum and quantitative reverse transcription PCR (qRT-PCR) data for Lgr5 and Krt20. AP (n = 22); APP (n = 15); WT (n = 7). qRT-PCR data were normalized to the AP mean. AP or APP (n = 9); WT (n = 4). Scale bars: 4 mm. (C) Pathways enriched in APP versus AP transcriptomes (n = 6 per genotype). NES, normalized enrichment score. (D) APP tumors were desmoplastic. 3D reconstructions of tumor and WT cecum thick slices. Images show staining for PH3 (green), α-SMA (red), and E-cadherin (white). Scale bars: 50 μm. (E) Quantification of proliferation of stromal and tumor epithelial cells. The α-SMA+ area from D was normalized to the total tumor area and the AP mean. For the α-SMA+ area: AP (n = 10); APP or normal cecum (n = 7). For Ki67+ colocalization: AP or APP (n = 6); normal cecum (n = 4). (F) 3D vascular reconstructions from tumor slices. Images show staining for CD31 (green) and E-cadherin (white). Scale bars: 50 μm. (G) Quantification of vascular parameters and expression of the endothelial marker Cdh5. AP (n = 10); APP (n = 7); normal cecum (n = 7). AP or APP (n = 9); WT (n = 4). Data were normalized to the AP mean. (H) Reduced CD8+ T cell infiltration into APP tumors. Images show staining for CD8+ T cells (green), VE-cadherin (red), and E-cadherin (white). Scale bars: 50 μm. (I) Quantification of CD8+ T cells. AP (n = 10); APP (n = 6); normal cecum (n = 7). (J) APP signature is enriched in PROX1-low human CRCs. Enrichment of the APP versus AP signature in human CRCs (GSE39582; n = 444) was computed using Z scores. Dashed line indicates the linear regression fit. Data represent the mean ± SD. *P ≤ 0.05, **P ≤ 0.01, ***P ≤ 0.001, and ****P ≤ 0.0001, by 1-way ANOVA with Tukey’s multiple comparisons test (B, E, and G) and grouped analysis by 2-way ANOVA with Tukey’s multiple comparisons test (E). Abnormally high WNT signaling is a main driver of cancer cell proliferation, tumor growth, and dedifferentiation in Apc-mutant CRC models (32, 33). We found that APP mouse tumors were significantly smaller than AP mouse tumors 4 weeks after tamoxifen microinjection (Figure 2B), in agreement with previous observations in Apcmin/+ Prox1fl/fl villin-Cre adenomas (22). Expression of the WNT target genes leucine-rich repeat–containing G protein–coupled receptor 5 (Lgr5), lymphoid enhancer binding factor 1 (Lef1), ring finger protein 43 (Rnf43), and Eph receptor B2 (EphB2) (34–36) was decreased but not completely abolished upon loss of Prox1 (Figure 2B and Supplemental Figure 1B), indicating partial inhibition of WNT signaling. Interestingly, the WNT-dependent, cancer-specific V6 isoform of the hyaluronan receptor CD44 (37) was strongly upregulated in APP tumors (Supplemental Figure 1, B and D). CD44V6 is a marker of CRC tumor–initiating cells that was previously shown to drive CRC invasion and metastasis (38). Unexpectedly, expression of keratin 20 (Krt20), a marker for enterocyte differentiation, was not rescued by Prox1 loss (Figure 2B and Supplemental Figure 1, B and C). Compared with AP cancer cells, APP cancer cells had a decreased proliferation index, as assessed by expression of the proliferation genes Ki67 and cyclin B1 (Ccnb1) (Supplemental Figure 1B). These results suggest that Prox1 loss in APP tumors skews the expression of WNT-dependent genes and attenuates WNT signaling without inducing differentiation. Inactivation of Prox1 generates desmoplastic, angiogenic, and T cell–excluded tumors. Comparison of tumor transcriptomes by RNA-Seq analysis revealed significant enrichment of transcripts related to EMT, angiogenesis, myogenesis and oxidative phosphorylation, and downregulation of transcripts related to the adaptive immune response in APP versus AP tumors (Figure 2C). Enrichment in EMT and angiogenesis transcripts is a feature of human desmoplastic CRCs that reflects expansion of the stromal cell compartment (8, 9). Staining for α–smooth muscle actin (α-SMA), which is expressed in cancer-associated fibroblasts (CAFs) and myofibroblasts, the epithelial marker E-cadherin, and the proliferation marker phosphohistone H3 (PH3), revealed increased stromal cell content and correspondingly lower epithelial cell content and proliferation in APP compared with AP tumors, indicative of increased desmoplasia (Figure 2, D and E). Accordingly, mRNA levels of the CAF markers and TGF-β target genes fibroblast activation protein α (Fap), periostin (Postn), and serpin family E member 1 (Serpine1, also known as Pai1) (39) were significantly increased (Supplemental Figure 1E). Consistent with the RNA-Seq data, APP tumors displayed a denser and more intricate blood microvascular network, whereas sparse and large blood vessels were observed in AP tumors (Figure 2, F and G). AP tumors displayed areas of high intraepithelial infiltration by CD8+ T cells, which were absent in the majority of APP tumors, indicative of immune exclusion (Figure 2, H and I). We computed an enrichment score in human MSS CRCs on the basis of genes differentially expressed in APP versus AP tumors (APP signature) and found that the transcriptomes of the PROX1lo human MSS CRCs were enriched for the APP signature (Figure 2J). Taken together, these results indicate that in mouse intestinal tumors, loss of Prox1 in cancer cells promotes desmoplasia, angiogenesis, and T cell exclusion, which are associated with poor prognosis in human CRCs. Prox1 loss generates desmoplastic tumors in the presence of activated KRAS. In addition to APC and TP53, KRAS is mutated in a significant proportion of CRCs. Constitutive KRAS activation confers an additional growth advantage to APC-mutant cancer cells and promotes resistance to EGFR-targeted therapies in patients with CRC (40). We analyzed the growth of intestinal organoids isolated from Apcfl/fl KrasLSL-G12D Tp53fl/fl villin-CreERT2 (AKP) and Apcfl/fl KrasLSL-G12D Tp53fl/fl Prox1fl/fl villin-CreERT2 (AKPP) mice. Prox1 inactivation reduced the number of organoids that formed in Matrigel from AKPP cells (Figure 3A). These organoids had reduced cell proliferation rates (Supplemental Figure 2A) and grew as large, simple cysts, whereas most AKP organoids formed complex 3D structures (Figure 3B). The analysis of WNT target genes in AKPP organoids showed partial attenuation of WNT signaling but no induction of differentiation (Figure 3C), consistent with APP tumor phenotypes (see above) and our previous findings in KRAS-mutant human CRC cell lines (28). Therefore, Prox1 loss blunted cancer cell–autonomous growth also in the presence of strong KRAS oncogenic signaling. Figure 3 Prox1 loss generates desmoplastic tumors in the presence of activated Kras. (A) Reduced clonogenic capacity of Prox1–/– intestinal stem cells. Apcfl/fl KrasLSL-G12D Tp53fl/fl villin-CreERT2 (AKP) and Apcfl/fl KrasLSL-G12D Tp53fl/fl Prox1fl/fl villin-CreERT2 (AKPP) organoids (n = 12 per genotype). (B) AKP and AKPP organoids. Upper row shows Matrigel disks with organoids. Scale bars: 1.2 mm. Lower row shows H&E-stained organoid sections. Scale bars: 20 μm. Arrow indicates epithelial polarization loss. (C) WNT signaling and differentiation in AKP and AKPP organoids. Graph shows qRT-PCR for the indicated genes, and data are presented in a heatmap (n = 5). (D) PROX1 loss delayed tumor development. Mice were injected s.c. with 50 AKP or AKPP organoids. AKP, n = 5; AKPP, n = 6. (E) Masson’s trichrome staining of advanced tumors. Scale bars: 50 μm. (F) Increased stromal reaction and invasion in AKPP tumor margins. Images in top row show staining for PROX1 (green), E-cadherin (red), Ki67 (white), and DNA (blue). Images in bottom row show staining for POSTN (green), CD44V6 (red), α-SMA (white), and DNA (blue). Scale bars: 50 μm. (G) AKPP organoids produced profibrotic factors. Heatmap of the indicated genes (n = 5). (H) AKPP organoids promoted fibroblast proliferation. Ki67 and Ccnb1 expression by qRT-PCR. Data were normalized to the control mean (n = 6). (I) Tumor growth curves and weights. Mice were implanted with 50 AKP or 300 AKPP organoids ± 5000 tdTomato+ intestinal fibroblasts (Fibro.) (n = 7). (J) AKPP cells sustained fibroblasts. Images show control and tdTomato+ (red) fibroblast–coinjected tumors. Scale bars: 2 mm. (K) Fibroblast coimplantation effects on tumor desmoplasia, PROX1 expression, and cell proliferation. Images show staining for PROX1 (green), α-SMA (red), Ki67 (white), and DNA (blue). Scale bars: 50 μm. (L) Quantification of the data shown in K. α-SMA+ and Ki67+ areas were normalized to the total tumor area and the AKP mean. (M) Fibroblast and tissue stiffness effect on organoids. Organoids with or without tdTomato+ fibroblasts in hydrogels with normal mucosa (1.3 kPa) or tumor (2.7 kPa) stiffness. Scale bars: 1.2 mm. *P ≤ 0.05, **P ≤ 0.01, and ***P ≤ 0.001, by Student’s t test (A and C) or 1-way (H and L) or 2-way (I) ANOVA with Tukey’s multiple comparisons test, scatterplot, or mean ± SD. Prox1-deficient AKPP organoids implanted s.c. displayed rapid outgrowth after a long latency phase, indicating tumor adaptation to PROX1 deficiency (Figure 3D). This result was not due to clonal selection or acquisition of additional mutations, as organoids derived from primary tumors displayed similarly delayed growth kinetics upon ex vivo culturing or secondary implantation in mice (Supplemental Figure 2B). Large primary AKPP tumors (resected on day 93 after implantation) had increased production of the stromal proteins periostin, tenascin C, and α-SMA, increased stromal content, and increased expression of the CAF markers and TGF-β target genes Fap, Postn, Pai1, connective tissue growth factor (Ctgf), and osteopontin (Opn) (Figure 3E and Supplemental Figure 2, C and D), compared with AKP tumors (resected on day 26 after implantation). Increased accumulation of tumor stroma may be a result of delayed growth of AKPP tumors. To rule out this possibility, we implanted fewer AKP organoids and obtained comparable tumor growth kinetics with AKPP tumors. We then analyzed small size-matched AKP and AKPP tumors, which were resected on days 40 and 48 after implantation, respectively. Even in this setting, AKPP tumors showed increased α-SMA+ stromal cell abundance (Supplemental Figure 2E), indicating that desmoplasia is PROX1 dependent but tumor size independent. The proliferation of cancer cells was lower in AKPP tumors than in AKP tumors, irrespective of tumor size. We examined tumor margins and found a greater number of prominent invading cancer cell strands and increased proliferation of α-SMA+ stromal cells in AKPP tumors than in AKP tumors (Figure 3F and Supplemental Figure 2F). Collectively, these data demonstrate that genetic loss of Prox1 generates slow-growing but more invasive and desmoplastic tumors, regardless of the presence of mutant Kras. Fibroblasts and high tissue stiffness support the growth of Prox1-deficient tumors. Prox1-deficient AKPP organoids expressed higher levels of the profibrotic factors TGF-β1 (Tgfb1), platelet-derived growth factor C (Pdgfc), heparin-binding EGF-like growth factor (Hbegf), Ctgf, Opn, and IL-1β (Il1b) (Figure 3G), which may contribute to the promotion of expansion and activation of fibroblasts in tumors. Indeed, normal intestinal fibroblasts cocultured with AKPP organoids acquired a CAF-like phenotype characterized by enhanced expression of α-SMA (Acta2), Fap, Postn, Ctgf, and Pai1, compared with fibroblasts cocultured with AKP organoids. AKPP-conditioned fibroblasts had greater proliferation, as determined by expression of Ki67 and Ccnb1 (Figure 3H and Supplemental Figure 2G). Additionally, AKPP organoids also enhanced the expression of Tgfb1, matrix metalloproteases, inflammatory cytokines, and proangiogenic Vegfa in fibroblasts (Supplemental Figure 2G). To determine whether fibroblasts accelerate the progression of Prox1-deficient tumors, we coimplanted AKP or AKPP organoids together with fluorescent intestinal fibroblasts isolated from mTmG+ mice, in which all cells express the membrane-targeted tdTomato protein (41). The transplanted fibroblasts significantly enhanced the growth of AKPP but not AKP tumors (Figure 3I). Moreover, the exogenous fibroblasts persisted in AKPP but not AKP tumors, as shown by the presence of tdTomato+ cells (Figures 3J). Of interest, exogenous fibroblasts enhanced cell proliferation only in the AKPP tumors, as shown by Ki67 staining (Figure 3, K and L, and Supplemental Figure 2H). These results support the notion that Prox1-deficient tumors promote a profibrotic TME that in turn sustains the growth of Prox1-deficient cancer cells. We next examined the effects of intestinal fibroblasts on AKP and AKPP organoids. Because CAF-mediated extracellular matrix (ECM) deposition and increased tumor stiffness promote tumor growth (42), we cultured organoids in synthetic hydrogels with a stiffness similar to that of either normal intestine (1.3 kPa) or CRC stroma (2.7 kPa), as described previously (43), in the presence or absence of fibroblasts. We found that AKPP cells formed smaller organoids in synthetic hydrogels than in Matrigel (0.4 kPa) (Figure 3, M and B above). However, the addition of fibroblasts or high stiffness partly rescued, and their combination fully restored, the growth of AKPP organoids (Figure 3M and Supplemental Figure 2I). Conversely, fibroblasts and stiffness had modest, if any, effects on the growth of AKP organoids. Thus, both fibroblast-derived factors and increased tumor stiffness probably contribute to the promotion of AKPP tumor growth. Chemotherapy promotes stromal activation and progression of Prox1-deficient tumors. 5-FU–based adjuvant chemotherapy is the standard of care for CRC and improves patient survival; however, a substantial proportion of the patients either do not respond to this treatment or relapse (2). To determine whether PROX1 regulates responses to chemotherapy, we tested 5-FU or cisplatin as a control agent in AKP and AKPP organoids. Prox1-deficient AKPP organoids were less sensitive to 5-FU, an antimetabolite, than were AKP organoids, whereas AKP and AKPP organoids were similarly sensitive to cisplatin, which acts via a DNA cross-linking mechanism (Supplemental Figure 3A). We next investigated the response of s.c. AKP and AKPP tumors to chemotherapy. In order to obtain AKP and AKPP tumors with comparable growth rates, we injected an excess of AKPP organoids and initiated the treatment when tumors reached approximately 130 mm3 in size (Figure 4A). Both 5-FU and cisplatin rapidly arrested the growth of AKP tumors, however, they did not affect AKPP tumors. At the end of the experiments, the weight of treated AKP tumors was significantly reduced, whereas no difference was observed between the control and treated AKPP tumors (Figure 4A). Microscopic analysis showed that chemotherapy inhibited cancer cell proliferation in the core of AKP tumors (Supplemental Figure 3B), leading to significant central necrosis, but we observed no such effects in AKPP tumors, which had low cancer cell proliferation and high necrosis at baseline (Supplemental Figure 3B). We observed major differences in the tumor margins. Chemotherapy inhibited cancer cell proliferation and reduced peritumoral vascular density at the margins of the AKP tumors, whereas the AKPP tumor margins showed high fibroblast proliferation, sustained vascularization, and exacerbated invasion (Figure 4, B and C, and Supplemental Figure 3C), with occasional intravasation of cancer cells into peritumoral blood vessels (Supplemental Figure 3D), which we never observed in AKP tumors. Together, these results suggest that loss of Prox1 protects tumors from the effects of chemotherapy. Figure 4 Prox1-deficient tumors are chemoresistant. (A) Tumor response to chemotherapy. Mice were implanted s.c. with 50 AKP or 300 AKPP organoids, and treatment with 5-FU or cisplatin was initiated when the mean volume of the tumors reached 130 mm3 (n = 7). (B) Chemotherapeutic effect on tumor margins. Images show staining for PH3 (green), α-SMA (red), and E-cadherin (white). Scale bars: 50 μm. (C) Quantification of cell death, proliferation, and angiogenesis for the images in B. Cell death is indicated as the percentage of necrotic tumor glands. Other data are indicated by the fold change versus the AKP control mean. Cis, cisplatin. (D) Macroscopic appearance of control- and 5-FU–treated AP and APP tumors and tumor weights at sacrifice. AP control, n = 7; AP 5-FU, n = 6; APP control, n = 4; APP 5-FU, n = 5. Scale bars: 2 mm. (E) 5-FU effects on tumor desmoplasia and cancer cells. Images show staining for PH3 (proliferation, green), α-SMA (fibroblasts, red), and E-cadherin (tumor cells, white). Scale bars: 50 μm. (F) Quantification of tumor cell proliferation and death. α-SMA+, PH3+E-cadherin+, and PH3+α-SMA+ areas were quantified and normalized to total tumor E-cadherin+ or α-SMA+ areas and the AP control mean. Cell death is shown as a percentage of necrotic tumor glands. (G) 5-FU effect on angiogenesis. CD31+ vessel density is presented as the fold change versus the AP control mean. (H) Images show staining for CD31 (green), α-SMA (red), E-cadherin (white), and DNA (blue). Scale bars: 50 μm. (I) 5-FU suppressed proliferation and promoted the expression of CAF markers and fibrotic ligand in cultured fibroblasts. A heatmap of the indicated genes is shown. Intestinal fibroblasts were cultured for 24 hours in the presence of 2.5 μM 5-FU, 50 ng/mL TGF-β1, or control (n = 3). Data represent the mean ± SD. *P ≤ 0.05, **P ≤ 0.01, ***P ≤ 0.001, and ****P ≤ 0.001, by 1-way (scatterplots) or 2-way (growth curves) ANOVA with Tukey’s multiple comparisons test. N, necrosis. We next studied the effects of chemotherapy on autochthonous (tamoxifen-induced) AP and APP tumors. 5-FU significantly reduced AP tumor size, however, it unexpectedly enhanced the growth of APP tumors (Figure 4D). In analogy with observations in the s.c. models, 5-FU induced cell death and reduced cancer cell proliferation in AP but not APP tumors (Figure 4, E and F). Importantly, both fibroblast proliferation and angiogenesis were further increased in 5-FU–treated APP tumors (Figure 4, F–H). In addition to CAF and angiogenesis markers, we found that Il1b and Ly6g were also induced, indicating increased inflammation and an influx of neutrophils (Supplemental Figure 3E). Previous studies demonstrated that 5-FU increases TGF-β release and signaling (44). We then compared the effects of TGF-β1 or a clinically relevant (2.5 µm) of 5-FU (45) on cultured intestinal fibroblasts. We observed that 5-FU reduced fibroblast proliferation but promoted the expression of Tgfb1, as well as several TGF-β target genes such as Pai1, Fap, and Acta2 (α-SMA) (Figure 4I). The effects of 5-FU on stromal cell activation were comparable to those of TGF-β1. 5-FU also enhanced the expression of the proangiogenic and proinflammatory cytokines Vegfa, Il1b, and Il6. IL-6 is an upstream regulator of JAK/STAT3 signaling, which was previously shown to sustain colon cancer cell survival and WNT activation (46, 47). In the tumors, 5-FU did not alter the expression of WNT target genes (Supplemental Figure 3F), but both cancer and stromal cells in 5-FU–treated APP tumors displayed increased nuclear accumulation of phosphorylated STAT3 (p-STAT3) (Supplemental Figure 3G). In summary, our results in both s.c. and autochthonous tumor models indicate that chemotherapy is highly effective in WNThiPROX1hi tumors. However, chemotherapy promotes TGF-β–dependent fibroblast activation and production of angiogenic and protumoral factors in PROX1lo desmoplastic tumors and is thus detrimental to the outcome. The PROX1 target gene Mmp14 induces tumor fibrosis and chemoresistance. PROX1 is a transcriptional repressor shown previously to directly repress annexin A1 (ANXA1) in Apc-deficient mouse intestinal stem cells (29) and matrix metalloproteinase 14 (MMP14) in human liver, colon, and breast cancer cell lines (48). Accordingly, the expression of both genes was increased in cultured Prox1-deficient organoids and tumors (Figure 5A). In human CRC subtypes, the highest MMP14 levels were observed in desmoplastic CMS4 tumors, whereas ANXA1 was prominent in both CMS1 and CMS4 tumors (Figure 5B). 5-FU further enhanced the expression of Mmp14 but not Anxa1 in Prox1-deficient organoids and tumors, along with expression of the profibrotic factors Tgfb1, Pdgfc, Hbegf, and Il1b (Figure 5C and Supplemental Figure 4, A and B). Figure 5 The PROX1 target MMP14 recapitulates tumor desmoplasia, angiogenesis, and chemoresistance. (A) Mmp14 and Anxa1 expression in organoids and tumors. qRT-PCR data were normalized to the AKP organoids or the mean of AP tumors. (B) MMP14 and ANXA1 expression in CRC CMS classification (GSE39582; n = 409). P < 0.001, by 1-way ANOVA with Tukey’s multiple comparisons test. (C) 5-FU effect on WNT targets and profibrotic factors. A heatmap of the indicated genes is shown (n = 3). (D) Tumor growth and weights after overexpression of MMP14 or ANXA1. Fifty MMP14-AKP, ANXA1-AKP, or control dlNGFR-AKP organoids were implanted s.c. per mouse (n = 6). (E) MMP14 overexpression promoted desmoplasia. Images in top row show Masson’s trichrome staining; images in bottom row show staining for PH3 (green), α-SMA (red), E-cadherin (white), and DNA (blue). Scale bars: 50 μm. (F) Quantification of stromal content, stromal and cancer cell proliferation, and vascular density in control and MMP14- or ANXA1-overexpressing tumors. Data are presented as the fold change versus the AKP control mean or versus the MMP14 mean for stromal proliferation. (G) MMP14-AKP tumors were chemoresistant. Mice were implanted s.c. with 50 control dlNGFR-AKP or 100 MMP14-AKP organoids (n = 8). 5-FU treatment was started when tumors reached 100 mm3 in size. (H) 5-FU effect on desmoplasia and stromal MMP14 expression in MMP14-AKP tumors. Quantification of α-SMA+ stromal area and MMP14+α-SMA+ coexpression in control dlNGFR-AKP and MMP14-AKP tumors. Data are presented as the fold change versus the AKP control mean. (I) 5-FU effect on angiogenesis in MMP14-AKP tumors. VE-cadherin+ vessel density is presented as the fold change versus the AKP control mean. (J) Effect of 5-FU on angiogenesis in MMP14-AKP tumors. Images show staining for VE-cadherin (green), α-SMA (red), E-cadherin (white), and DNA (blue). Scale bars: 50 μm. Data represent the mean ± SD. *P ≤ 0.05, **P ≤ 0.01, ***P ≤ 0.001, and ****P ≤ 0.0001, by Student’s t test (A) or 1-way ANOVA (scatterplots) or 2-way ANOVA (growth curves) with Tukey’s multiple comparisons test. D, dlNGFR; A, Annexin A1; M, MMP14. To investigate whether ANXA1 or MMP14 were implicated in inducing the desmoplastic phenotype of Prox1-deficient tumors, we generated Anxa1- or Mmp14-overexpressing AKP organoids (ANXA1-AKP and MMP14-AKP, respectively) and, as a control, organoids expressing a nonsignaling form of the low-affinity nerve growth factor receptor (dlNGFR-AKP) (Supplemental Figure 4C). Overexpression of either protein did not affect the growth of organoids in vitro or the expression of WNT target genes (Supplemental Figure 4C). Upon s.c. injection, ANXA1-AKP and control dlNGFR-AKP tumors had similar growth rates, however, MMP14-AKP tumors grew at a significantly slower rate (Figure 5D). Histological analysis revealed that overexpression of MMP14 was associated with stromal cell proliferation and expansion, prominent angiogenic response, and reduced cancer cell proliferation (Figure 5, E and F, and Supplemental Figure 4D). These results were further corroborated by mRNA analysis of stromal and angiogenesis markers (Supplemental Figure 4E). MMP14-AKP tumors lacked the central necrosis observed in AKPP tumors and displayed no change in WNT signaling (Supplemental Figure 4E), indicating partial phenocopying of Prox1-deficient tumors. We next examined whether MMP14 overexpression was sufficient to confer tumor resistance to chemotherapy. 5-FU arrested the growth of control tumors but had no inhibitory effects on MMP14-AKP tumors (Figure 5G). Similar to the results in AKPP tumors, 5-FU did not affect cancer cell proliferation and further increased fibrosis and angiogenesis in MMP14-AKP tumors (Figure 5, H–J, and Supplemental Figure 4F). We also observed that transgenic MMP14 in cancer cells induced endogenous MMP14 expression in stromal cells, an effect that was heightened by chemotherapy (Figure 5H and Supplemental Figure 4G). Together, these results suggest that tumor desmoplasia, angiogenesis, and resistance to chemotherapy induced by loss of Prox1 are mediated through the derepression of its direct target MMP14. Reprogramming the angiogenic and immune microenvironment restrains the growth of chemoresistant Prox1-deficient tumors. The aforementioned data indicate that chemoresistance of APP tumors is associated with a highly angiogenic and T cell–excluded desmoplastic microenvironment. This prompted us to pursue reprogramming of the TME as an alternative therapeutic strategy. Previous studies have shown that anticancer immunity can be efficiently triggered through the activation of CD40 in desmoplastic pancreatic ductal adenocarcinoma (20, 21). We then used a murinized version of A2V to block both VEGFA and ANGPT2 (49) (17) in combination with FGK4.5, an agonistic CD40 (aCD40) antibody (50), in genetic models of CRC. We started the treatments 2 weeks after tumor initiation and terminated the experiments 2 weeks later (Figure 6A). Treatment with aCD40 had a minor, if any, effect on tumor growth in either model, whereas A2V had a measurable growth-inhibitory effect on AP but not APP tumors. In contrast, the combination of A2V and aCD40 inhibited the growth of both AP and APP tumors (Figure 6A). Further microscopic analysis revealed cancer cell death and an accumulation of p-γH2A.X+ nuclear foci specifically in tumors treated with the A2V+aCD40 combination (Figure 6, B and C, and Supplemental Figure 5, A and B). Similarly, cancer cell proliferation was significantly reduced only by the combination treatment in both models (Figures 6C). Together, these results demonstrate that the combination of A2V and aCD40 had marked antitumoral activity in both AP and chemoresistant APP models. Figure 6 A2V+aCD40 combination reduces AP and APP tumor growth. (A) Treatment scheme and weights of tumors in the indicated conditions. AP IgGs, AP A2V, or AP A2V+aCD40, n = 10; AP aCD40, n = 8; APP IgGs, APP A2V or APP A2V+aCD40, n = 7; APP aCD40, n = 6. (B) A2V+aCD40 induced tumor necrosis and stromal destruction. Images show staining for E-cadherin (white), PH3 (green), and α-SMA (red). Scale bars: 50 μm. (C) Quantification of tumor necrosis and proliferation. Necrosis is indicated by the percentage of necrotic glands. Proliferation was quantified by PH3+E-cadherin+ tumor cells normalized to total E-cadherin+ and the AP IgGs mean. (D) A2V and A2V+aCD40 promoted vascular maturation. Images show staining for CD31 (green) and α-SMA (red). Scale bars: 50 μm. (E) Quantification of vessel density, mural coverage, and vessel caliber. Data were normalized to the AP IgGs mean. (F) A2V and A2V+aCD40 reduced desmoplasia. The α-SMA+ stromal area was normalized to the corresponding tumor area and the AP IgGs mean. (G) A2V and A2V+aCD40 effects on stromal proliferation and Mmp14 mRNA. Quantification of PH3+α-SMA+ fibroblasts per tumor area and qRT-PCR for Mmp14 in tumor lysates. Data were normalized to the AP IgGs mean. (H) A2V+aCD40 promoted CD8+ T cells intraepithelial infiltration. Images show staining for CD8a (green), VE-cadherin (red), and E-cadherin (white). Scale bars: 50 μm. (I) CD8+/CD4+ TIL ratio and intraepithelial CD8+ T cell quantification were determined as the fold change versus the AP IgGs mean. (J) A2V+aCD40 increased GZMB+ cytotoxic CD8+ T cells. Intratumoral CD8+GRZB+ T cells were normalized to CD8+ T cells and the AP IgGs mean. (K) A2V and A2V+aCD40 reduced Tregs. Images show staining for Foxp3 (green), CD4 (red), and E-cadherin (white). Scale bars: 50 μm. (L) Quantification of Tregs and CD8+/Treg ratio. CD4+Foxp3+ expression was normalized to CD4+ T cells and the AP IgGs mean. (M) Pathways deregulated by A2V+aCD40, AP A2V+aCD40, or APP A2V+aCD40, n = 4; AP or APP controls, n = 6. FDR <0.05. NES, normalized enrichment scores. Data represent the mean ± SD. *P ≤ 0.05, **P ≤ 0.01, ***P ≤ 0.001, and ****P ≤ 0.0001, by 1-way ANOVA with Tukey’s multiple comparisons test. Combined A2V and aCD40 antibody therapy normalizes tumor blood vessels and reduces fibrosis. We next examined the effects of treatments on tumoral vascular density, vessel caliber, mural cell coverage, tumor hypoxia, and CAF activation and proliferation. A2V did not alter the relatively sparse vascular network of AP tumors, whereas it pruned the angiogenic vasculature of APP tumors (Figure 6, D and E). In both tumor models, A2V and the combined treatment, but not aCD40 monotherapy, enhanced blood vessel coverage by α-SMA+ mural cells and increased the caliber of the remaining blood vessels. To evaluate vascular functionality, we analyzed tumor hypoxia by staining for pimonidazole adducts. We found low levels of hypoxia in control AP and APP tumors, which were not modified by the treatment (Supplemental Figure 5, C and D). These data indicate that AP and APP tumors were well perfused at baseline and that the main effect of A2V in these models was the promotion of vascular maturation. In APP tumors, aCD40 monotherapy did not obviously alter the tumor stroma, whereas A2V reduced stromal cell content and the expression of the activation marker α-SMA in CAFs and myofibroblasts (Figure 6, B and F) as well as of the CAF markers and TGF-β target genes Fap, Ctgf, and Pai1 (Supplemental Figure 6A), indicating that A2V limits stromal activation in this model. A2V+aCD40 also downregulated Mmp14 expression and promoted even greater destruction of the stroma, compared with A2V monotherapy in the desmoplastic APP tumors, as shown by both reduced stromal cell proliferation and content (Figure 6, B and G). Altogether, these results demonstrate that dual blockade of VEGFA and ANGPT2, especially in combination with aCD40, normalizes tumor blood vessels and reduces tumor fibrosis. Combined A2V and aCD40 antibody therapy promotes intraepithelial infiltration of cytotoxic CD8+ T cells. We next analyzed tumor-infiltrating lymphocytes (TILs). Although neither monotherapy had significant effects on the total number of intratumoral CD8+ or CD4+ T cells (Supplemental Figure 6B), we found that A2V+aCD40 promoted the influx of CD8+ T cells and increased the CD8/CD4 ratio in APP tumors (Figure 6, H and I, and Supplemental Figure 6B). Engagement of CD8+ T cells with epithelial cells is strongly associated with a favorable prognosis in CRC (51). We therefore characterized the spatial distribution of T cells within tumors. A2V+aCD40 markedly induced intraepithelial infiltration of CD8+ T cells into both AP and APP tumors (Figure 6, H and I). Most important, the combined treatment dramatically increased the proportion of granzyme B+ (GZMB+) CD8+ T cells, which is indicative of an activated cytotoxic phenotype, in APP tumors; a similar but less marked response was observed in AP tumors (Figures 6J and Supplemental Figure 6C). Tregs suppress effector T cells, and a high CD8+/Treg cell ratio is generally associated with a favorable prognosis in solid cancers (52). In both tumor models, A2V strongly reduced the abundance of intratumoral CD4+Foxp3+ Tregs, resulting in a significantly higher CD8+/Treg ratio, an effect that was maintained in the A2V+aCD40 group (Figure 6, K and L). We further analyzed genome-wide transcriptional responses of tumors to A2V+aCD40 treatment using gene set enrichment analysis (GSEA) (53). The most prominent pathways activated by A2V+aCD40 in AP and APP tumors were related to allograft rejection and IFN signaling (Figure 6M), thus confirming the ability of A2V+aCD40 to convert the immunologically “cold-phenotype” AP and APP tumors into a highly inflamed state that was potentially conducive to an efficient anticancer immune response. Surprisingly, using signatures for mouse immune cell populations (54), we found that, together with the expected increase in DC and T cell signatures, A2V+aCD40 treatment also led to enrichment of B cell–associated transcripts, whereas the macrophage signature was not affected (Supplemental Figure 6D). Therefore, we analyzed the distribution of intratumoral B cells by staining B220 in control (IgG-treated) tumors compared with treated tumors. We observed few and sparse B cells in both control- and aCD40-treated tumors. Interestingly, we found an increased incidence of large peri- and intratumoral B cell clusters in A2V- and A2V+aCD40-treated tumors (Supplemental Figure 6, E–G). Such clusters harbored both B and T cells and contained HEV-like vessels lined with plump ECs (Supplemental Figure 6G). These results demonstrate that A2V promoted the generation of tertiary lymphoid structures (TLSs), which are nonencapsulated immune cell aggregates that are associated with productive antitumor immunity and a favorable prognosis in many cancer types, including CRC (55). Taken together, our results demonstrate that A2V profoundly reprogrammed the TME in mouse models of CRC and potentiated immune activation in response to aCD40 signaling. The antitumoral activity of A2V+aCD40 is T cell and ANGPT2 dependent. Agonistic CD40 antibodies activate antigen-presenting cells and promote antitumoral, T cell–dependent responses. They also induce tumoricidal macrophages that were shown to control tumors by promoting tumor stroma destruction in the absence of T cell immunity (20, 56, 57). We then asked whether the antitumoral activity of A2V+aCD40 is T cell dependent. To this aim, we induced concomitant depletion of T cells using α-CD8a and α-CD4 antibodies (Figure 7A). We achieved efficient T cell ablation from tumors, as determined by staining of tumor sections with noncompeting α-CD8 and α-CD4 antibodies, or by FACS analysis of draining lymph nodes using α-CD3 (Figures 7A and Supplemental Figure 7A). Because A2V+aCD40 in combination with T cell elimination was poorly tolerated, the mice had to be euthanized after a short treatment window, with only modest effects on tumor growth observed (Figures 7A and Supplemental Figure 7, B and C). Figure 7 A2V+aCD40 antitumor activity is T cell dependent. (A) Tumors were treated with control mAbs, A2V+aCD40, or A2V+aCD40+α-CD8+α-CD4. Quantification of intratumoral T cells was determined by the fold change versus the AP IgGs mean. AP IgGs, n = 8; AP A2V+aCD40 AP A2V+aCD40+αCD8+αCD4 or APP A2V+aCD40, n = 9; APP IgGs, n = 10; APP A2V+aCD40+αCD8+αCD4, n = 7. (B) FACS analysis of lymph node CD11b+CD11c+CD86+ DCs and CD11b–B220–MHCII–CD8+ T cells and splenic CD11b–B220–MHCII–CD8a+CD44+CD62l+ Tm cells. (C) Quantification of intratumoral cytotoxicity. Quantification of CD11b–CD3+CD8a+IFN-γ+ and GZMB+ T cells, percentage of CD45+ cells, and qRT-PCR analysis of Prf1 and Gzma expression, normalized to the AP of IgGs mean. (D) T cells mediated cancer cell death in A2V+aCD40-treated tumors. Cell death was determined by the percentage of necrotic glands. PH3+E-cadherin+ cells were normalized to the AP IgGs mean. (E) Effect of T cell depletion on tumor cell death and stroma. Images show staining for PH3 (green), α-SMA (red), E-cadherin (white), and DNA (blue). Scale bars: 50 μm. (F) Quantification of vessel density and mural coverage. Data were normalized to the AP IgGs mean. (G) A2V+aCD40 reduced stromal content after T cell depletion. Quantification of stromal content and proliferation is shown, and data were normalized to the AP IgGs mean. (H) Comparison of A2V+aCD40 versus A2V+B20 combination treatment. Images show staining for CD8a (green), VE-cadherin (red), E-cadherin (white), and DNA (blue). AP IgGs, n = 10; AP B20+aCD40 or AP A2V+aCD40, n = 11; APP IgGs or APP B20+aCD40, n = 8; APP A2V+aCD40, n = 9. Scale bars: 50 μm. (I) Quantification of CD8+ T cell infiltration and cell death. Cell death was determined by the percentage of necrotic tumor glands. CD8a+ T cell infiltration was determined by the fold change versus the AP IgGs mean. (J) PROX1hi tumors display high WNT signaling, a small amount of stroma, and are chemosensitive. Low PROX1 levels blunt WNT activation and promote tumor desmoplasia, angiogenesis, and chemoresistance. A2V+aCD40 normalizes the tumor vasculature, reduces Treg numbers, expands TLSs, and induces antitumor responses. Data represent the mean ± SD. *P ≤ 0.05, **P ≤ 0.01, ***P ≤ 0.001, and ****P ≤ 0.0001, by 1-way ANOVA with Tukey’s multiple comparisons test. Comb., combination; Tdepl., T cell depletion. Analysis of draining lymph nodes confirmed that A2V+aCD40 activated DCs, as determined by increased expression of the costimulatory receptor CD86, and promoted the accumulation of CD8+ T cells in both tumor models (Figure 7B). We also observed an expansion of splenic CD8+CD44+CD62l+ memory T (Tm) cells, suggestive of long-lasting effector function. In addition to increasing the number of intraepithelial CD8+ T cells, A2V+aCD40 enhanced the accumulation of CD8+ IFN-γ+GZMB+ CTLs and increased the expression of the CTL markers perforin (Prf1) and granzyme A (Gzma) in the tumors. As expected, T cell elimination abated expression of the T cell response markers (Figure 7C and Supplemental Figure 7, D–F). Most important, T cell elimination fully rescued cancer cell proliferation and abolished cell death in response to A2V+aCD40 (Figure 7, D and E). Loss of T cells did not alter the changes in vascular pruning or caliber or the mural coverage of APP tumors in response to A2V+aCD40 (Figure 7F and Supplemental Figure 7G), indicating that TILs do not mediate A2V-induced vascular normalization. Finally, the attrition of tumor stroma induced by A2V+aCD40, as analyzed by staining for α-SMA and expression of the TGF-β targets Pai1 and Ctgf, was also largely T cell independent (Figure 7G and Supplemental Figure 7H). Overall, our results indicate that the antitumoral activity of A2V+aCD40 is mostly mediated by T cells in genetic mouse models of MSS CRC, although additional mechanisms must be involved in therapy-induced stromal remodeling and destruction. Finally, we gauged the requirement of ANGPT2 blockade for A2V+aCD40 therapeutic efficacy. We used B20, a VEGFA-blocking antibody equivalent to bevacizumab (58). A2V+aCD40 but not B20+aCD40 promoted infiltration of intratumoral CD8+ T cells and induced significant cell death in size-matched AP and APP tumors (Figure 7, H and I). Although no differences were found in blood vessel density (data not shown), only A2V+aCD40 increased blood vessel caliber (indicative of normalization) and depleted the tumor stroma (Supplemental Figure 7I). These results indicate that double blockade of ANGP2 and VEGFA is more efficient in promoting immune activation and cancer cell destruction. Overall, our results present a model in which vascular normalization by A2V prevents the accumulation of immunosuppressive Tregs and facilitates the formation of TLSs, which may function as additional sites of naive T cell infiltration and T cell priming (55). Although such effects were not sufficient to induce significant cancer cell killing per se, the combination with a CD40 agonist enabled antigen-presenting cell activation and the destruction of cancer cells by CTLs (Figure 7J).
|