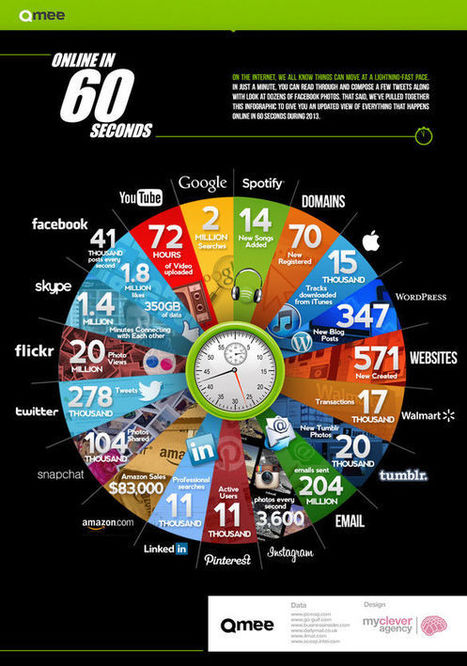
Early last year we learned that one hour of YouTube is uploaded every second. It was a bracing reminder of just how many people are spending their time online simultaneously.
Created by rewards site Qmee, the infographic "Online In 60 Seconds" is a pie chart that shows off the sheer amount of online activity that takes place every single minute. The amount of YouTube videos uploaded has already increased from January 2012's 60 hours per minute to 72. Additionally, over 1.8 million things are liked on Facebook, and 278 thousand bon mots tweeted. Not depicted in the chart: the amount of work that is going undone while all of these items are being viewed.
I've had a great time preparing my formative assessment infographic to show ideas for assessment with and without the aide of technology. Do you have ideas for formative assessment? Please share in...
Mapmaker Max Roberts has created a new way to map out subway lines. Conventional maps usually emphasize “straight lines, clean angles and geographical accuracy”. Unlike those maps, Roberts’ circular design is a blend of “aesthetics and usability”.
Roberts discovered this “completely new way of designing maps” when he was designing a map for the London Underground that took into account the circular nature of the Orbital rail link. He realized the potential of the new design in forcing “cities into an unprecedented level of organization” and the coherence achieved. Sacrificing geographical accuracy, his schematic design shows how elements in the map relate to each other logically, while taming the web of criss-crossed lines usually found in subway maps.
View maps of the New York City Subway, the London Underground and the Paris Metro at the article link, or head over to hiswebsite to see more circular maps of other cities.
You might have known already that a responsive web design is a mobile-friendly format. Meaning, once your website is accessed from any mobile design...
If your business has difficult business problem solving situations, you will be interested in the design thinking process we will introduce in this article.
In late May, French artist Mademoiselle Maurice created three colorful origami installations in Angers, France for the ARTAQ 2013 festival. The large-scale outdoor installations were made from 30,000 pieces of origami made by the people of Angers in the months before the festival.
The Saint-Maurice cathedral was adorned with two installations—a geometric pattern on the front gate and a rainbow of origami on the front steps. A third installation, a massive origami mural, was placed on the banks of the Maine river...
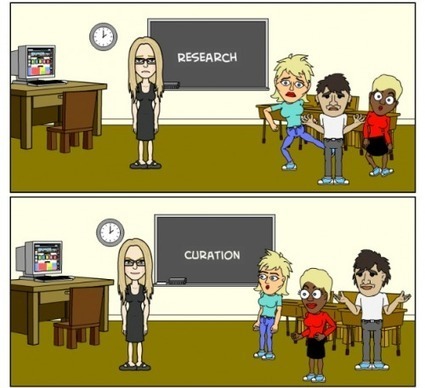
I wanted students to be able to funnel their interests into a more authentic academic experience so that they could learn about what they want to learn about and become empowered as researchers, both casually and formally.
Today, around the world more people have mobile phone subscriptions than have access to electricity and safe drinkable water. Today, almost a third of the world's population uses the internet (a 528.1% growth since 2000!
So what are we doing with all the time we spend online, and how do we know all that time is being spent in useful ways?
For many of us, the internet is among the first things we experience after we wake; in fact, 75% of users are online before 9 a.m. Over 75% of people in the US own a laptop, 53% a smart phone, and 31% a tablet. Email is the most common action performed by people on their laptops, while search is the top action for mobile phone and tablet users. 72% of people like to play games on their tablets while 70% use their mobile phones for social media. Where do we use these devices? 72% of people use their mobile phones while traveling, and 64% use them in restaurants and coffee shops. As for tablets, 88% of people use their devices in the living room, 79% in the bedroom.
Find more statistics and data at the infographic or article link.
Una semplice e chiara infografica sullo stato dei fatti degli utilizzatori di internet al giorno d'oggi, meno del 10% degli account umani/reali utilizza facebook, beh allora ci stiamo evolvendo sul serio ;)
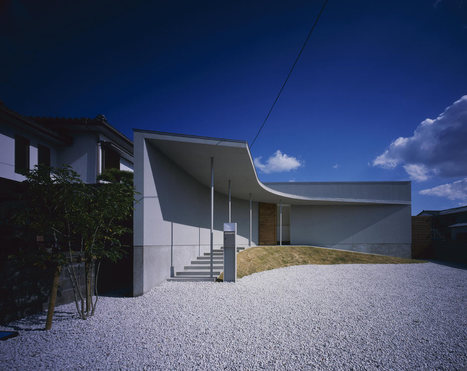
A minimalist house with a curved exterior that provides privacy, security, natural light and air circulation, and plenty of space for children to play.
Osaka-based architect Naoko Horibe was given a tall order when she set out to design this residence in Naruto-Shi, Tokushima, Japan. First, the property is located in an area that tends to flood during heavy rains. Second, the clients wanted their new home to provide security and privacy, while at the same time having enough space for their children. And last, but not least, they asked for the house to have good natural light and air circulation throughout.
To work around the potential flooding situation, the foundation and floor were built fairly high. The house itself is designed such that the rooms are built around a central courtyard. The rooms loop together and create a path for the kids to run around.
The courtyard helps bring light into the interior, helping to achieve one of the clients’ requests. It also helps with air circulation.
Watch what happens when Heineken asked travelers at JFK to take a leap of faith and change their flight destination with the "departure roulette" board.
Social-media platforms like FourSquare and Twitter have been a boon for sociologists and geographers who now have entirely new ways of tracking how we move through cities, where we go, who we are, and even what we think of the world around us. There is one set of social-media platforms, however, that has been tougher to crack for useful data than others: photo-sharing sites.
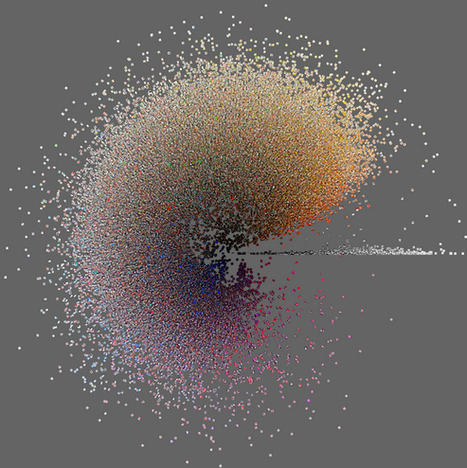
Their metadata can illustrate where people take photos, and how active they are. But on the whole, how do you aggregate useful data about entire cities and the differences between them from the content of millions of photos on a site like Instagram?
Researchers have been working on this for the past year, and they've just posted some of the initial results from their Phototrails project here.The project is less an exploration of a specific research question, and more a first foray into what we might learn by treating user-generated photography as another source of Big Data.
Designing an interesting and intriguing magazine covers design is one of the toughest challenges. It should be such that it turns heads and the prospective readers take the initiative to pick it up from the book rack amidst the many option presents before the readers.
The Avengers dazzled us with the airborne Helicarrier — but if some visionary designers had had their way, we could have had airplanes landing on structures high in the air. Airports raised above cities, airports floating on the water... the 20th century had many schemes, but no success. Check out some of the wildest concept art.
If we get back to the origin, the mindmaps come from our brains (the two ones we all have, I refer to our both hemispheres) and how they proccess the information they have got.
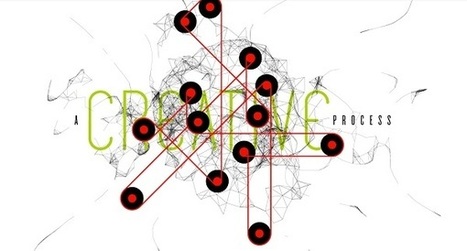
Toronto-based designer Scott Wise has illustrated the ‘creative process’—imagining it as abstract illustrations.
In the series, the elements commonly-known to those in the creative industry—‘core idea’, ‘brainstorm’, ‘ideation’, ‘iteration’, ‘refinement’, and ‘feedback loop’—are visually summarized.
Social media is, at its best, an extension of the human relationship and an opportunity to look customers in the eye (digitally, that is), listen to them and interact person to person. This is the first time in history that small businesses have had the potential to build a massive fan base without a Fortune 500 budget.
The social Web is changing the way consumers discover and interact with businesses online and off and the rapid emergence of social media as a major marketing channel has left many small businesses trying to understand how to find ways to use it effectively. Refer to this infographic to help develop a strategy that suits your business.
Social Media is a powerful tool for small businesses and startups to market themselves with the right intent. It's easy, effective and the fastest way to approach the intended customer base.
e-David, our painting machine, uses visual feedback to create different kinds of paintings. We equipped a standard robot with all necessary means for painting. Five…
Sei Grande Robin, Grande e Innovativa la news, molto interessante. Grazie, ho cominciato a scoprirla da subito... sarebbe bene che nel campus se ne parlasse (a mio parere). Ciao Buonissima Domenica
To get content containing either thought or leadership enter:
To get content containing both thought and leadership enter:
To get content containing the expression thought leadership enter:
You can enter several keywords and you can refine them whenever you want. Our suggestion engine uses more signals but entering a few keywords here will rapidly give you great content to curate.


 Your new post is loading...



















Single Chart Infograph:
Like: Good visual, good data.
Dislike: Can be a little overwhelming to look at.