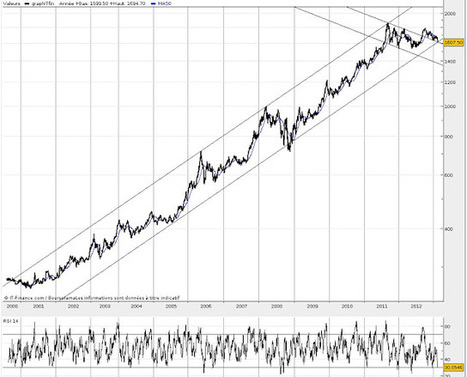

Since 2001, Gold has been behaving very nicely and stayed in a narrow range in its logarithmic chart. So If Gold has gone down for an extended period of time and suddenly drop at level not seen for a while, or alternatively if it has gone up for a long time, and makes new highs, I like to have a look at the logarithmic chart since the bull market started in 2001,...


 Your new post is loading...