 Your new post is loading...

|
Scooped by
Mickael Ruau
November 19, 2019 5:35 AM
|
You don’t have to wait until your multi-vari data are collected to start creating the multi-vari chart for Six Sigma. Instead, you can build the chart, incrementally, adding more to it as you collect more data. Multi-vari charts can be drawn by hand; in fact, the process operators themselves can create them, providing those folks …
|
|
Scooped by
Mickael Ruau
November 19, 2019 5:13 AM
|
La matrice de décision est un outil simple efficace pour nous aider à prendre les bonnes décisions.
|
|
Scooped by
Mickael Ruau
November 19, 2019 4:13 AM
|
Le Lean peut-il être utilisé pour redresser une situation ? Une situation calamiteuse rend elle sa mise en œuvre plus simple ou plus complexe ?
|
|
Scooped by
Mickael Ruau
November 19, 2019 4:05 AM
|
Six Sigma has tools that promote good decision making, which leads to performance improvements that reduce rework and drive benefits to the bottom line faster.
|
|
Scooped by
Mickael Ruau
November 19, 2019 4:01 AM
|
Series of posts on Hoshin Kanri (Policy Deployment). This post shows a western "improvement" on Hoshin Kanri: the X-Matrix, which in my view makes things worse. This article is a critical review of the X Matrix.
|
|
Scooped by
Mickael Ruau
November 7, 2019 8:28 AM
|
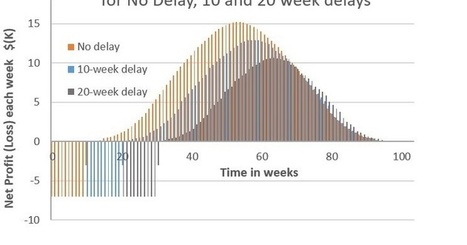
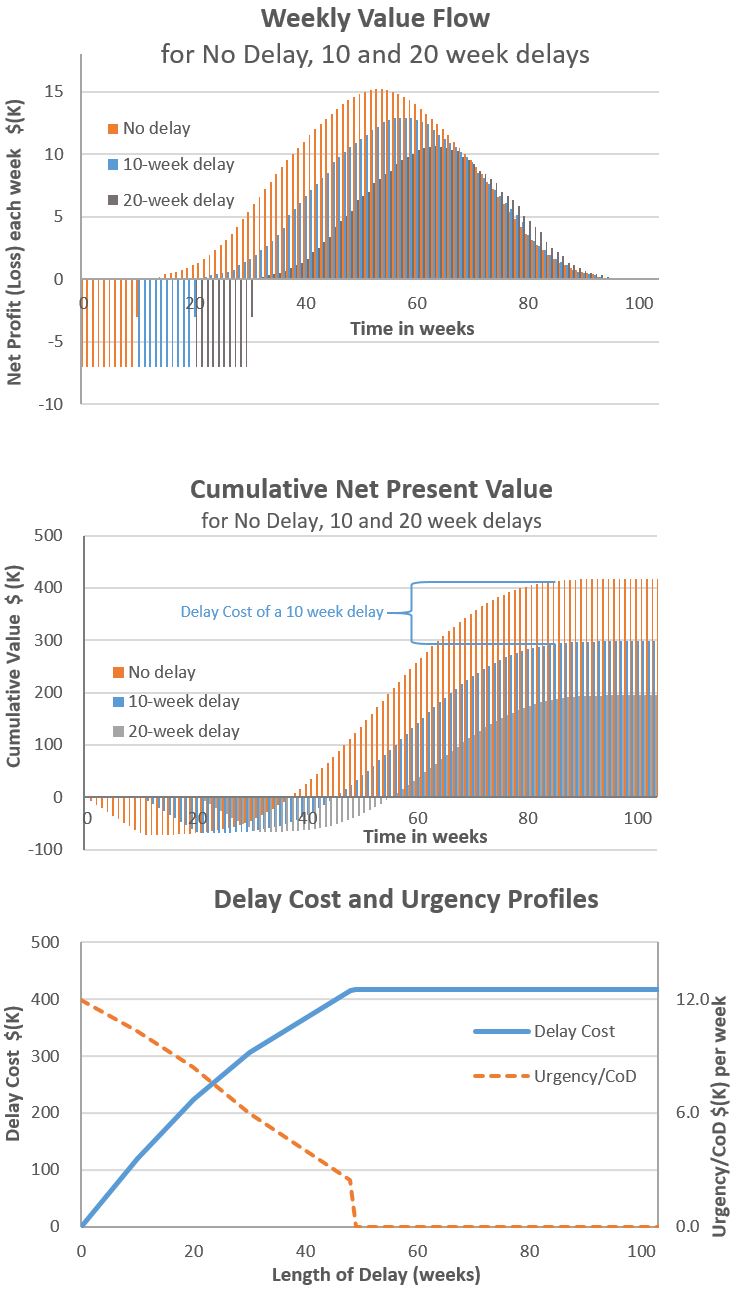
Value Flow, Cumulative Value, Delay Cost
and Urgency for time-sensitive feature (click on image for more detail) - the value flow (net benefits, positive and negative) each week through the useful life of the proposal, for a given release date
- the change in cumulative value (Net Present Value, NPV, or life-time profits) as a function of time, for a given release date
- the Delay Cost Profile - how much business value is lost as a function of the delay
- the Urgency Profile (the rate at which value is lost as a function of the delay)
Note: The terms Cost of Delay ( CoD), Class of Service, Delay Cost, Lead Time, NPV, work item and Urgency, as well as over 60 commonly used terms in Kanban and Lean are defined in the Kanban Glossary in Essential Kanban Condensed [2] (currently available as a free download).
|
|
Scooped by
Mickael Ruau
November 7, 2019 6:03 AM
|
With the traditional approach to budgeting, delays often take place and opportunities are lost. A lean budgeting provides a better solution to this.
|
|
Scooped by
Mickael Ruau
November 5, 2019 4:31 AM
|
Ce premier article d’une série de trois qui a pour objectif de démontrer que le LEAN est un moyen de résolution de problème mais surtout d’apprentissage pour les équipes et leurs entreprises en se concentrant sur les personnes qui ont un impact sur la valeur livrée aux clients / utilisateurs. Pour cela la réponse du LEAN est le PDCA. Outil très connu mais souvent mal utilisé car les personnes réalisent plusieurs actions en parallèle et ne sont pas capable de connaitre leurs effets car elles ne prennent pas le temps de poser le problème concrètement et qu’elles ne mesurent pas. Par conséquence elles n’apprennent pas de leurs erreurs. Nous verrons que l’objectif est de se concentrer sur l’humain pour rendre les équipes autonomes dans la résolution de problème mais également afin lier une hiérarchie bien souvent éloignée des opérationnels. Si vous n’avez pas le temps de tout lire je vous propose d’aller à la fin de l’article pour prendre quelques take away.
|
|
Scooped by
Mickael Ruau
October 31, 2019 8:56 AM
|
Managing change requires good planing, and flexible execution. But more importantly, getting people to understand and accept the change.
|
|
Scooped by
Mickael Ruau
October 26, 2019 3:58 AM
|
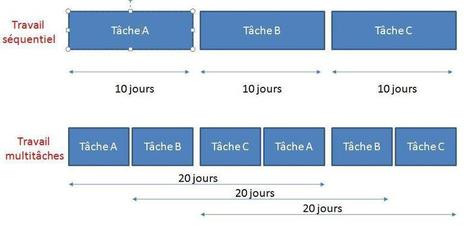
NDLR: WIP = Work in Progress = TEC = Travaux en cours Mes collègues peuvent facilement m'accuser de ressasser sans cesse la même vieille rengaine. "Il y a trop de travaux en cours! Réduisez votre WIP!" C'est normal, puisque j'accompagne principalement des équipes qui n'ont jamais eu de mesure de contrôle des travaux en cours.
|
|
Scooped by
Mickael Ruau
October 25, 2019 9:56 AM
|
Bien que ces formules soient intuitives, c'est un résultat tout à fait remarquable. Et c'est le théorème principal dans la Théorie des files d'attente, qui est également connu sous le nom de Loi de Little (décrite par John Little en 1961) :
Le nombre moyen d'éléments de travail dans un système stable est égal à leur délai moyen d'exécution, multiplié par leur temps moyen passé dans le système.
|
|
Scooped by
Mickael Ruau
October 25, 2019 9:53 AM
|
La théorie des files d'attente est une théorie mathématique relevant du domaine des probabilités, qui étudie les solutions optimales de gestion des files d'attente, ou queues. Une queue est nécessaire et se créera d'elle-même si ce n'est pas anticipé, dans tous les cas où l'offre est inférieure à la demande, même temporairement.
|
|
Scooped by
Mickael Ruau
October 25, 2019 5:54 AM
|
Lean thinking as a philosophy is made up of a set of general principles and values. These values can then be applied using tried-and-true tools and techniques depending on what an organization (or individual manager) is trying to achieve. These principles are the pillars of lean practices like lean startup, lean UX and lean software development: - Specify value from the user’s point of view. Value is defined as what the customer is willing to pay for. Development teams find this value using qualitative and quantitative research.
- Map the value stream. Once that “value” has been defined and turned into a tangible goal for the team to chase, the next step is to map all the current steps that go into conceptualizing and delivering a feature or update. By using a flowchart, teams can analyze and improve their delivery process by spotting bottlenecks, pain points and delays.
- Create flow. The process of spotting and smoothing out those bottlenecks and pain points is called flow improvement. By visualizing and optimizing the internal process of delivery, teams can deliver features much more quickly.
- Establish pull. Once the flow is established, the team will only work on initiatives once customer need for it is established—instead of relying too much on market and competition forecasts.
- Seek perfection: At this stage, value has been defined, value streams have been mapped out, steps that are considered wasteful have been removed, and flow and pull systems are in place. To seek perfection means to repeat this process multiple times until the best possible value is defined without any waste.
|
|
|
Scooped by
Mickael Ruau
November 19, 2019 5:34 AM
|
tool that graphically displays patterns of variation. It is used to identify possible Xs or families of variation, such as variation within a subgroup, between subgroups, or over time.
|
|
Scooped by
Mickael Ruau
November 19, 2019 4:21 AM
|
Obeyas et A3 peuvent être vus comme des outils pour porter le changement d’attitude, et passer d’un management par la pression sur les résultats à un management par l’orientation client.
|
|
Scooped by
Mickael Ruau
November 19, 2019 4:08 AM
|
Besides Pugh Matrix and Decision matrix, it is also known by the name such as Grid Analysis, Pugh Matrix Analysis, and Multi-Attribute Utility Theory)
|
|
Scooped by
Mickael Ruau
November 19, 2019 4:02 AM
|
Pour améliorer un processus, il faut en retirer les défauts. L'idéal serait d'avoir l'équivalent d'une "salle blanche"… sans poussière. Comment détecter et corriger les défauts ?
De nombreux outils existent pour cela : la matrice d'auto-qualité sert à identifier les défauts et à "visualiser" de manière simple leur coût. Cette matrice comporte autant de colonnes que de défauts recensés, et autant de lignes que d'étapes du processus. Voici un exemple :
|
|
Scooped by
Mickael Ruau
November 8, 2019 8:52 AM
|
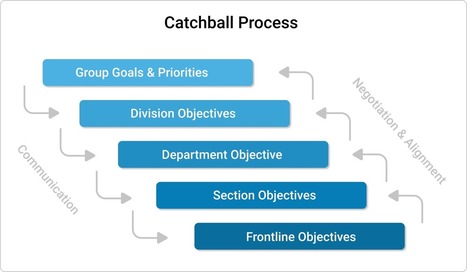
Catchball is one of the simplest and most effective ways to achieve continuous improvement in your organization. Learn how it works and how to start applying it
|
|
Scooped by
Mickael Ruau
November 7, 2019 8:23 AM
|
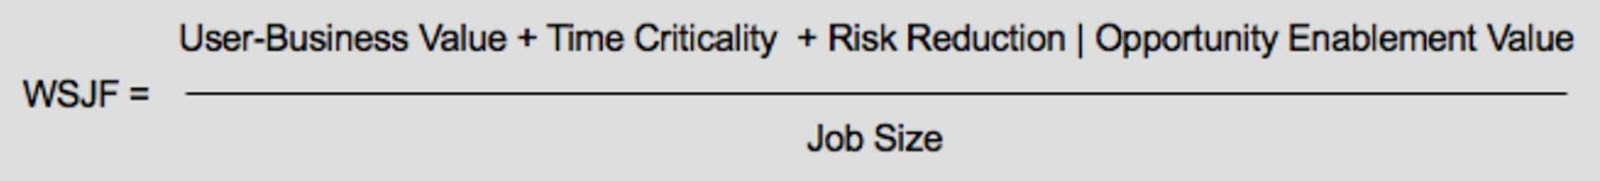
The SAFe definition of WSJF is something of a hybrid, since it uses a formula, but a formula that has only "qualitative" value at best. Here is their definition [5]:
The 4 terms are determined by Planning Poker estimation using a Fibonacci scale (usually 1 to 20). The work items are ordered according to the formula following an estimation workshop. (...)
Why can't the above formula provide meaningful answers? For 2 reasons: - Dimensionally the formula is inconsistent
- The terms are not estimated on a proportional scale
These problems were addressed in Joshua Arnold's proposed modification to the formula [4] which rearranged the terms as follows:
"WSJF" = Time Criticality x (User-Business Value + Risk Reduction | Opportunity Enablement) / Size
|
|
Scooped by
Mickael Ruau
November 5, 2019 4:32 AM
|
Après mon premier article « vendre la peau de l’ours avant de l’avoir tué » dans lequel je vous ai présenté le LEAN, voici le deuxième article qui vous permettra, cette fois-ci, de comprendre comment le LEAN peut être utile dans un contexte IT. Effectivement le mindset (on peut parler de mindset plus que de méthode) est moins connu en IT que d’autres méthodes qui s’en inspirent. Pourquoi peut-on parler de mindset plus que de méthode ? Car il a été créé dans l’objectif d’améliorer la satisfaction du client final / utilisateur sans réel process type à suivre. Certains adeptes du LEAN appellent cet objectif l’étoile du Nord car il est à l’image des navigateurs perdus dans l’océan, sans autre indication que ce repère pour naviguer. C’est une des raisons qui explique que le LEAN est mal compris, donc mal mis en oeuvre et par voie de conséquence n’apporte pas les résultats espérés.
|
|
Scooped by
Mickael Ruau
October 31, 2019 11:29 AM
|
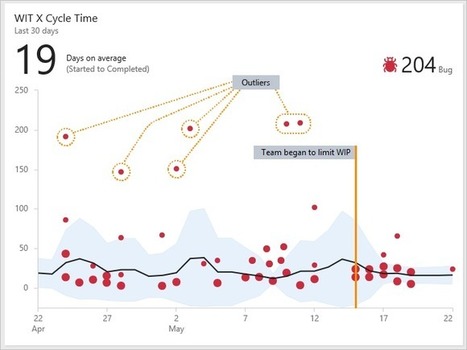
Process guidance to work with cumulative flow diagrams
|
|
Scooped by
Mickael Ruau
October 26, 2019 9:50 AM
|
Site personnel de Christian HOHMANN
|
|
Scooped by
Mickael Ruau
October 25, 2019 10:01 AM
|
La théorie des files d’attente est une branche des probabilités modélisant les temps d’arrivée, de traitement, les problèmes de congestion etc dans les files d’attente ou queues. L’ingénierie réseaux et plus tard la gestion de production industrielle se sont rapidement emparées des principaux résultats de cette discipline pour améliorer leur efficacité. Plus récemment, des activités de services tels que la gestion des guichets de banques ou les urgences hospitalières ont elles aussi bénéficié d’une étude de ce domaine. Une démarche scientiste consisterait à plaquer aveuglément des équations mathématiques sur l’univers organique et infiniment complexe du SI. Dans notre cas, on étudiera certains résultats de la théorie des files d’attente comme source d’inspiration dans notre démarche d’amélioration continue, en gardant à l’esprit les limites de ces modèles mathématiques.
|
|
Scooped by
Mickael Ruau
October 25, 2019 9:55 AM
|
Cette loi permet d'estimer le temps qu'une personne passe au service (guichet). Dans cette loi, on peut clairement identifier que est le nombre de clients servis par unité de temps et donc que est le temps moyen que passe un client au guichet.
|
|
Scooped by
Mickael Ruau
October 25, 2019 9:52 AM
|
Billet posté par BLUE LEAN CONSULTING sur la Loi de Little et son interprétation en production (en-cours et taille de lot) et en gestion de projet.
|


Interpreting a multi-vari chart
To determine which category of input variable drives the performance of your process output, all you have to do is graphically decide which of the three types of variation — positional, cyclical, or temporal — displays the greatest magnitude of variation in your multi-vari chart. You can compare the variation types by homing in on each one separately.
The vertical range of the positional variation — indicated by the height of the gray boxes— graphically depicts the magnitude of the process variation stemming from positional input factors.
The vertical range between the unit averages — indicated by the height of the gray boxes — graphically depicts the magnitude of variation coming from cyclical factors.
The vertical range between the temporal averages — shown again by the height of the gray box — graphically highlights the magnitude of the variation coming from temporal factors. Temporal factors are those that only change their input value across larger gaps of time but not within single units and not between consecutive units.
You can see that the vertical magnitude of the cyclical variation exceeds that for the positional or temporal categories. That result is the voice of the process telling you that the real root cause of your process performance is associated with some factor whose input value changes between production or creation of consecutive units.
The multi-vari chart proves that all other factors that change input value within single units or change input value over longer times don’t exert a significant influence on the performance of the process.