Your new post is loading...


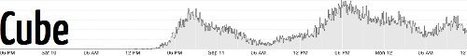
Cube is an open-source system for visualizing time series data, built on MongoDB, Node and D3. If you send Cube timestamped events (with optional structured data), you can easily build realtime visualizations of aggregate metrics for internal dashboards.
Cube speaks WebSockets for low-latency, asynchronous input and output: new events are streamed in, and requested metrics are streamed out as they are computed. (You can also POST events to Cube, if that’s your thing, and collectd integration is included!) Metrics are cached in capped collections, and simple reductions such as sum and max use pyramidal aggregation to improve performance. Visualizations are generated client-side and assembled into dashboards with a few mouse clicks.