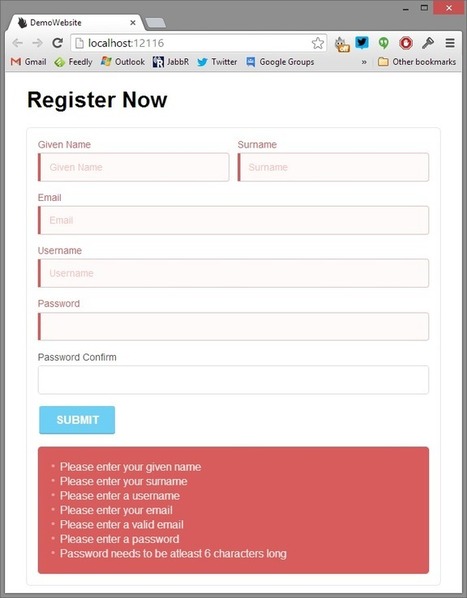
Help developers automatically test their websites for accessibility, validation, conventions and best-practices.

 Your new post is loading...
 Scoop.it! Help developers automatically test their websites for accessibility, validation, conventions and best-practices. 
No comment yet.
Sign up to comment
Scoop.it!

The “write once, run anywhere” concept may be pure fantasy for most apps but sharing code across platforms is desirable and in some cases essential to making projects economically viable.
Scoop.it!

It has been a long time coming, but here is part 4 in in our continuous series of articles that takes a look at the latest and greatest responsive framewor
Scoop.it!

amdclean - An AMD build tool that converts AMD code to standard JavaScript
Scoop.it!

JSIL is an open source compiler that turns .NET applications, written in C# or VB.NET, into fast readable JavaScript.

Simon Hunanyan's curator insight,
October 14, 2013 2:09 AM
Wow, now you can take this JavaScript and run it in any web browser or any other modern JavaScript runtime.
Scoop.it!
dropzonejs is an open source library that provides beautiful and easy to use drag'n'drop file uploads with image previews.
Scoop.it!
http://www.youtube.com/watch?v=0vsd6QD58SQ I made this screencast to show how to use C# scripting to explore Web applications and incrementally build their test automation frameworks with scriptcs ...
|
Scoop.it!

Finch.js is a whole new take on handling routes in javascript web apps.
Scoop.it!

Here is a list of 12 common forget to correct in order to optimize your HTML5 source code. It may be the details, but placed end to end, they make the difference. By improving the semantic, web SEO will benefit.
Scoop.it!

The REST API Tutorial. Learn REST API best practices.
Scoop.it!
Modern Web Apps with HTML5 in 45 minutes
Scoop.it!

One of the best way to create a website without paying too much is to use a ready coded website template(HTML5/CSS3) or using an open source CMS application.Portfolio of a web designer and developer or a graphic designer is like his/her identity.It...
Scoop.it!
Web applications that work offline are still clearly in demand, but the standards lack support for even fairly basic use cases, and encourage developers to b...
Scoop.it!

KoolChart is a pure JavaScript / HTML5 (Canvas) charting solution that allows you to add visualization features into your web applications.

Jason colt's curator insight,
June 6, 2015 6:34 AM
Representing data with the help of charts and symbols seems very interactive. Also it is easy to understand data in picture form. Today number of charting libraries are available in market for creation of such charts and graphs so it not hectic to create charts. Koolchart, Google free chart, etc are widely used charting library. http://www.koolchart.com |