Your new post is loading...

|
Scooped by
Dr. Stefan Gruenwald
November 1, 2017 2:54 PM
|
A team of researchers has discovered a flaw in the way past ocean temperatures have been estimated up to now. Their findings could mean that the current period of climate change is unparalleled over the last 100 million years. According to the methodology widely used by the scientific community, the temperature of the ocean depths and that of the surface of the polar ocean 100 million years ago were around 15 degrees higher than current readings. This approach, however, is now being challenged: ocean temperatures may in fact have remained relatively stable throughout this period, which raises serious concerns about current levels of climate change. These are the conclusions of a study conducted by a team of French researchers from the French National Center for Scientific Research (CNRS), Sorbonne University and the University of Strasbourg, and Swiss researchers from the Swiss Federal Institute of Technology in Lausanne (EPFL) and the University of Lausanne. The study has just been published in Nature Communications. "If we are right, our study challenges decades of paleoclimate research," says Anders Meibom, the head of EPFL's Laboratory for Biological Geochemistry and a professor at the University of Lausanne. Meibom is categorical: "Oceans cover 70% of our planet. They play a key role in Earth's climate. Knowing the extent to which their temperatures have varied over geological time is crucial if we are to gain a fuller understanding of how they behave and to predict the consequences of current climate change more accurately." How could the existing methodology be so flawed? The study's authors believe that the influence of certain processes was overlooked. For over 50 years, the scientific community based its estimates on what they learned from foraminifera, which are the fossils of tiny marine organisms found in sediment cores taken from the ocean floor. The foraminifera form calcareous shells called tests in which the content of oxygen-18 depends on the temperature of the water in which they live. Changes in the ocean's temperature over time were therefore calculated on the basis of the oxygen-18 content of the fossil foraminifera tests found in the sediment. According to these measurements, the ocean's temperature has fallen by 15 degrees over the past 100 million years.
|
|
Scooped by
Dr. Stefan Gruenwald
September 26, 2017 12:12 PM
|
A low level of atmospheric oxygen in Earth's middle ages held back evolution for 2 billion years, raising fresh questions about the origins of life on this planet. New research by the University of Exeter explains how oxygen was trapped at such low levels. Professor Tim Lenton and Dr Stuart Daines of the University of Exeter Geography department, created a computer model to explain how oxygen stabilised at low levels and failed to rise any further, despite oxygen already being produced by early photosynthesis. Their research helps explain why the 'great oxidation event', which introduced oxygen into the atmosphere around 2.4 billion years ago, did not generate modern levels of oxygen. In their paper, published in Nature Communications, Atmospheric oxygen regulation at low Proterozoic levels by incomplete oxidative weathering of sedimentary organic carbon, the University of Exeter scientists explain how organic material -- the dead bodies of simple lifeforms -- accumulated in the earth's sedimentary rocks. After the Great Oxidation, and once plate tectonics pushed these sediments to the surface, they reacted with oxygen in the atmosphere for the first time. The more oxygen in the atmosphere, the faster it reacted with this organic material, creating a regulatory mechanism whereby the oxygen was consumed by the sediments at the same rate at which it was produced. This mechanism broke down with the rise of land plants and a resultant doubling of global photosynthesis. The increasing concentration of oxygen in the atmosphere eventually overwhelmed the control on oxygen and meant it could finally rise to the levels we are used to today. This helped animals colonize the land, leading eventually to the evolution of humankind. The model suggests atmospheric oxygen was likely at around 10% of present day levels during the two billion years following the Great Oxidation Event, and no lower than 1% of the oxygen levels we know today.
|
|
Scooped by
Dr. Stefan Gruenwald
September 10, 2017 4:45 PM
|
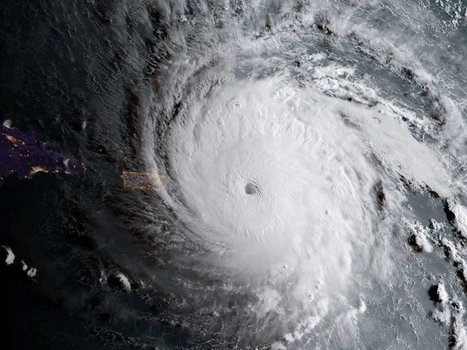
We know how damaging and costly, in many ways, such natural phenomena can be — but the devastation is not surprising, once you know how much energy is involved, says astrophysicist Marcelo Gleiser. America seems to be a magnet for devastating hurricanes these days. This year, Harvey came out strong with its horrific toll on parts of Texas and Louisiana. Now Irma, downgraded slightly Friday morning to a Category 4 storm from its most recent days as a Category 5, has left destruction in its wake as it plows through the Caribbean and Cuba — and is on path to hit Florida Sunday morning. It's too early to know if this will be a particularly bad year, as the average number of major hurricanes in the U.S. per decade is roughly six. But averages, important as they are, mean little to those who have to brace for impact. We know how damaging such natural phenomenon can be — and how costly, at many levels, from emotional loss to rebuilding costs in the billions of dollars. The devastation is not surprising, once you know how much energy is involved. Consider this: In one day, an average hurricane releases as much energy as half a million atomic bombs, a force to be reckoned with. When the sun heats an ocean to more than 82 degrees, moist hot air rises up meeting cooler air — creating thunderstorms. Upper-level winds and surface winds come together, forming a circular pattern called a tropical depression. Why circular? See below. Then, when the winds reach 74 miles per hour, a hurricane forms, sometimes as wide as 500 miles in diameter, nearly the size of Texas, reaching heights of nine miles. This short National Geographic info-video is a good introduction to hurricanes. Remarkably, hurricanes spin counter-clockwise in the Northern Hemisphere and clockwise in the Southern hemisphere. This differential spinning is due to Earth's rotation. If the Earth didn't rotate, winds of up to 300 miles per hour would howl from the poles to the Equator and back. But Earth's spin, and because the equatorial regions spin a bit faster than the regions at higher and lower latitudes, affects the air currents due to what is known as the Coriolis effect. In the first half of the 19th century, French engineer and mathematician Gustave Gaspard Coriolis proposed it as an explanation as to how the motion of objects is affected when they are on a rotating basis or reference frame, like the spinning Earth or a merry-go-round. Think of the Earth as a big ball rotating from West to East. So, if you are looking at it from the top, it will rotate counter-clockwise. Air currents near the equator get pushed a bit faster than those closer to the poles, with those above the Equator getting pushed to the right and those below it to the left. It is this pushing that causes hurricanes in the North to rotate counter-clockwise and those in the South, clockwise. This also explains why hurricanes don't cross the equator, as the Coriolis effect there is too weak to get the air spinning fast enough.
|
|
Scooped by
Dr. Stefan Gruenwald
August 22, 2017 11:28 AM
|
A team of researchers from Princeton University, the Scripps Institution of Oceanography, the University of Maine and Oregon State University has drilled and retrieved a 2.7-million-year-old ice core from a spot in Antarctica. Until recently, scientists believed that ice core samples taken from either pole had an age limit of approximately 800,000 years—this was because ice at the bottom melted due to heat from inside the Earth. But a team at Princeton discovered a few year ago that another type of ice could hold much older ice known as blue ice. It forms on glaciers due to snowfall which, over time, becomes compressed, squeezing out air bubbles, making the ice look blue. But it also has another characteristic—over time, the ice at the bottom is pushed upwards, protecting it from melting. In this new effort, the team drilled at a site called the Allan Hills, near McMurdo Station. Ice cores taken from glaciers present problems because they are more difficult to date—cores from other places are dated by counting their layers. The older ice, it was found, could be dated by studying trace amounts of potassium and argon—though not as precise as layer counting, the researchers believe it is accurate to within 100,000 years. One of the first teams to take a core sample from the older ice drilled to a depth of 128 meters. In this latest effort, the team drilled to 205 meters and found ice that was nearly twice as old. Ice cores are important because they contain very small air bubbles that are samples of atmospheric conditions. Air bubbles from 2.7 million years ago offer evidence of climactic conditions during the time before the ice ages began, perhaps offering clues as to why they occurred. Already, the team has found that atmospheric carbon dioxide levels were at approximately 300 ppm, which is considerably lower than today's 400 ppm. But the team notes that the core sample represents something perhaps even more exciting—the possibility of finding core samples that are much older, perhaps as old as 5 million years.
|
|
Scooped by
Dr. Stefan Gruenwald
August 9, 2017 3:20 PM
|
Researchers funded by the National Science Foundation (NSF) have publicly released high-resolution maps of Antarctica's McMurdo Dry Valleys, a globally unique polar desert. The high-resolution maps cover 3,564 square kilometers of the McMurdo Dry Valleys and allow researchers to compare present-day conditions with lower-resolution LIDAR surveys conducted almost 13 years ago. Scientists from Portland State University led the new research project, which mapped the area using more sophisticated LIDAR, a remote-sensing method that uses laser beam pulses to measure the distance from the detector to the Earth's surface. Two NSF-funded facilities, the Open Topography Facility and the Polar Geospatial Center, made the LIDAR data publicly available. A paper about the work was published in the journal Earth System Science Data. The data, collected by aerial survey missions flown in the Southern Hemisphere in the summer of 2014-2015, provide detailed topography of the perpetually ice-free region, where surprising landscape changes, such as rapid erosion along some streams, have been observed in recent years. The freely available datasets will allow scientists to get a handle on how widespread and how significant changes to the frozen landscape might be in this ecologically sensitive region. The National Center for Airborne Laser Mapping and the Portland State University team carried out the mapping during an eight-week field season, beginning in December 2015. They flew instruments aboard a Twin Otter aircraft operated by Kenn Borek Air, Ltd., under contract to NSF.
|
|
Rescooped by
Dr. Stefan Gruenwald
from Geology
May 26, 2017 1:16 PM
|
Deep portions of Earth's mantle might be as hot as it was more than 2.5 billion years ago, an international team of researchers has recently discovered. An international team of researchers led by geoscientists with the Virginia Tech College of Science recently discovered that deep portions of Earth's mantle might be as hot as it was more than 2.5 billion years ago. The study, led by Esteban Gazel, an assistant professor with Virginia Tech's Department of Geosciences, and his doctoral student Jarek Trela of Deer Park, Illinois, is published in the latest issue of Nature Geoscience. The study brings new, unprecedented evidence on the thermal evolution of the deep Earth during the past 2.5 billion years, Gazel said. The Archean Eon -- covering from 2.5 to 4 billion years ago -- is one of the most enigmatic times in the evolution of our planet, Gazel said. During this time period, the temperature of Earth's mantle -- the silicate region between the crust and the outer core -- was hotter than it is today, owing to a higher amount of radioactive heat produced from the decay of elements such as potassium, thorium, and uranium. Because Earth was hotter during this period, this interval of geologic time is marked by the widespread of occurrence of a unique rock known as komatiite. "Komatiites are basically superhot versions of Hawaiian style lava flows," Gazel said. "You can imagine a Hawaiian lava flow, only komatiites were so hot that they glowed white instead of red, and they flowed on a planetary surface with very different atmospheric conditions, more similar to Venus than the planet we live on today." Earth essentially stopped producing abundant hot komatiites after the Archean era because the mantle has cooled during the past 4.5 billion years due to convective cooling and a decrease in radioactive heat production, Gazel said. However, Gazel and a team made what they call an astonishing discovery while studying the chemistry of ancient Galapagos-related lava flows, preserved today in Central America: a suite of lavas that shows conditions of melting and crystallization similar to the mysterious Archean komatiites. Gazel and collaborators studied a set of rocks from the 90 million-year-old Tortugal Suite in Costa Rica and found that they had magnesium concentrations as high as Archean komatiites, as well as textural evidence for extremely hot lava flow temperatures. "Experimental studies tell us that that the magnesium concentration of basalts and komatiites is related to the initial temperature of the melt," Gazel said. "They higher the temperature, the higher the magnesium content of a basalt."
Via Dr. Catherine Russell
|
|
Scooped by
Dr. Stefan Gruenwald
April 29, 2017 11:54 AM
|
|
|
Scooped by
Dr. Stefan Gruenwald
April 11, 2017 9:14 PM
|
The latest evidence that people are refashioning Earth is written not in the sky, where carbon dioxide levels are rising, nor in the acidifying ocean, but in stone. Geologists have identified about 200 minerals that formed due to the hustle and bustle of human activity. Many of these unintentionally formed minerals appeared on Earth during the past two centuries, a blip in the timescale of thousands to millions of years that geologists typically work with. “It is happening in a geologic instant, in the blink of an eye,” says Robert M. Hazen from the Geophysical Laboratory at the Carnegie Institution for Science. Hazen led a research team that cataloged the human-influenced minerals last month (Am. Mineral. 2017, DOI: 10.2138/am-2017-5875). The uptick in mineral diversity is more than just an expanded checklist for rock hounds. To Hazen and colleagues, it grants further credence to the notion that humans have driven Earth into a new unit of geologic time: the Anthropocene epoch. The epoch comes after geological times such as the Plesiteocene epoch or the Jurassic period left their identifying marks in Earth’s sediment. And “there will be a distinctive, pervasive, and very diagnostic layer that makes our time different from any other time in Earth’s history,” Hazen contends. This argument has made his new paper the target of both praise and derision among professional geologists. The Anthropocene epoch is a proposed—but not yet official—unit of geologic time that would mark an end to the Holocene—the current epoch that began about 12,000 years ago after the last ice age ended. Click here to edit the content
|
|
Scooped by
Dr. Stefan Gruenwald
March 13, 2017 1:52 PM
|
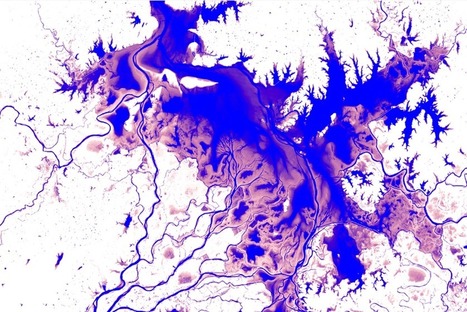
Google has partnered with the European Commission’s Joint Research Centre to produce the greatest views of water on the surface of Earth ever. The images show changing water levels, and reveal some of the stories behind the changes from the past three decades to see how they "have shaped the world over time, in unprecedented detail." The project took more than three years and involved thousands of computers downloading 1.8 petabytes of data from the USGS/NASA Landsat satellite program. Each pixel in 3 million satellite images, going back to 1984, was analyzed by an algorithm developed by the Joint Research Centre running on the Google Earth Engine platform. More than 10 million hours of computing time was needed for this, roughly equivalent to a modern 2-core computer running day and night for 600 years. From this, the researchers were able to establish that, over the past 32 years, 90,000 square kilometers of water - the equivalent of half of the lakes in Europe - have vanished, while 200,000 square kilometers of new, mostly man-made water bodies appeared. The continuing drying up of the Aral Sea in Uzbekistan and Kazakhstan accounts for the biggest loss in the world. Iran and Afghanistan lost over a half, Iraq over a third of its water area.
|
|
Scooped by
Dr. Stefan Gruenwald
March 7, 2017 4:46 PM
|
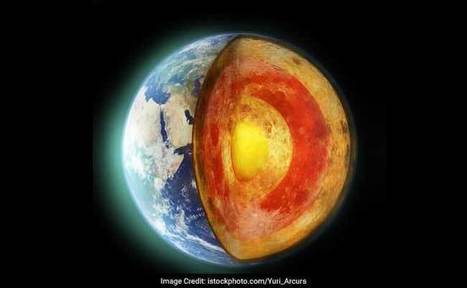
The mantle - the mostly solid, rocky part of Earth's interior - is about 60 degrees Celsius hotter than previously thought, a new study has found.
The findings led by Woods Hole Oceanographic Institution (WHOI) in the US could change how scientists think about many issues in Earth science including how ocean basins form.
A 60-degree increase may not sound like a lot compared to a molten mantle temperature of more than 1,400 degrees Celsius, researchers said. However, the result is significant as a hotter mantle would be more fluid, helping to explain the movement of rigid tectonic plates, they said.
Since it is not possible to measure the mantle's temperature directly, geologists have to estimate it through laboratory experiments that simulate the high pressures and temperatures inside the Earth.
Water is a critical component of the equation: the more water (or hydrogen) in rock, the lower the temperature at which it will melt. The peridotite rock that makes up the upper mantle is known to contain a small amount of water. To figure out how the water content of mantle rock affects its melting point, Emily Sarafian, a graduate student in the MIT-WHOI Joint Programme conducted a series of lab experiments.
She used a piston-cylinder apparatus, a machine that uses electrical current, heavy metal plates, and stacks of pistons in order to magnify force to recreate the high temperatures and pressures found deep inside the Earth. Following standard experimental methodology, Sarafian created a synthetic mantle sample. She used a known, standardised mineral composition and dried it out in an oven to remove as much water as possible.
Sarafian modified her starting sample by adding spheres of a mineral called olivine, which occurs naturally in the mantle. The spheres were large enough for Sarafian to analyse their water content using secondary ion mass spectrometry (SIMS). From there, she was able to calculate the water content of her entire starting sample. To her surprise, she found it contained approximately the same amount of water known to be in the mantle. Based on her results, Sarafian concluded that mantle melting had to be starting at a shallower depth under the seafloor than previously expected.
To verify her results, Sarafian turned magnetotellurics - a technique that analyses the electrical conductivity of the crust and mantle under the seafloor. Reconciling the temperatures and pressures Sarafian measured in her experiments with the melting depth from an earlier study led her to a startling conclusion: The oceanic upper mantle must be 60 degrees Celsius hotter than current estimates.
|
|
Scooped by
Dr. Stefan Gruenwald
February 19, 2017 2:30 PM
|
The Earth's geomagnetic field increased in intensity around the Levant during the late eighth century B.C. before rapidly weakening. The Earth is surrounded by a magnetic field that arises from the motion of iron in the liquid outer core. Direct observation of the field has been possible for only about 180 years, Ben-Yosef told Live Science. In that time, the field has weakened by about 10 percent, he said. Some researchers think the fieldmight be in the process of flipping, so that magnetic north becomes magnetic south and vice versa. The new study reveals much faster changes in intensity. There was a spike in intensity during the late eighth century B.C., culminating in a rapid decline after about 732 B.C., Ben-Yosef and his colleagues reported today (Feb. 13) in the journal Proceedings of the National Academy of the Sciences. In a mere 31 years beginning in the year 732 B.C., there was a 27 percent decrease in the strength of the magnetic field, the researchers found. From the sixth century B.C. to the second century B.C., the field was generally stable, with a slight gradual decline. "Our research shows that the field is very fluctuating," Ben-Yosef said. "It fluctuates quite rapidly, so there is nothing to worry about," as far as the current decline, he said. This doesn't mean that the magnetic field isn't going to flip in the near future; the new study looked at only strength of the field, not directionality. The findings do suggest that there's no reason to worry that a 10 percent decline in the field strength over more than a century is abnormal, Ben-Yosef said. At least in the Levant, that is. All of the pottery in the study came from this region, which encompasses what is now Syria, Jordan, Israel, Palestine, Lebanon and nearby areas. That means researchers can't be sure whether the same fluctuations were happening elsewhere. Because the scientists also don't know for sure the precise locations within the Levant where the pottery was fired, they can't say anything about the direction of the geomagnetic field at the time, only its strength.
|
|
Scooped by
Dr. Stefan Gruenwald
February 16, 2017 3:58 PM
|
Kids are frequently taught that seven continents exist: Africa, Asia, Antarctica, Australia, Europe, North America, and South America. Geologists, who look at the rocks (and tend to ignore the humans), group Europe and Asia into its own supercontinent - Eurasia - making for a total of six geologic continents. But according to a new study of Earth's crust, there's a seventh geologic continent called 'Zealandia', and it has been hiding under our figurative noses for millennia. The 11 researchers behind the study argue that New Zealand and New Caledonia aren't merely an island chain. Instead, they're both part of a single, 4.9-million-square kilometer (1.89 million-square-mile) slab of continental crust that's distinct from Australia. "This is not a sudden discovery but a gradual realization; as recently as 10 years ago we would not have had the accumulated data or confidence in interpretation to write this paper," they wrote in GSA Today, a Geological Society of America journal. Ten of the researchers work for organizations or companies within the new continent; one works for a university in Australia. But other geologists are almost certain to accept the research team's continent-size conclusions, says Bruce Luyendyk, a geophysicist at the University of California, Santa Barbara (he wasn't involved in the study). "These people here are A-list earth scientists," Luyendyk explains. "I think they have put together a solid collection of evidence that's really thorough. I don't see that the
|
|
Scooped by
Dr. Stefan Gruenwald
February 9, 2017 6:22 PM
|
These transient features are so named because they last about 20 milliseconds. Scientists don't know much about the mysterious, powerful electric discharges that sometimes occur in the upper levels of the atmosphere in conjunction with thunderstorms. The first photograph of the phenomenon—which can occur as high as about 90km above the surface of the Earth and are known variously as sprites, pixies, elves, or jets—was only taken from Earth in 1989. Fortunately for scientists interested in these storms, the International Space Station offers an excellent vantage point at an altitude of about 400km. So Danish researchers devised a "Thor experiment"—named after the hammer-wielding Norse god—to study the phenomenon. As part of the experiment, an astronaut on board the station would image thunderstorms under certain conditions, and these observations would be correlated with data collected by satellites and ground-based radar and lightning detection systems. It may sound easy to catch a few quick snaps of electrical storms, but given the station's movement at 28,000km/hour and ephemeral nature of these events, it's actually quite difficult. Sprites and other features got their other-worldly names precisely because they are so short-lived, lasting on the order of 20 milliseconds. When Danish astronaut Andreas Mogensen spent 10 days on the station in September 2015 as part of an ESA-Roscosmos contract that designated him a visiting crew member, one of his primary tasks was to complete the Thor experiment. Perched in the station's cupola, with a Nikon D4 set at 6400 ISO and recording 24 frames per second, Mogensen readied himself to capture images at locations where forecasters predicted thunderstorm activity would occur below.
|
|
|
Scooped by
Dr. Stefan Gruenwald
October 30, 2017 8:25 PM
|
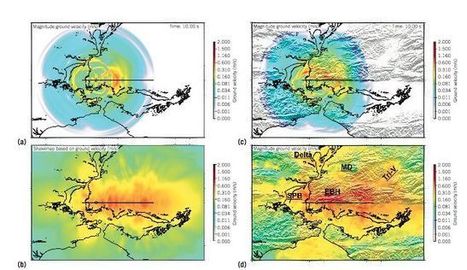
Currently, an interdisciplinary team of researchers are building the first-ever end-to-end simulation code to precisely capture the geology and physics of regional earthquakes, and how the shaking impacts buildings. This work is part of the DOE’s Exascale Computing Project, which aims to maximize the benefits of exascale—future supercomputers that will be 50 times faster than our nation’s most powerful system today—for U.S. economic competitiveness, national security and scientific discovery. “Due to computing limitations, current geophysics simulations at the regional level typically resolve ground motions at 1-2 hertz (vibrations per second). Ultimately, we’d like to have motion estimates on the order of 5-10 hertz to accurately capture the dynamic response for a wide range of infrastructure,” says David McCallen, who leads an ECP-supported effort called High Performance, Multidisciplinary Simulations for Regional Scale Seismic Hazard and Risk Assessments. He’s also a guest scientist in Berkeley Lab’s Earth and Environmental Sciences Area. One of the most important variables that affect earthquake damage to buildings is seismic wave frequency, or the rate at which an earthquake wave repeats each second. Buildings and structures respond differently to certain frequencies. Large structures like skyscrapers, bridges, and highway overpasses are sensitive to low frequency shaking, whereas smaller structures like homes are more likely to be damaged by high frequency shaking, which ranges from 2 to 10 hertz and above. McCallen notes that simulations of high frequency earthquakes are more computationally demanding and will require exascale computers.
|
|
Scooped by
Dr. Stefan Gruenwald
September 11, 2017 2:23 PM
|
This year we saw three, but what's the limit? The satellite pictures were a startling sight. As Hurricane Irma barreled toward Florida last week and Hurricane Katia hammered the Mexican coast, Hurricane Jose was waiting in the wings. All at once, three storms gathered strength and grew fiercer. Seeing a trio of powerful hurricanes simultaneously made a lot of people wonder: Just how many hurricanes can the Atlantic harbor at once? To try to find an answer, we asked Dr. Anand Gnanadesikan, a climate modeler and professor of Earth and planetary sciences at the Krieger School of Arts and Sciences. According to Gnanadesikan, the number of storms in the Atlantic depends on two main factors. The first is whether or not conditions are favorable to the development of tropical cyclones. The second thing you need is a spark—"seed" storms that, under the right circumstances, are supercharged into hurricanes. These low-pressure systems sometimes self-organize; other times hurricanes-to-be trace their roots eastward to Africa. Gnanadesikan explains that there's a limit to how many of these seeds can exist, because if they get too close to one another they can become unstable. They generally form a few thousand kilometers apart, which means there's limited space. Gnanadesikan says: "So a question one could ask is, 'How many seeds might one find in the Atlantic and how likely is it that they will all grow?'" Using NOAA's HURDAT2 database, which contains data from as far back as 1851, Gnanadesikan found that any time one tropical cyclone is present in the Atlantic, there's historically about a 20 percent chance that a second seed will level up into a cyclone. The odds of a third seed ascending are roughly the same—20 percent of the those two-storms situations. This diminishing trend probably leads to a three-cyclone situation in about four percent of records, a number Gnanadesikan says was higher than expected, but also includes many cyclones which never made landfall. By the time you get to four or more cyclones at one, that level is found in only about 340 records—less than one percent. At about four simultaneous storms, Gnanadesikan says, "you might start running out of seeds."
|
|
Scooped by
Dr. Stefan Gruenwald
September 7, 2017 2:55 PM
|
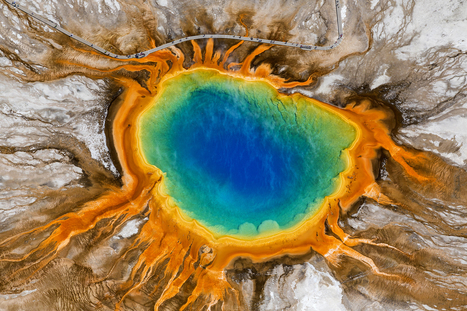
NASA researchers say siphoning heat from the Yellowstone Caldera could lower the risk of a deadly eruption while generating electricity. Humans have witnessed many cataclysmic volcanic eruptions, from the one that destroyed Pompeii in 79 A.D. to the extraordinary Krakatoa eruption of 1883. But around the world right now there are about 20 so-called “supervolcanoes” that could outdo them all. One of these monster volcanoes lurks beneath Yellowstone National Park. The Yellowstone Caldera is an enormous craterlike depression measuring 30 miles by 45 miles and filled with molten material (magma). If it were to blast its innards out in a super-eruption, it’s no exaggeration to say that the human race could be imperiled. But scientists at NASA have sketched the rough outlines of a plan that they say would not only spare us from a deadly super-eruption but also turn the Yellowstone supervolcano into a source of electric power. In a write-up of the plan first shared with the BBC, the team argues that we could siphon heat from the caldera until it becomes too cool to erupt — and convert the geothermal energy into electricity.
|
|
Scooped by
Dr. Stefan Gruenwald
August 22, 2017 11:26 AM
|
Tremendous amounts of soot, lofted into the air from global wildfires following a massive asteroid strike 66 million years ago, would have plunged Earth into darkness for nearly two years, new research finds. This would have shut down photosynthesis, drastically cooled the planet, and contributed to the mass extinction that marked the end of the age of dinosaurs. These new details about how the climate could have dramatically changed following the impact of a 10-kilometer-wide asteroid will be published Aug. 21 in the Proceedings of the National Academy of Sciences. The study, led by the National Center for Atmospheric Research (NCAR) with support from NASA and the University of Colorado Boulder, used a world-class computer model to paint a rich picture of how Earth's conditions might have looked at the end of the Cretaceous Period, information that paleobiologists may be able to use to better understand why some species died, especially in the oceans, while others survived. Scientists estimate that more than three-quarters of all species on Earth, including all non-avian dinosaurs, disappeared at the boundary of the Cretaceous-Paleogene periods, an event known as the K-Pg extinction. Evidence shows that the extinction occurred at the same time that a large asteroid hit Earth in what is now the Yucatán Peninsula. The collision would have triggered earthquakes, tsunamis, and even volcanic eruptions. Scientists also calculate that the force of the impact would have launched vaporized rock high above Earth's surface, where it would have condensed into small particles known as spherules. As the spherules fell back to Earth, they would have been heated by friction to temperatures high enough to spark global fires and broil Earth's surface. A thin layer of spherules can be found worldwide in the geologic record. "The extinction of many of the large animals on land could have been caused by the immediate aftermath of the impact, but animals that lived in the oceans or those that could burrow underground or slip underwater temporarily could have survived," said NCAR scientist Charles Bardeen, who led the study. "Our study picks up the story after the initial effects—after the earthquakes and the tsunamis and the broiling. We wanted to look at the long-term consequences of the amount of soot we think was created and what those consequences might have meant for the animals that were left."
|
|
Scooped by
Dr. Stefan Gruenwald
June 30, 2017 11:39 AM
|
One of the most beautiful places in the United States that every American should visit at least once in their life is Yellowstone National Park, a vast region of wildlife and geographical wonders that stretches through parts of Wyoming, Montana and Idaho. Between the massive herds of bison that can be seen grazing out in the valleys, and the incredible geysers and hot springs that have been around for thousands of years, Yellowstone really does deserve to be one of the most popular tourist locations in the country. But despite its beauty, there is an ancient monster in Yellowstone that has remained dormant for 70,000 years… and it just might be getting ready to wake up. Recently, there have been over 400 earthquakes recorded in Yellowstone, the latest being a magnitude 3 earthquake that struck on Monday, June 19. Just four days earlier, Yellowstone was hit with an even larger, magnitude 4.5 earthquake. “The epicenter of the shock was located in Yellowstone National Park, eight miles north-northeast of the town of West Yellowstone, Montana,” said scientists from the University of Utah in a statement. “The earthquake was reportedly felt in the towns of West Yellowstone and Gardiner, Montana, in Yellowstone National Park, and elsewhere in the surrounding region.” (Related: Scientists have been underestimating the threat of earthquakes.) The earthquake that took place on June 15 was the largest to have hit Yellowstone since March 30, 2014, when the area of the Norris Geyser Basin experienced a magnitude 4.8 earthquake. This pattern of rather severe earthquakes in Yellowstone has led many to believe that avolcanic eruption is due to take place sometime in the near future, even though it is currently impossible to know when exactly that will happen. According to experts at the U.S. Geological Survey (USGS), the chances that the Yellowstone supervolcano will erupt is still significantly low. A USGS spokesperson recently told Newsweek that volcanic activity seems to be “slowly winding down” and that “no other geological activity has been detected.” As of right now, the chances that Yellowstone’s supervolcano will erupt within the next year is one in 730,000. But even though the chances of a massive volcanic eruption in Yellowstone are slim, what would happen if it did? Three years ago, the USGS published a report that modeled what would happen if Yellowstone’s supervolcano erupted. According to their findings, such an eruption would cover the majority of North America with a blanket of ash, with some areas of the country even being buried a meter deep.
|
|
Rescooped by
Dr. Stefan Gruenwald
from Popular Science
May 2, 2017 1:36 PM
|
The eerily gory waterfall is not in fact made of blood, and a new study shows just what gives it its unique color. Blood Falls, named for its ruddy color, is not in fact a gush of blood from some unseen wound. The color was initially chalked up to red algae, but a new study in the Journal of Glaciology has uncovered its true origin using radar to scan the layers of ice from which the river pours. The discovery came at the hands of a team of scientists, including National Geographic emerging explorer Erin C Petit. Located in Antarctica’s McMurdo Dry Valleys, the falls pour forth from Taylor Glacier, and the liquid bubbles up from fissures in the glacier’s surface. The flow was previously a mystery, as the mean temperature is 1.4 degrees Fahrenheit (-17 degrees Celsius) and little glacial melting can be seen at the surface. Imaging from underneath the glacier helped solve the mystery, revealing a complex network of subglacial rivers and a subglacial lake—all filled with brine high in iron, giving the falls its reddish tint. According to the study, the makeup of the brine explains the fact that it flows instead of freezes. “The brine remains liquid within the subglacial and englacial environments through latent heat of freezing coupled with elevated salt content,” the study explains. The lake under the glacier has an unusually salty consistency, and because saltwater has a lower freezing point than pure water and releases heat as it freezes, it melts the ice, enabling the rivers to flow. This means that the glacier can support flowing water and also that this is the coldest glacier on Earth with constantly flowing water—though this water is so filled with iron that it looks like something else entirely. The study also measured the amount of iron-rich brine in the river water and found the brine content increased as the measurements drew closer to the falls. Water temperature and brine content were also found to be related: Cracks of various sizes in the glacier let brine into the glacier. Then the brine (pictured here in red to represent the amount of iron present in the water) begins to freeze, and the latent heat warms the ice around it, upping the brine concentration in the center of the cracks.
Via Neelima Sinha
|
|
Scooped by
Dr. Stefan Gruenwald
April 24, 2017 6:06 PM
|
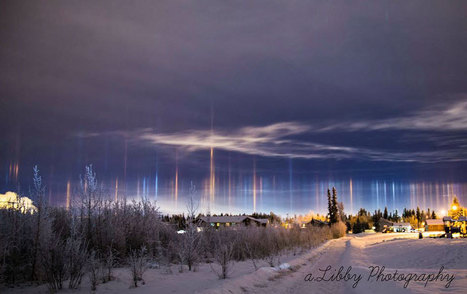
Researchers collaborated with citizen scientists and astrophotographers to pinpoint a mysterious new aurora feature, nicknamed "Steve." Photographer Dave Markel caught this view of a strange aurora-like feature that appears in the skies of northern Canada. Based on data from European Space Agency's Swarm satellites, it appears to be a 16-mile-wide (25 km) ribbon of flowing gas in an area whose temperature is 5,500 degrees Fahrenheit (3,000 degrees Celsius) higher than the surroundings; the gas flows at 3.5 miles per second (6 km/s) compared to a speed of 33 feet/second (10 m/s) on either side of the ribbon. They're calling the feature "Steve."
|
|
Scooped by
Dr. Stefan Gruenwald
March 13, 2017 7:37 PM
|
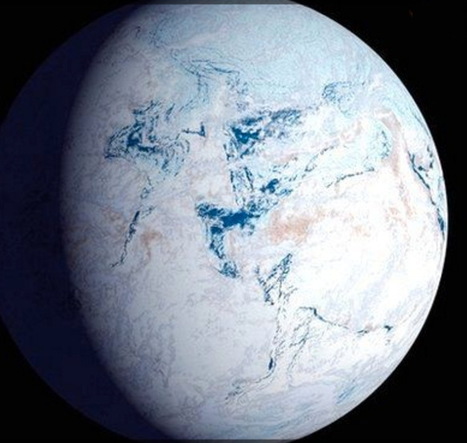
What caused the largest glaciation event in Earth's history, known as 'snowball Earth'? Geologists and climate scientists have been searching for the answer for years but the root cause of the phenomenon remains elusive. Now, Harvard University researchers have a new hypothesis about what caused the runaway glaciation that covered Earth pole-to-pole in ice. The research is published in Geophysical Research Letters. Researchers have pinpointed the start of what's known as the Sturtian snowball Earth event to about 717 million years ago -- give or take a few 100,000 years. At around that time, a huge volcanic event devastated an area from present-day Alaska to Greenland. Coincidence? Harvard professors Francis Macdonald and Robin Wordsworth thought not. "We know that volcanic activity can have a major effect on the environment, so the big question was, how are these two events related," said Macdonald, the John L. Loeb Associate Professor of the Natural Sciences. At first, Macdonald's team thought basaltic rock -- which breaks down into magnesium and calcium -- interacted with CO2 in the atmosphere and caused cooling. However, if that were the case, cooling would have happened over millions of years and radio-isotopic dating from volcanic rocks in Arctic Canada suggest a far more precise coincidence with cooling. Macdonald turned to Wordsworth, who models climates of non-Earth planets, and asked: could aerosols emitted from these volcanos have rapidly cooled Earth? The answer: yes, under the right conditions. "It is not unique to have large volcanic provinces erupting," said Wordsworth, assistant professor of Environmental Science and Engineering at the Harvard John A. Paulson School of Engineering and Applied Science. "These types of eruptions have happened over and over again throughout geological time but they're not always associated with cooling events. So, the question is, what made this event different?" Geological and chemical studies of this region, known as the Franklin large igneous province, showed that volcanic rocks erupted through sulfur-rich sediments, which would have been pushed into the atmosphere during eruption as sulfur dioxide. When sulfur dioxide gets into the upper layers of the atmosphere, it's very good at blocking solar radiation. The 1991 eruption of Mount Pinatubo in the Philippines, which shot about 10 million metric tons of sulfur into the air, reduced global temperatures about 1 degree Fahrenheit for a year. Sulfur dioxide is most effective at blocking solar radiation if it gets past the tropopause, the boundary separating the troposphere and stratosphere. If it reaches this height, it's less likely to be brought back down to earth in precipitation or mixed with other particles, extending its presence in the atmosphere from about a week to about a year. The height of the tropopause barrier all depends on the background climate of the planet -- the cooler the planet, the lower the tropopause. "In periods of Earth's history when it was very warm, volcanic cooling would not have been very important because Earth would have been shielded by this warm, high tropopause," said Wordsworth. "In cooler conditions, Earth becomes uniquely vulnerable to having these kinds of volcanic perturbations to climate."
|
|
Scooped by
Dr. Stefan Gruenwald
March 13, 2017 1:25 PM
|
University of Miami Rosenstiel School of Marine and Atmospheric Science scientist Mark Donelan and his Norwegian Meteorological Institute colleague captured new information about extreme waves, as one of the steepest ever recorded passed by the North Sea Ekofisk platforms in the early morning hours of Nov. 9 2007. Within the first hour of the day, the Andrea wave passed by a four-point square array of ocean sensors designed by the researchers to measure the wavelength, direction, amplitude and frequency of waves at the ocean surface. Using the information from the wave set—a total of 13,535 individual waves—collected by the system installed on a bridge between two offshore platforms, the researchers took the wave apart to examine how the components came together to produce such a steep wave. The data from the 100-meter wide “wall of water” moving at 40 miles per hour showed that Andrea may have reached heights greater than the recorded height of 49 feet above mean sea level. They also found that rogue waves are not rare as previously thought and occur roughly twice daily at any given location in a storm. The findings showed that the steeper the waves are, the less frequent their occurrence, which is about every three weeks at any location for the steepest rogues. The Andrea crest height was 1.63 times the significant height (average height of the one third highest waves). Optimal focusing of the Andrea wave showed that the crest could have been even higher and limited by breaking at 1.7 times the significant height. This establishes the greatest height rogues can reach for any given (or forecasted) significant height. “Rogue waves are known to have caused loss of life as well as damage to ships and offshore structures,” said Mark Donelan, professor emeritus of ocean sciences at the UM Rosenstiel School. “Our results, while representing the worst-case rogue wave forecast, are new knowledge important for the design and safe operations for ships and platforms at sea.” The study, titled “The Making of the Andrea Wave and other Rogues,” was published in the March 8 issue of the journal Scientific Reports. The authors include: Donelan and Anne-Karin Magnusson from the Norwegian Meteorological Institute. The work was partly performed within the ExWaMar project (ID 256466/O80) funded by the Norwegian Research Council. ConocoPhillips provided the wave data.
|
|
Scooped by
Dr. Stefan Gruenwald
March 7, 2017 4:37 PM
|
It took billions of years for most of the Earth's minerals to form, but scientists say hundreds more have been created in the years since the industrial revolution. Human-made minerals created in the years since the industrial revolution have been uncovered by scientists, who want them to be accepted as real minerals. Armed with the discovery, they are pushing to have the geological time scale recognise 'the Anthropocene' time period — or the epoch of human activity. "We define different periods of Earth history by the distinctive things we find in them," said Robert Hazen, a mineralogist at Washington's Carnegie Institution for Science. "They [the minerals] would tell future geologists that something was different about this layer — I think there is no question about it." The new minerals were created by chance, when substances that would otherwise have never encountered one another came into contact as a result of human activity.
Long-dormant microbes are found inside giant crystals of the Naica mountain caves - and revived. Scientists have extracted long-dormant microbes from inside the famous giant crystals of the Naica mountain caves in Mexico - and revived them. The organisms were likely to have been encased in the striking shafts of gypsum at least 10,000 years ago, and possibly up to 50,000 years ago. It is another demonstration of the ability of life to adapt and cope in the most hostile of environments. "Other people have made longer-term claims for the antiquity of organisms that were still alive, but in this case these organisms are all very extraordinary - they are not very closely related to anything in the known genetic databases," said Dr Penelope Boston. The new director of Nasa's Astrobiology Institute in Moffett Field, California, described her findings here at the annual meeting of the American Association for the Advancement of Science (AAAS). First opened by miners looking for silver and other metals a hundred years ago, the deeply buried Naica caves are a key interest to scientists fascinated by extremophiles - microbes that can thrive in seemingly impossible conditions. The environment is hot (40-60C), humid and acidic. With no light at depth, any lifeform must chemosynthesise to survive. That is, it must derive the energy needed to sustain itself by processing rock minerals. Researchers had identified microbes living in the walls of the caves, but isolating them from inside the metres-long crystals is a surprise. These outsized needles of gypsum have grown over millions of years. They are not perfect. In places they have defects - small voids where fluids have collected and become encased.
Via Kathy Bosiak
|
|
Scooped by
Dr. Stefan Gruenwald
February 16, 2017 1:19 PM
|
Even though it is hotter than the surface of the Sun, the crystallized iron core of the Earth remains solid. A new study from KTH Royal Institute of Technology may finally settle a longstanding debate over how that’s possible, as well as why seismic waves travel at higher speeds between the planet’s poles than through the equator. Spinning within Earth’s molten core is a crystal ball – actually a mass formation of almost pure crystallized iron – nearly the size of the moon. Understanding this strange, unobservable feature of our planet depends on knowing the atomic structure of these crystals – something scientists have been trying to do for years. As with all metals, the atomic-scale crystal structures of iron change depending on the temperature and pressure the metal is exposed to. Atoms are packed into variations of cubic, as well as hexagonal formations. At room temperatures and normal atmospheric pressure, iron is in what is known as a body-centered cubic (BCC) phase, which is a crystal architecture with eight corner points and a center point. But at extremely high pressure the crystalline structures transform into 12-point hexagonal forms, or a close packed (HCP) phase. At Earth’s core, where pressure is 3.5 million times higher than surface pressure – and temperatures are some 6,000 degrees higher – scientists have proposed that the atomic architecture of iron must be hexagonal. Whether BCC iron exists in the center of the Earth has been debated for the last 30 years, and a recent 2014 study ruled it out, arguing that BCC would be unstable under such conditions. However, in a recent study published in Nature Geosciences, researchers at KTH found that iron at Earth’s core is indeed in the BCC phase. Anatoly Belonoshko, a researcher in the Department of Physics at KTH, says that when the researchers looked into larger computational samples of iron than studied previously, characteristics of the BCC iron that were thought to render it unstable wound up doing just the opposite.
|