The last time concentrations of the greenhouse gas carbon dioxide were as high as they are today (around 5 million years ago), big chunks of the seemingly stable East Antarctic ice sheet melted and helped raise global sea levels more than 65 feet higher than they are now, a new study suggests.
Scientists have long known that seas were higher during the Pliocene, a geological epoch that ran from 5.3 million to 2.6 million years ago. At the time, atmospheric carbon dioxide levels were similar to today's 400 parts per million (ppm).
"Overall, it was a warmer climate than today, but similar to what we expect to reach by the end of this century," Carys Cook, at the Grantham Institute for Climate Change at Imperial College London and the study's lead author, said.
The West Antarctic and Greenland ice sheets were likely completely melted at the time, she added. The fate of the East Antarctic ice sheet has been less clear, though at least some of it must have melted to fully account for the highest global sea levels predicted by some reconstructions of the ancient Earth.
Cook and her colleagues studied the chemical composition of sediments drilled from the ocean floor near East Antarctica. They identified the signature of a specific type of rock "only found in large quantities hundreds of kilometers inland from the current ice sheet edge," Cook said.
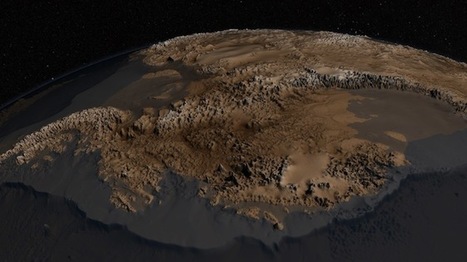
Fretwell et al. 2013Map shows the surface shape of the Antarctic continent once all of the ice has been lifted off to expose the underlying continent. Blues represent areas that lie below sea level, including the Wilkes Subglacial Basin, which in places is up to 2.8 km deep.
The signature was strongest during the warmest phases of the Pliocene. "The only way it could have been eroded is by retreating the East Antarctic ice sheet inland, which means it must have melted significantly," she explained.
Cook and colleagues suggest that much of the ice that melted was in basins that were below sea level, putting it in direct contact with the seawater. As the ocean warmed, the ice was more vulnerable to melting.
That interpretation fits with recent airborne surveys that revealed large under-ice fjords in this part of Antarctica that appeared geologically young and carved by ice, and not as a result of plate tectonics, according to Duncan Young, a geophysicist at the University of Texas at Austin, who flew some of the surveys. "This work reinforces that result," Cook explains.
The new study is also "a shot in favor" of the argument that the East Antarctic ice sheet is less stable than previously believed, "which may be significant for future sea level change estimates," said Duncan, who was not involved in the new research.
Given the similarity between the Pliocene's estimated atmospheric carbon dioxide levels and those of today, scientists consider the epoch an analog for understanding how the present-day climate will evolve.
"What the study shows is that there is a clear record of rapid(-ish) sea level response to past climate shifts," Ted Scambos, an Antarctic ice expert at the National Snow and Ice Data Center in Boulder, Co, said.
While the East Antarctic basins are covered in ice today, they might begin to melt as the oceans continue to warm, Scambos said. He noted that a mile-thick, Colorado-sized chunk of ice sloughing into the ocean would have a "big impact" on sea levels.
"And what we're seeing in other parts of Antarctica and Greenland today tells us that the transitions can be very abrupt by geologic standards," Scambos said. "They are mercifully more manageable by human standards, at least if we decide to start managing."
Researchers have found bacteria beneath the Pacific floor that may be thousands or millions of years old, their metabolism so slow that they’re basically in a state of suspended animation.
Call it survival of the slowest: Extraordinarily old, bizarrely low-key bacteria have been found in sediments 100 feet below the sea floor of the Pacific Ocean, far removed from sunlight, fresh nutrients and what humans would consider anything interesting to do.
Some of these organisms, scientists say, could be at least 1,000 years old. Or maybe millions of years. Their strategy for staying alive is to be barely alive at all. Their metabolism is dialed down to almost nothing, an adaptive advantage in a place with so few resources. The bacteria that survive are the ones that can satisfy themselves with minute traces of oxygen and a parsimonious diet of organic material laid down millions of years ago.
Such buried bacteria have been found before, but a new study, published Thursdayonline by the journal Science, has provided the clearest look at their glacial pace of existence. The conclusion, in short, is that microbes can putter along at extremely low rates of oxygen respiration, their numbers limited only by the paucity of energy available in the buried sediment.
“These organisms live so slowly that when we look at it at our own time scale, it’s like suspended animation,” said Danish scientist Hans Roy, a biologist at Aarhus University and the lead author of the study. “The main lesson here is that we need to stop looking at life at our own time scale.”
An ancillary message is that human beings should not be too chauvinistic about what constitutes, or characterizes, a living thing.
There are a lot more nuances to nature than scientists realized just a few decades ago.
The ingenuity of life gives hope to researchers looking for evidence of life beyond Earth. Extraterrestrial life could conceivably be detected by robotic probes, for example, in the Martian subsurface, or in an ice- covered ocean on a cold moon farther out in the solar system.
For most terrestrial life on Earth, oxygen is necessary for survival. But the planet's atmosphere did not always contain this life-sustaining substance, and one of science's greatest mysteries is how and when oxygenic photosynthesis—the process responsible for producing oxygen on Earth through the splitting of water molecules—first began. Now, a team led by geobiologists at the California Institute of Technology (Caltech) has found evidence of a precursor photosystem involving manganese that predates cyanobacteria, the first group of organisms to release oxygen into the environment via photosynthesis.
The findings, outlined in the June 24, 2013, early edition of the Proceedings of the National Academy of Sciences (PNAS), strongly support the idea that manganese oxidation—which, despite the name, is a chemical reaction that does not have to involve oxygen—provided an evolutionary stepping-stone for the development of water-oxidizing photosynthesis in cyanobacteria.
"Water-oxidizing or water-splitting photosynthesis was invented by cyanobacteria approximately 2.4 billion years ago and then borrowed by other groups of organisms thereafter," explains Woodward Fischer, assistant professor of geobiology at Caltech and a coauthor of the study. "Algae borrowed this photosynthetic system from cyanobacteria, and plants are just a group of algae that took photosynthesis on land, so we think with this finding we're looking at the inception of the molecular machinery that would give rise to oxygen."
Photosynthesis is the process by which energy from the sun is used by plants and other organisms to split water and carbon dioxide molecules to make carbohydrates and oxygen. Manganese is required for water splitting to work, so when scientists began to wonder what evolutionary steps may have led up to an oxygenated atmosphere on Earth, they started to look for evidence of manganese-oxidizing photosynthesis prior to cyanobacteria. Since oxidation simply involves the transfer of electrons to increase the charge on an atom—and this can be accomplished using light or O2—it could have occurred before the rise of oxygen on this planet.
Check out the most detailed map of a continent never truly seen by human eyes: the de-iced surface of Antarctica. By virtually peeling back the frozen ice sheet and studying the land beneath, researchers can get a better sense of how the southern pole of our planet could react to climate change.
Bedmap2 was created by the British Antarctic Survey, and used decades of data to produce this detailed view of the frozen continent. NASA’s contribution to the dataset includes surface measurements from its now-retired orbiting Ice, Cloud, and Land Elevation Satellite (ICESat), and results from several years of flyovers by specialized aircraft that collected radar and other data measuring changes in the thickness of sea ice, glaciers, and ice sheets as part of Operation IceBridge.
The work improves on the decade-old Bedmap project, which virtually thawed the continent, but at lower resolution. Both maps combine information on ice thickness, bedrock topography, and surface elevation. Bedmap2 added millions of extra data points and also covers a wider swath of land than its predecessor. Over on NASA’s site, you can compare the two datasets by sliding between them.
Researchers need good information about the under-ice ground of Antarctica to better simulate its response to changing environmental conditions. Antarctica’s ice is not static but constantly flows to the sea. Knowing the shape of the bedrock and the thickness of the ice allows scientists to model these movements and predict how they could change in the future.
Researchers have developed a new technique for quickly assessing the magnitude of large earthquakes, cutting down the time required in the case of the recent quake in Japan, for example, from about 20 minutes to just 2-3 minutes. Those crucial minutes would have helped with tsunami warnings and in making sure that even far-away communities like Tokyo had proper alerts as soon as possible, says Yehuda Bock of the University of California, San Diego, who developed the technique.
The strategy involves tying together real-time data coming from seismic instruments, which detect shaking, as well as Global Positioning System (GPS) instruments, which detect the absolute movements of the ground. Both devices are already installed in places such as Japan and California — the key is to ensure that they are delivering the right sort of data simultaneously, says Bock, who reported on his progress at the American Geophysical Union (AGU) meeting in San Francisco, California, on 8 December. Bock and his colleagues this month received funding to build and test a prototype upgrade device, and hope to have an initial system in place in California within six months.
Seismic instruments are very sensitive, but have a hard time discriminating between large quakes of magnitude 7 or higher in the first seconds or minutes of an earthquake, because the shaking simply goes off the scale. In the case of the March 2011 Tohoku earthquake in Japan, for example, the Japan Meteorological Agency estimated the quake’s magnitude as just 6.8 after 38 seconds, and 8 after a few minutes, says Bock. It was not until weaker seismic readings from much further away were added to the analysis that they could say, 20 minutes after the quake began, that it was a devastating magnitude 9 — 30 times stronger than a magnitude-8 quake.
Accelerometers add another layer of information, but their data take too long to process to be of use. GPS instruments are more useful. The station closest to the epicentre, for example, showed a 1.5-metre drop of the ground in the first 100 seconds of the quake. “That’s huge,” says Bock. This provides a quick and obvious indication of large vertical ground displacement — the thing that causes tsunamis — and can be combined with seismic data to quickly assess quake size. But most GPS networks were designed to provide long-term data about ground movement, not short-term information during earthquakes; they may be designed to take readings once every 30 minutes and deliver data once a day, for example. And they aren’t necessarily installed next to seismometers. Of Japan’s 1,200 GPS stations — all of which are real time — only 180 are close enough to seismic stations to be of use in this sort of system, and so far they haven’t been utilized this way.
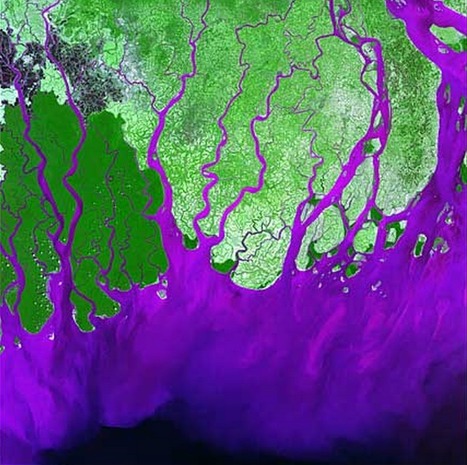
As recently as 5,000 years ago, the Sahara — today a vast desert in northern Africa, spanning more than 3.5 million square miles — was a verdant landscape, with sprawling vegetation and numerous lakes. Ancient cave paintings in the region depict hippos in watering holes, and roving herds of elephants and giraffes — a vibrant contrast with today’s barren, inhospitable terrain.
The Sahara’s “green” era, known as the African Humid Period, likely lasted from 11,000 to 5,000 years ago, and is thought to have ended abruptly, with the region drying back into desert within a span of one to two centuries.
Now researchers at MIT, Columbia University and elsewhere have found that this abrupt climate change occurred nearly simultaneously across North Africa. The team traced the region’s wet and dry periods over the past 30,000 years by analyzing sediment samples off the coast of Africa. Such sediments are composed, in part, of dust blown from the continent over thousands of years: The more dust that accumulated in a given period, the drier the continent may have been.
Water found in a deep, isolated reservoir in Timmins, Ont., has been trapped there for 1.5 billion to 2.64 billion years — since around the time the first multicellular life arose on the planet — Canadian and British scientists say.
The water pouring out of boreholes 2.4 kilometres below the surface in the northern Ontario copper and zinc mine is older than any other free-flowing water ever discovered. It is rich in dissolved gases such as hydrogen and methane that could theoretically provide support for microbial life.
"What we can be sure of is that we have identified a way in which planets can create and preserve an environment friendly to microbial life for billions of years," said a statement from Greg Holland, the Lancaster University geochemist who is the lead author of the study.
His Canadian co-authors included Barbara Sherwood Lollar and Georges Lacrampe-Couloume at the University of Toronto; Greg Slater at McMaster University in Hamilton; and Long Li, who is currently an assistant professor at the University of Alberta, but worked on the project while at the University of Toronto.
Some Canadian members of the team are currently testing the water to see if it contains microbial life — if they exist, those microbes may have been isolated from the sun and the Earth's surface for billions of years and may reveal how microbes evolve in isolation.
Microbes that have been isolated for tens of millions of years have been found in water with similar chemistry at even slightly deeper depths below the surface in a South African gold mine, using hydrogen gas as an energy source, the researchers noted.
The researchers estimated how old the water was based on an analysis of the xenon gas dissolved in it. Like many other elements, xenon comes in forms with different masses, known as isotopes. The water in the Timmins mine contained an unusually high level of lighter isotopes of xenon that are thought to have come from the Earth's atmosphere at the time it became trapped.
Exclusive timelapse: See climate change, deforestation and urban sprawl unfold as Earth evolves over 30 years.
Spacecraft and telescopes are not built by people interested in what’s going on at home. Rockets fly in one direction: up. Telescopes point in one direction: out. Of all the cosmic bodies studied in the long history of astronomy and space travel, the one that got the least attention was the one that ought to matter most to us—Earth.
That changed when NASA created the Landsat program, a series of satellites that would perpetually orbit our planet, looking not out but down. Surveillance spacecraft had done that before, of course, but they paid attention only to military or tactical sites. Landsat was a notable exception, built not for spycraft but for public monitoring of how the human species was altering the surface of the planet. Two generations, eight satellites and millions of pictures later, the space agency, along with the U.S. Geological Survey (USGS), has accumulated a stunning catalog of images that, when riffled through and stitched together, create a high-definition slide show of our rapidly changing Earth. TIME is proud to host the public unveiling of these images from orbit, which for the first time date all the way back to 1984.
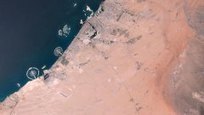
Over here is Dubai, growing from sparse desert metropolis to modern, sprawling megalopolis. Over there are the central-pivot irrigation systems turning the sands of Saudi Arabia into an agricultural breadbasket — a surreal green-on-brown polka-dot pattern in the desert. Elsewhere is the bad news: the high-speed retreat of Mendenhall Glacier in Alaska; the West Virginia Mountains decapitated by the mining industry; the denuded forests of the Amazon, cut to stubble by loggers.
It took the folks at Google to upgrade these choppy visual sequences from crude flip-book quality to true video footage. With the help of massive amounts of computer muscle, they have scrubbed away cloud cover, filled in missing pixels, digitally stitched puzzle-piece pictures together, until the growing, thriving, sometimes dying planet is revealed in all its dynamic churn. The images are striking not just because of their vast sweep of geography and time but also because of their staggering detail. Consider: a standard TV image uses about one-third of a million pixels per frame, while a high-definition image uses 2 million. The Landsat images, by contrast, weigh in at 1.8 trillion pixels per frame, the equivalent of 900,000 high-def TVs assembled into a single mosaic.
These Timelapse pictures tell the pretty and not-so-pretty story of a finite planet and how its residents are treating it — razing even as we build, destroying even as we preserve. It takes a certain amount of courage to look at the videos, but once you start, it’s impossible to look away.
Nobody knows what exploded over Siberia in 1908, but the discovery of the first fragments could finally solve the mystery.
The Tunguska impact event is one of the great mysteries of modern history. The basic facts are well known. On 30 June 1908, a vast and powerful explosion engulfed an isolated region of Siberia near the Podkamennaya Tunguska River.
The blast was 1000 times more powerful than the bomb dropped on Hiroshima, registered 5 on the Richter scale and is thought to have knocked down some 80 million trees over an area of 2000 square kilometres. The region is so isolated, however, that historians recorded only one death and just handful of eyewitness reports from nearby.
But the most mysterious aspect of this explosion is that it left no crater and scientists have long argued over what could have caused it.
The generally accepted theory is that the explosion was the result of a meteorite or comet exploding in the Earth’s atmosphere. That could have caused an explosion of this magnitude without leaving a crater. Such an event would almost certainly have showered the region in fragments of the parent body but no convincing evidence has ever emerged.
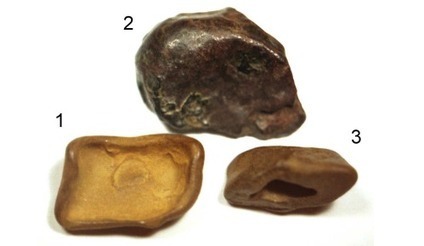
In the 1930s, an expedition to the region led by the Russian mineralogist Leonid Kulik returned with a sample of melted glassy rock containing bubbles. Kulik considered this evidence of an impact event. But the sample was somehow lost and has never undergone modern analysis. As such, there is no current evidence of an impact in the form of meteorites.
That changes today with the extraordinary announcement by Andrei Zlobin from the Russian Academy of Sciences that he has found three rocks from the Tunguska region with the telltale characteristics of meteorites. If he is right, these rocks could finally help solve once and for all what kind of object struck Earth all those years ago.
Zlobin has not yet carried out a detailed chemical analysis of the rocks that would reveal their chemical and isotopic composition. So the world will have to wait for this to get a better idea of the nature of the body.
However, the stony fragments do not rule out a comet since the nucleus could easily contain rock fragments, says Zlobin. Indeed he has calculated that the density of the impactor must have been about 0.6 grams per cubic centimetre, which is about the same as nucleus of Halley’s comet. Zlobin says that together the evidence seems “excellent confirmation of cometary origin of the Tunguska impact.”
Clearly there is more work to be done here, particularly the chemical analysis perhaps with international cooperation and corroboration. Then there is also the puzzle of why Zlobin has waited so long to analyse his samples. It’s not hard to imagine that the political changes that engulfed the Soviet Union in the year after his expedition may have played a role in this, but it still requires some explaining.
Nevertheless, this has the potential to help clear up one of the outstanding mysteries of the 20th century and finally determine the origin of the largest Earth impact in recorded history.
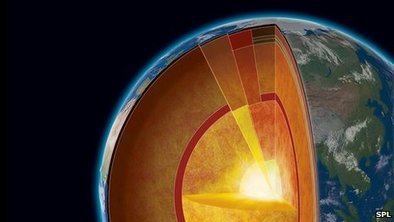
The solid iron core is actually crystalline, surrounded by liquid.
But the temperature at which that crystal can form had been a subject of long-running debate.
Experiments outlined in Science used X-rays to probe tiny samples of iron at extraordinary pressures to examine how the iron crystals form and melt.
Seismic waves captured after earthquakes around the globe can give a great deal of information as to the thickness and density of layers in the Earth, but they give no indication of temperature.
That has to be worked out either in computer models that simulate the Earth's insides, or in the laboratory. Measurements in the early 1990s of iron's "melting curves" - from which the core's temperature can be deduced - suggested a core temperature of about 5,000˚C.
"It was just the beginning of these kinds of measurements so they made a first estimate... to constrain the temperature inside the Earth," said Agnes Dewaele of the French research agency CEA and a co-author of the new research.
"Other people made other measurements and calculations with computers and nothing was in agreement. It was not good for our field that we didn't agree with each other."
The core temperature is crucial to a number of disciplines that study regions of our planet's interior that will never be accessed directly - guiding our understanding of everything from earthquakes to the Earth's magnetic field.
great article since we just spoke about the fact due to the intense pressure that the core of Earth is as hot as the sun's surface--great reinforcement of material being covered
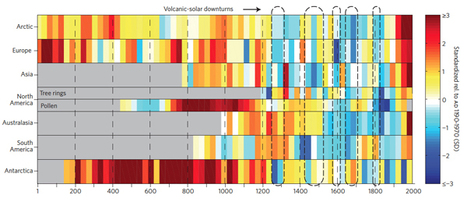
From 1971 to 2000, the world's land areas were the warmest they have been in at least 1,400 years, according to a new study inNature Geoscience. The massive new study, involving 80 researchers from around the world with the Past Global Changes (PAGES) group, is the first to look at continental temperature changes over two thousand years, providing insights into regional climatic changes from the Roman Empire to the modern day. According to the data, Earth's land masses were generally cooling until anthropogenic climate change reversed the long-term pattern in the late-19th Century.
"Even just a few years ago we would have aimed for a single worldwide temperature series," says co-author Ulf Büntgen with the Swiss Federal Research Institute (WSL) and PAGES. "Nowadays, we know how important it is to have a better understanding of regional differences."
Scientists were able to reconstruct continental temperatures across every continent except Africa, where data is still lacking. They found that continents could still show important idiosyncrasies even in the midst of global trends.
"Distinctive periods, such as the Medieval Warm Period or the Little Ice Age stand out, but do not show a globally uniform pattern," explains co-author Heinz Wanner with the University of Bern and a member of PAGES.
The researchers found that such temperature changes occurred during different times on continents. For example, the Medieval Warm Period occurred from around 830 to 1100 AD in the northern hemisphere, but a similar warm-up period doesn't show up in the southern hemisphere until 1160 to 1370 AD, a lag time of 300 years. Meanwhile, the Little Ice Age began decades earlier in the northern hemisphere than in the southern. The oddest continent proved to be Antarctica, which bucked trends elsewhere during several periods.
Looking at the temperature data over 30 years intervals allowed scientists to note that the most recent period (1971-2000) held the title for the warmest on record. Still, zooming into a continental view showed a slightly more diverse picture: for example, temperatures in Europe from 21-80 AD may rival those of 1971-2000. But globally the picture remains the same: over a thousand years of cooling, replaced suddenly by warming beginning in the late 19th Century. According to climatologists, temperatures have risen about 0.8 degrees Celsius (1.4 degrees Fahrenheit) in the last hundred years over land and sea due to burning fossil fuels, deforestation and other land-use changes, and industrial agriculture. The most recent decade was the hottest yet.
Scientists investigate previously unknown sprays of X-rays and bursts of gamma rays.
A lightning bolt is one of nature’s most over-the-top phenomena, rarely failing to elicit at least a ping of awe no matter how many times a person has witnessed one. With his iconic kite-and-key experiments in the mid-18th century, Benjamin Franklin showed that lightning is an electrical phenomenon, and since then the general view has been that lightning bolts are big honking sparks no different in kind from the little ones generated by walking in socks across a carpeted room.
But scientists recently discovered something mind-bending about lightning: Sometimes its flashes are invisible, just sudden pulses of unexpectedly powerful radiation. It’s what Joseph Dwyer, a lightning researcher at the Florida Institute of Technology, has termed dark lightning.
Unknown to Franklin but now clear to a growing roster of lightning researchers and astronomers is that along with bright thunderbolts, thunderstorms unleash sprays of X-rays and even intense bursts of gamma rays, a form of radiation normally associated with such cosmic spectacles as collapsing stars. The radiation in these invisible blasts can carry a million times as much energy as the radiation in visible lightning, but that energy dissipates quickly in all directions rather than remaining in a stiletto-like lightning bolt.
Dark lightning appears sometimes to compete with normal lightning as a way for thunderstorms to vent the electrical energy that gets pent up inside their roiling interiors, Dwyer says. Unlike with regular lightning, though, people struck by dark lightning, most likely while flying in an airplane, would not get hurt. But according to Dwyer’s calculations, they might receive in an instant the maximum safe lifetime dose of ionizing radiation — the kind that wreaks the most havoc on the human body.
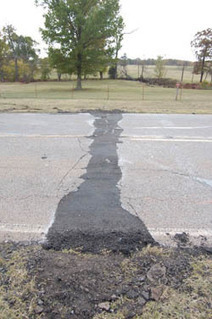
A new study in the journal Geology is the latest to tie a string of unusual earthquakes, in this case, in central Oklahoma, to the injection of wastewater deep underground. Researchers now say that the magnitude 5.7 earthquake near Prague, Okla., on Nov. 6, 2011, may also be the largest ever linked to wastewater injection. Felt as far away as Milwaukee, more than 800 miles away, the quake—the biggest ever recorded in Oklahoma--destroyed 14 homes, buckled a federal highway and left two people injured. Small earthquakes continue to be recorded in the area.
The recent boom in U.S. energy production has produced massive amounts of wastewater. The water is used both in hydrofracking, which cracks open rocks to release natural gas, and in coaxing petroleum out of conventional oil wells. In both cases, the brine and chemical-laced water has to be disposed of, often by injecting it back underground elsewhere, where it has the potential to trigger earthquakes. The water linked to the Prague quakes was a byproduct of oil extraction at one set of oil wells, and was pumped into another set of depleted oil wells targeted for waste storage.
Scientists have linked a rising number of quakes in normally calm parts of Arkansas, Texas, Ohio and Colorado to below-ground injection. In the last four years, the number of quakes in the middle of the United States jumped 11-fold from the three decades prior, the authors of the Geology study estimate. Last year, a group at the U.S. Geological Survey also attributed a remarkable rise in small- to mid-size quakes in the region to humans. The risk is serious enough that the National Academy of Sciences, in a report last year called for further research to “understand, limit and respond” to induced seismic events. Despite these studies, wastewater injection continues near the Oklahoma earthquakes.
The magnitude 5.7 quake near Prague was preceded by a 5.0 shock and followed by thousands of aftershocks. What made the swarm unusual is that wastewater had been pumped into abandoned oil wells nearby for 17 years without incident. In the study, researchers hypothesize that as wastewater replenished compartments once filled with oil, the pressure to keep the fluid going down had to be ratcheted up. As pressure built up, a known fault—known to geologists as the Wilzetta fault--jumped. “When you overpressure the fault, you reduce the stress that’s pinning the fault into place and that’s when earthquakes happen,” said study coauthor Heather Savage, a geophysicist at Columbia University’s Lamont-Doherty Earth Observatory.
Over the last several decades, tropical forests have been cleared and degraded at an accelerating rate, with losses contributing to what is likely to be the sixth global mass extinction in Earth’s history. Deforestation refers to the replacement of forests with different land cover types such as crops or grassland, and forest degradation refers to the substantial reduction of biomass, usually by the removal of big trees, whilst retaining sufficient tree cover to still be classified as ‘forest’. Logging and fire are the major causes of forest degradation in the tropics. Between 2000 and 2005, roughly 27 million hectares of forest in the tropics were cleared, largely for timber or agricultural plantations or crops, and over much the same time period, approximately 398 million hectares were allocated to the industrial logging industry.
The loss and degradation of tropical forests is of great concern because these systems are among the most biodiverse places remaining on Earth - they provide habitat for many species, contain a rich array of plant and animal life not found elsewhere, and play a major role in regulating local as well as global climate and weather patterns. Large rainforest trees are often long lived, with ages commonly exceeding many hundreds of years. These big trees are important for ecosystem health, providing a source of seeds and fruits for species propagation, as well as habitat for a wide range of other organisms. Degradation of primary forest ecosystems, especially by logging, results not only in the disproportionate loss of large trees and the ecosystem functions they provide, but also causes substantial collateral damage to residual vegetation, carbon emissions, damage to soils and waterways, with repeated harvests resulting in progressive degradation. Intact forests, or forests that have not been degraded, are central to sustaining biodiversity.
The Malaysian states of Sabah and Sarawak are global hotspots of tropical deforestation. These two states in the north of the island of Borneo are also centers of the tropical oil palm and industrial logging industries, with Sarawak in particular being the place of origin for many Malaysian logging companies that now operate in Papua New Guinea, The Solomon Islands, tropical Africa and Guyana, amongst other places. In many countries these companies are responsible for unsustainable harvesting and short-term profit maximization. Unsustainable and damaging logging practices, often followed by the conversion of logged forest to oil palm and timber plantations, are particular problems in Sabah and Sarawak.
In contrast to the situation in Sabah and Sarawak, the neighbouring petroleum-rich nation of Brunei has charted a different path, shunning wide-scale intensive logging and oil palm plantations in favor of preserving forest ecosystems. Given the known differences in agro-timber industries among these jurisdictions, it is timely to examine the condition of forests in these regions, and the outcome of the alternative forest-protecting pathway taken by Brunei.
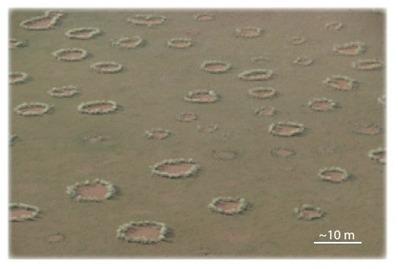
Fairy circles are mysterious barren patches of land that are surrounded by healthy vegetation. The circles are common in many parts of the world but particularly in the arid grasslands of southern Africa where they range in size from 2 metres to 10 metres across (see picture above).
Plant biologists know these circles are stable having watched them over periods of decades. So these structures are clearly no accident. Indeed, exactly why fairy circles appear is something of a mystery. In particular, nobody has been able to explain why the patches are circular and not some other shape.
That changes today thanks to the work of Cristian Fernandez-Oto at the Université libre de Bruxelles in Belgium and a few pals who have used computer simulations to show that fairy circles are emergent patterns that occur naturally when plants compete for water in arid conditions.
Their model is relatively straight forward. It is based on the fact that a single plant can generate a root system below ground that is many times larger than the structure above the surface. The size of these roots determines how close together the plants can grow.
Next they assume that the land can exist in two stable states: either it is uniformly covered in vegetation or uniformly devoid of vegetation.
The interesting behaviour occurs when both states exist at the same time. In that case, there must be a “front” that connects the barren and fertile regions.
Fernandez-Oto and co specifically focus on the behaviour of this front in their model. They show that when a barren region shrinks, the plants along the front get closer together and their root systems begin to interact.
Earth’s upper atmosphere—below freezing, nearly without oxygen, flooded by UV radiation—is no place to live. But last winter, scientists from the Georgia Institute of Technology discovered that billions of bacteria actually thrive up there. Expecting only a smattering of microorganisms, the researchers flew six miles above Earth’s surface in a NASA jet plane. There, they pumped outside air through a filter to collect particles. Back on the ground, they tallied the organisms, and the count was staggering: 20 percent of what they had assumed to be just dust or other particles was alive. Earth, it seems, is surrounded by a bubble of bacteria.
Scientists don’t yet know what the bacteria are doing up there, but they may be essential to how the atmosphere functions, says Kostas Konstantinidis, an environmental microbiologist on the Georgia Tech team. For example, they could be responsible for recycling nutrients in the atmosphere, like they do on Earth. And similar to other particles, they could influence weather patterns by helping clouds form. However, they also may be transmitting diseases from one side of the globe to the other. The researchers found E. coli in their samples (which they think hurricanes lifted from cities), and they plan to investigate whether plagues are raining down on us. If we can find out more about the role of bacteria in the atmosphere, says Ann Womack, a microbial ecologist at the University of Oregon, scientists could even fight climate change by engineering the bacteria to break down greenhouse gases into other, less harmful compounds.
Most astrobiologists believe that life in some form is likely to exist away from Earth. But new research demonstrates that life as we know it on Earth might never have come to exist at all if not for a key element delivered to the planet by meteorites billions of years ago.
Scientists at the University of Washington and the University of South Florida found that during the Hadean and Archean eons – the first two of the four principal eons of the Earth’s earliest history – the heavy bombardment by meteorites provided reactive phosphorus essential for creating the earliest life on Earth.
When released in water, that reactive phosphorus could be incorporated into prebiotic molecules, and the researchers documented its presence in early Archean limestone, showing it was abundant some 3.5 billion years ago.
“The importance of this finding is that it provides the missing ingredient in the origin-of-life recipe: a form of phosphorus that can be readily incorporated into essential biological molecules like nucleic acids and cell-membrane lipids,” said Roger Buick, a UW professor of Earth and space sciences.
The scientists concluded that the meteorites delivered phosphorus in minerals that are not now seen on the surface of the Earth, and these minerals corroded in water to release phosphite, a form of phosphorus seen only on the early Earth.
“Meteorite phosphorus may have been a fuel that provided the energy and phosphorus necessary for the onset of life,” said Pasek. “If this meteoritic phosphorus is added to simple organic compounds, it can generate phosphorus biomolecules identical to those seen in life today.”
He said the research provides a plausible answer for why we don’t see new life forms on Earth today: The conditions under which life arose billions of years ago are no longer present.
“The present research shows that this is indeed the case: Phosphorus chemistry on the early Earth was substantially different billions of years ago than it is today,” he said.
The findings are based on examination of samples from Australia, Zimbabwe, West Virginia, Wyoming and Florida. The presence of phosphite was detected only in the oldest samples, from surface materials and drill cores from the early Archean in Australia.
Tornadoes form under a certain set of weather conditions in which three very different types of air come together in a certain way. Near the ground lies a layer of warm and humid air, along with strong south winds. Colder air and strong west or southwest winds lie in the upper atmosphere. Temperature and moisture differences between the surface and the upper levels create what we call instability. A necessary ingredient for tornado formation. The change in wind speed and direction with height is known as wind shear. This wind shear is linked to the eventual development of rotation from which a tornado may form.
A third layer of hot dry air becomes established between the warm moist air at low levels and the cool dry air aloft. This hot layer acts as a cap and allows the warm air underneath to warm further...making the air even more unstable. Things start to happen when a storm system aloft moves east and begins to lift the various layers. Through this lifting process the cap is removed, thereby setting the stage for explosive thunderstorm development as strong updrafts develop. Complex interactions between the updraft and the surrounding winds may cause the updraft to begin rotating-and a tornado is born.
The Great Plains of the Central United States are uniquely suited to bring all of these ingredients together, and so have become known as "Tornado Alley." The main factors are the Rocky Mountains to the west, the Gulf of Mexico to the south, and a terrain that slopes downward from west to east.
During the spring and summer months southerly winds prevail across the plains. At the origin of those south winds lie the warm waters of the Gulf of Mexico, which provide plenty of warm, humid air needed to fuel severe thunderstorm development. Hot dry air forms over the higher elevations to the west, and becomes the cap as it spreads eastward over the moist Gulf air. Where the dry air and the Gulf air meet near the ground, a boundary known as a dry line forms to the west of Oklahoma. A storm system moving out of the southern Rockies may push the dry line eastward, with severe thunderstorms and tornadoes forming along the dry line or in the moist air just ahead of it.
What is the Fujita Tornado Damage Scale? Dr. T. Theodore Fujita, a pioneer in the study of tornadoes and severe thunderstorm phenomena, developed the Fujita Tornado Damage Scale (F-Scale) to provide estimates of tornado strength based on damage surveys. Since it is extremely difficult to make direct measurements of tornado winds, an estimate of the winds based on damage is the best way to classify them. The new Enhanced Fujita Scale (EF-Scale) addresses some of the limitations identified by meteorologists and engineers since the introduction of the Fujita Scale in 1971. Variability in the quality of construction and different local building codes made classifying tornadoes in a uniform manner difficult. In many cases, these inconsistencies led to overestimates in the strength of tornadoes. The new scale identifies 28 different free standing structures most affected by tornadoes taking into account construction quality and maintenance. The range of tornado intensities remains as before, zero to five, with 'EF0' being the weakest, associated with very little damage and 'EF5' representing complete destruction, which was the case in Greensburg, Kansas on May 4th, 2007, the first tornado classified as 'EF5'. The EF scale was adopted on February 1, 2007.
This article gives insight on some of the biggest tornadoes and the distruction that they left behind. I think that it is very intresting to see the different effects over the years.
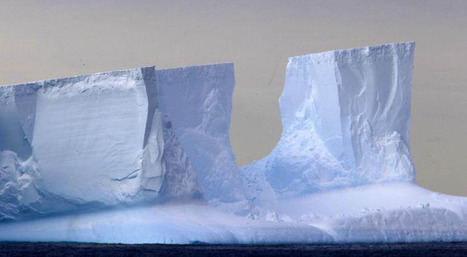
Drilling of the seabed off Antarctica has revealed that rain forest grew on the frozen continent 52 million years ago, scientists said Thursday, warning it could be ice-free again within decades. The study of sediment cores drilled from the ocean floor off Antarctica's east coast revealed fossil pollens that had come from a "near-tropical" forest covering the continent in the Eocene period, 34-56 million years ago. Kevin Welsh, an Australian scientist who traveled on the 2010 expedition, said analysis of temperature-sensitive molecules in the cores had showed it was "very warm" 52 million years ago, measuring about 68 degrees F.
"There were forests existing on the land, there wouldn't have been any ice, it would have been very warm," Welsh said. "It's quite surprising, because obviously our image of Antarctica is that it's very cold and full of ice." Welsh said higher levels of carbon dioxide in the atmosphere were thought to be the major driver of the heat and ice-free conditions on Antarctica, with CO2 estimates of anywhere between 990 to "a couple of thousand" parts per million. CO2 is presently estimated at about 395ppm, and Welsh said the most extreme predictions by the Intergovernmental Panel on Climate Change would see ice again receding on Antarctica "by the end of the century.""It's difficult to say, because that's really controlled by people's and governments' actions," said Welsh, a paleoclimatologist from the University of Queensland.
"It really depends on how emissions go in the future." Welsh described the findings as "very significant" in understanding future climate change, particularly given how important Antarctica and the "very large" volume of water stored on its surface would be for the entire planet."It shows that if we go through periods of higher CO2 in the atmosphere, it's very likely that there will be dramatic changes on these very important areas of the globe where ice currently exists," he said.
This is represents the area and geography Antarctica. This article explains that Antarctica had a rain forest grow in that part of the 34-56 million years ago. Scientists say that this is an extraordinary find and that this could possibly happen in the next couple of decades.
A recent report complied by environmental experts stated an alarming find: The rapid rate in which the Arctic Ocean's ice caps are melting may mean that the sea ice will cease to exist within the next 20-25 years.
Scientists from the National Snow and Ice Data Center (NSIDC) released preliminary figures last week, suggesting that Arctic sea ice has reached it lowest level in recorded history. The Arctic sea ice has been monitored since 1979, and according to the data on September 16th Arctic ice extent noted drop of at least 45% since records began and measured at 3.41 million sq. km.
The previous record low for Arctic sea ice extent, set on September 18, 2007 with a 4.17-million sq.-km. ice cap, was already shattered by the end of August this year when it had melted to below 4-million sq. km.
The depleting ice cover would have serious ramifications for the planet, as Arctic ice acts as a reflector of sunlight, helping regulate the Earth’s temperature and cooling the climate.
“When there’s no longer that sea ice below the air mass and it’s just open ocean, that’s when more moisture off the ocean’s surface gets into the atmosphere and the water vapor in the atmosphere makes for more violent storms,” John Yackel, a sea ice geophysicist and climatologist with the Cryosphere Climate Research Group, explained.
“We can also expect to see an increase in storm frequency and storm intensity for most of the world’s populated places as the Arctic and Earth continues to warm,” he added.
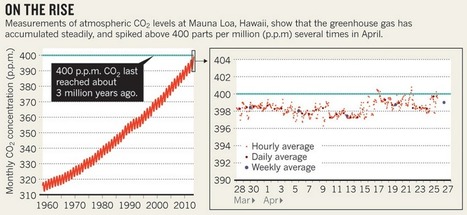
Near the moonscape summit of the Mauna Loa volcano in Hawaii, an infrared analyser will soon make history. Sometime in the next month, it is expected to record a daily concentration of carbon dioxide in the atmosphere of more than 400 parts per million (p.p.m.), a value not reached at this key surveillance point for a few million years.
There will be no balloons or noisemakers to celebrate the event.
Researchers who monitor greenhouse gases will regard it more as a disturbing marker of humanity’s power to alter the chemistry of the atmosphere and by extension, the climate of the planet. At 400 p.p.m., nations will have a difficult time keeping global warming in check, says Corinne Le Quéré, a climate researcher at the University of East Anglia in Norwich, UK, who says that the impact “is getting very dangerously close to reaching the 2 °C target that governments around the world have pledged not to exceed”.
It will be a while, perhaps a few years, before the global CO2 concentration averaged over an entire year, passes 400 p.p.m.. But topping that value at Mauna Loa is significant because researchers have been monitoring the gas there since 1958, longer than any other spot. “It’s a time to take stock of where we are and where we’re going,” says Ralph Keeling, a geochemist at the Scripps Institution of Oceanography in La Jolla, California, who oversees that centre’s CO2 monitoring efforts on Mauna Loa. That gas record, known as the Keeling curve, was started by his father, Charles Keeling.
A new study on the radiation levels in Japanese locals after the Fukushima Daiichi nuclear power plant incident states that Cesium levels in the population are much lower than expected.
Based on studies from the Chernobyl incident in Russia in 1986, researchers anticipated that the levels of Cesium in those exposed to radiation after the meltdown at the Fukushima Daiichi campus to be equivalent with the deposition density, or the activity of a radioactive molecules in an area of ground, which is in Fukushima is reported measured at 2 millisieverts (mSv).
"Findings suggest that the level of internal radiation exposure brought about by pollution from the soil within the Fukushima Prefecture is much less than originally believed. The amount is so negligible that it is difficult to imagine there being any risk to the health," said Ryugo Hayano, a professor at Tokyo University's Science Research Department.
Fear of radiation exposure was rampant in many parts of Japan in the days and weeks after the Fukushima incident, which occurred March 11, 2011 after the largest earthquake in Japan's recorded history unleashed a tsunami that ravaged northeastern Japan's coastal communities and overcame the Daiichi reactors, causing the worst nuclear accident since Chernobyl.
Because more than two years have passed since the Fukushima incident, now the greatest risk from ongoing exposure to radioactive Cesium is through eating food grown in contaminated soil.
But of more than 100,000 people screened with whole-body scanners, the study showed 99.9 percent of them with a committed effective dose (CED) of less than 1 mSv. The safety standard and recommended maximum for artificial radiation exposure is 1 mSv.
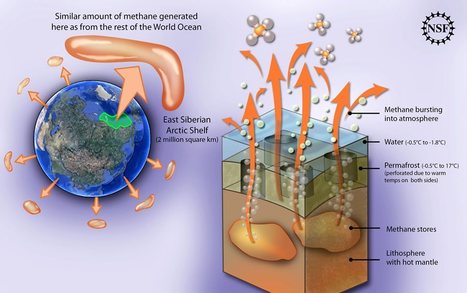
A section of the Arctic Ocean seafloor that holds vast stores of frozen methane is showing signs of instability and widespread venting of the powerful greenhouse gas, according to the findings of an international research team led by University of Alaska Fairbanks scientists Natalia Shakhova and Igor Semiletov.
The research results, published in the March 5, 2013 edition of the journal Science, show that the permafrost under the East Siberian Arctic Shelf, long thought to be an impermeable barrier sealing in methane, is perforated and is starting to leak large amounts of methane into the atmosphere. Release of even a fraction of the methane stored in the shelf could trigger abrupt climate warming.
"The amount of methane currently coming out of the East Siberian Arctic Shelf is comparable to the amount coming out of the entire world's oceans," said Shakhova, a researcher at UAF's International Arctic Research Center. "Subsea permafrost is losing its ability to be an impermeable cap."
Methane is a greenhouse gas more than 30 times more potent than carbon dioxide. It is released from previously frozen soils in two ways. When the organic material (which contains carbon) stored in permafrost thaws, it begins to decompose and, under anaerobic conditions, gradually releases methane. Methane can also be stored in the seabed as methane gas or methane hydrates and then released as subsea permafrost thaws. These releases can be larger and more abrupt than those that result from decomposition.
The East Siberian Arctic Shelf is a methane-rich area that encompasses more than 2 million square kilometers of seafloor in the Arctic Ocean. It is more than three times as large as the nearby Siberian wetlands, which have been considered the primary Northern Hemisphere source of atmospheric methane. Shakhova's research results show that the East Siberian Arctic Shelf is already a significant methane source, releasing 7 teragrams of methane yearly, which is as much as is emitted from the rest of the ocean. A teragram is equal to about 1.1 million tons.
As recently as 5,000 years ago, the Sahara—today a vast desert in northern Africa, spanning more than 3.5 million square miles—was a verdant landscape, with sprawling vegetation and numerous lakes. Ancient cave paintings in the region depict hippos in watering holes, and roving herds of elephants and giraffes—a vibrant contrast with today's barren, inhospitable terrain.
The Sahara's "green" era, known as the African Humid Period, likely lasted from 11,000 to 5,000 years ago, and is thought to have ended abruptly, with the region drying back into desert within a span of one to two centuries. Now researchers at MIT, Columbia University and elsewhere have found that this abrupt climate change occurred nearly simultaneously across North Africa. The team traced the region's wet and dry periods over the past 30,000 years by analyzing sediment samples off the coast of Africa. Such sediments are composed, in part, of dust blown from the continent over thousands of years: The more dust that accumulated in a given period, the drier the continent may have been.
From their measurements, the researchers found that the Sahara emitted five times less dust during the African Humid Period than the region does today. Their results, which suggest a far greater change in Africa's climate than previously estimated, will be published in Earth and Planetary Science Letters. David McGee, an assistant professor in MIT's Department of Earth, Atmospheric and Planetary Sciences, says the quantitative results of the study will help scientists determine the influence of dust emissions on both past and present climate change.
This study, McGee says, is the first in which researchers have combined the two techniques—endmember modeling and thorium-230 normalization—a pairing that produced very precise measurements of dust emissions through tens of thousands of years. In the end, the team found that during some dry periods North Africa emitted more than twice the dust generated today. Through their samples, the researchers found the African Humid Period began and ended very abruptly, consistent with previous findings. However, they found that 6,000 years ago, toward the end of this period, dust emissions were one-fifth today's levels, and far less dusty than previous estimates. McGee says these new measurements may give scientists a better understanding of how dust fluxes relate to climate by providing inputs for climate models. Natalie Mahowald, a professor of earth and atmospheric sciences at Cornell University, says the group's combination of techniques yielded more robust estimates of dust than previous studies. "Dust is one of the most important aerosols for climate and biogeochemistry," Mahowald says. "This study suggests very large fluctuations due to climate over the last 10,000 years, which has enormous implications for human-derived climate change.
To get content containing either thought or leadership enter:
To get content containing both thought and leadership enter:
To get content containing the expression thought leadership enter:
You can enter several keywords and you can refine them whenever you want. Our suggestion engine uses more signals but entering a few keywords here will rapidly give you great content to curate.


 Your new post is loading...