

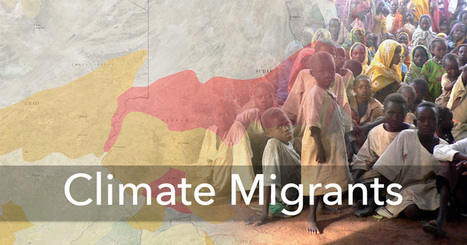

Climate change has already displaced tens of thousands of people. If it continues unabated, it could lead to one of the largest mass human migrations in history.
Get Started for FREE
Sign up with Facebook Sign up with X
I don't have a Facebook or a X account


 Your new post is loading...
 Your new post is loading...
Your new post is loading...
Climate change has already displaced tens of thousands of people. If it continues unabated, it could lead to one of the largest mass human migrations in history. 
No comment yet.
Sign up to comment
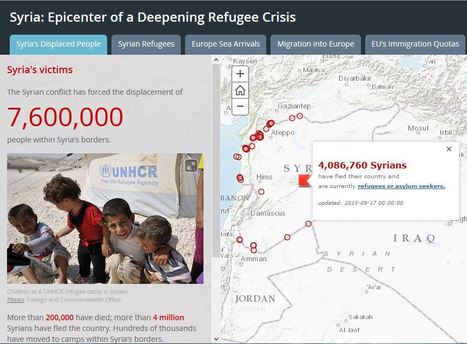
Thousands of refugees, many of them fleeing the brutal conflict in Syria, are streaming across Europe in search of safety and security.

Tanya Townsend's curator insight,
November 23, 2015 11:42 AM
This story map is a great visual of the current refugee crisis. This would be a helpful aid in describing the geographical barriers refugees face and how it affects them. For example the map shows where highest concentrations of deaths occur, naturally it is in the ocean. The ocean is a barrier for fleeing refugees. Think about how different landscapes and land forms can affect refugees available paths to flee
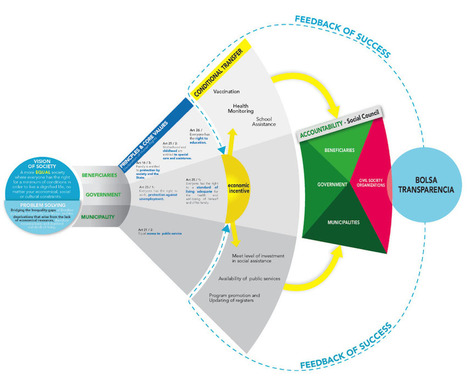
My classmates and I are in the Design for Social Innovation program because we identified problems in our communities, companies, or cultures and are keen to figure them out. But before talking about any solution or outcome, one must first frame the problem—by thoughtfully examining the system it’s part of to understand where and how to get involved. Learning to use systems thinking, a holistic approach to problem solving that emphasizes contextual understanding, has helped me with team management, project planning, creative work, and even relationships. And for wicked problems like healthcare that confront business, nature, and society, it’s proving to be imperative.So, where to even begin? “We have to invent boundaries for clarity and sanity,” advises systems thinking pioneer Donella Meadows. Sometimes a simple infographic works to tell the story. Designing visual maps and models helps us immediately find connections and describe relationships. Creating models helps in seeing the big picture and one's place within it.Via Lauren Moss

Martin (Marty) Smith's comment,
January 28, 2013 7:14 PM
I think "design" and "programming" are rushing at each other at light speed. Web pages will be made from branching if,then,else algorithms soon. Can't just drip paint on a canvas, so design's function will be making those algorithms make visual sense.

Gordon Shupe's curator insight,
February 8, 2013 6:38 AM
Info graphics don't really include digital photography, generally, but they are a fascinating way of displaying understanding, telling a story, and implying solutions. |
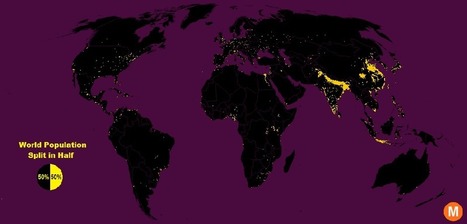
"Data viz extraordinaire Max Galka created this map using NASA’s gridded population data, which counts the global population within each nine-square-mile patch of Earth, instead of within each each district, state, or country border. Out of the 28 million total cells, the ones with a population over 8,000 are colored in yellow."
Tags: population, density, mapping, visualization.

Brian Weekley's curator insight,
July 27, 2016 10:47 AM
Great simple map of world population. Scroll down and look at the U.S. It reflects the global trend. This also has political implications, as evidenced by voting patterns in the 2012 presidential election. Elections are dependent upon votes, which come from people, which are primarily clustered in cities. Election campaigns would use this data to plan their schedules as to where to focus their campaigning efforts. For the folks in Wyoming, they rarely see candidates other than during the primaries. And these world populationclusters have been relatively consistent historically, particularly in south and east Asia. Northern India has serious carrying capacity challenges. Notice the clusters along the Nile- evidence of arable land.
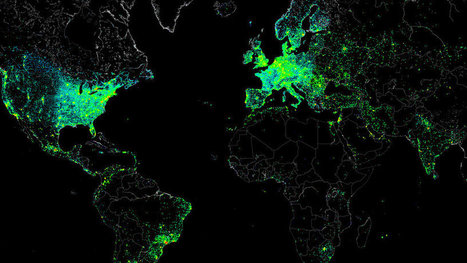
It wasn’t malicious. The file itself was the size of a small JPEG. It was given the absolute lowest priority. And it was set to self-destruct if anything went wrong. But this small file allowed one single hacker to measure the Internet activity of nearly half a million connected devices around the world, then share the results with everyone. How was this even possible? The "hacker" barely hacked anything. In reality, they gained access to all these systems because each had the default "root" set as a password. With this access in hand, they ran several tests focusing on Internet structure and activity. And what they created from all this data is a spectacular map that captures a day in the life of the Internet (and all of its users). Via Lauren Moss

Nacho Vega's curator insight,
May 11, 2013 12:18 PM
Creative power: hacking at the end of the world!
Using "root" as universal key :)) |


