


 Your new post is loading...

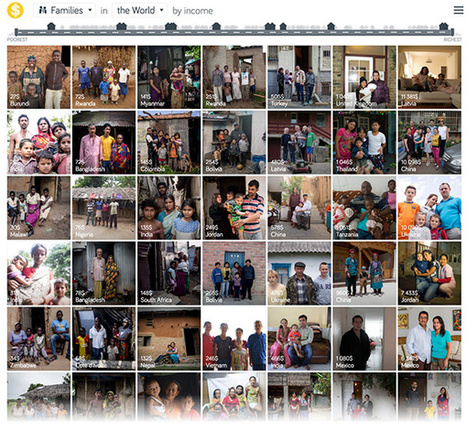

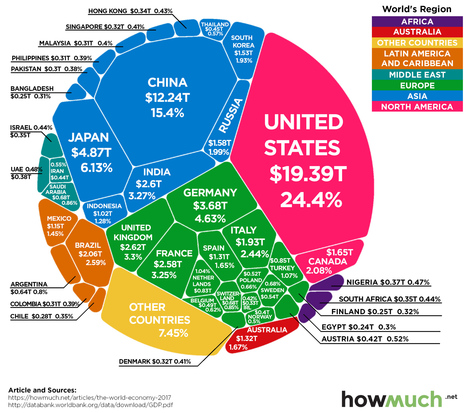
In many geography classes, teachers will assign students a country to help them gain some depth about one particular country as a way to explore economic, demographic, cultural, political, and environmental issues. These are some data visualization tools that deals with big data; the listed tools are some of my favorite in part because they can easily to incorporated to an ArcGIS StoryMap (especially in the Map Journal template).


https://420leafganja.com/product-tag/legit-online-dispensary-shipping-worldwide/
https://420leafganja.com/product-tag/legit-online-dispensary-shipping-worldwide/
https://420leafganja.com/product/edipure-edible-gummies-250mg-thc-5-flavors/
https://420leafganja.com/product/edipure-edible-gummies-250mg-thc-5-flavors/
http://420leafganja.com/product-tag/420-mail-order-marijuana-worldwide-shipping/
https://420leafganja.com/product/peanut-butter-breath/
https://jardinlasvegasofficial.com/product/jardin-dispensary/
https://jardinlasvegasofficial.com/product/jardin-dispensary/
https://danielwalthersaviary.com/product/blue-eyed-cockatoo/
https://danielwalthersaviary.com/product/buffon-macaw/
https://danielwalthersaviary.com/product/buffon-macaw/
https://danielwalthersaviary.com/product/moluccan-cockatoo/
https://danielwalthersaviary.com/product/major-mitchells-cockatoo-for-sale/
https://danielwalthersaviary.com/product/yellow-crested-cockatoo-for-sale/
https://mikabirdsfarm.co.uk/product/cockatoo-for-sale-uk/
https://mikabirdsfarm.co.uk/product/hyacinth-macaw-for-sale-uk/
https://mikabirdsfarm.co.uk/product/african-grey-parrot/
https://mikabirdsfarm.co.uk/product/african-grey-parrot/
https://mikabirdsfarm.co.uk/product-category/african-greys-parrot/
https://mikabirdsfarm.co.uk/
https://mikabirdsfarm.co.uk/product/hyacinth-macaw-for-sale-uk/
https://mikabirdsfarm.co.uk/product/hyacinth-macaw-for-sale-uk/
https://mikabirdsfarm.co.uk/product/buy-dusky-headed-parakeet/
https://mikabirdsfarm.co.uk/product/black-palm-cockatoos/
https://mikabirdsfarm.co.uk/product/black-palm-cockatoos/
Netherland dwarf rabbitsDwarf rabbits are experiencing a surge in popularity as pets, and it’s not hard to see why. These adorable bunnies aren’t just ridiculously cute, they’re also gentle, affectionate, and love being around their humans.buy Netherland dwarf rabbits. legit online dispensary
Netherland dwarf rabbits for saleIf you’re looking for a mini rabbit breed that’ll be the perfect match for your family, check out our list of the best dwarf rabbit breeds. where to buy Netherland dwarf rabbits, dwarf rabbits for sale, buy dwarf rabbits, where to buy dwarf bunnies, Netherland dwarf rabbits for sale in Michigan, buy Netherland dwarf rabbits
baby parrots for sale uk, Blue and Gold Macaw eggs, blue and gold macaw eggs for sale, blue macaw for sale, fertile eggs for sale, fertile parrot eggs for sale, fertile parrot eggs for sale Uk, hyacinth macaw for sale, hyacinth macaw for sale uk, hyacinth macaw price, macaw for sale, macaw for sale uk, macaw parrots for sale uk, macaws for sale, macaws for sale uk, parrot eggs for sale, scarlet macaw for sale
mikabirdsfarm.co.uk/product/african-grey-parrot/
Buy Moustache Parakeet Online, Parakeet, Parakeet Online, Parakeets
https://jointheilluminati.org/
illuminati symbols, illuminati hotties, illuminati hand signs, illuminati tattoo, bloodlines of the illuminati, illuminati confirmed, how to join the illuminati, illuminati gobtwine, illuminati logo, illuminati backwards, illuminati signs, illuminati website
alexandrine parakeet, alexandrine parakeet for sale, alexandrine parakeet price, ringneck alexandrine parakeet
mikabirdsfarm.co.uk/product/african-grey-parrot/
mikabirdsfarm.co.uk/shop/
cockatoo for sale Uk, Moluccan cockatoo for sale uk, umbrella cockatoo for sale uk
alexandrine parakeet, Alexandrine Parakeet for Sale, alexandrine parakeet for sale uk
African greys parrot Tags: African grey parrot cages for sale, African parrot for sale, grey parrot for sale, hand-reared African grey parrot for sale, parrot cages for sale UK, parrot fish for sale, talking parrot for sale
hyacinth macaw, hyacinth macaw for sale, hyacinth macaw for sale UK, hyacinth macaw pricehttps://420leafganja.com/product/cereal-milk-strain/
https://jungleboysfarm.org/product/jungle-cake-strain/
cereal and milk strain, cereal milk cookies strain, cereal milk strain, cereal milk weed strain
Peanut butter breath, peanut butter breath leafly, peanut butter breath seeds, peanut butter breath strain, peanut butter breath weed
http://420leafganja.com/product-tag/buy-pop-naturals-cannabis-oil-cartridges-medical-speed-authority-the-best-online-cannabis-dispensary-order-cannabis-safely-buy-weed-online-buy-weed-in-usa/
https://420leafganja.com/product-tag/420-mail-order-marijuana-worldwide-shipping/
http://420leafganja.com/product/lemon-trainwreck-wax/
https://420leafganja.com/product/buy-kiva-petra-mints-online/
https://420leafganja.com/product/sfv-og/
http://420leafganja.com/product/green-crack-shatter/
chocolate orange cookies, orange cookies strain, orange cookies weed, orange county girl scout cookies
6600 topanga canyon blvd, fire in topanga canyon today, Topanga Canyon, topanga canyon fire, topanga canyon hike, topanga canyon mall, topanga canyon og, topanga canyon road closure today, topanga canyon strain
black palm cockatoo for sale florida, buy birds online canada, citron cockatoo for sale, cockatoo for sale alberta, cockatoo for sale in los angeles, cockatoo for sale ontario canada, cockatoos for adoption in florida, cockatoos for sale on craigslist, major mitchell cockatoo for sale, Moluccan Cockatoo baby for sale, Moluccan Cockatoo for sale, moluccan cockatoo for sale california, moluccan cockatoo for sale Canada, moluccan cockatoo for sale florida, moluccan cockatoo for sale in uae, talking cockatoo for sale
buy Hyacinth Macaw, cheap Hyacinth Macaw for sale, Hyacinth Macaw breeder, Hyacinth Macaw for sale, hyacinth macaw for sale craigslist, Hyacinth Macaw for sale in canada, Hyacinth Macaw for sale in usa, Hyacinth Macaw for sale mexico, hyacinth macaw for sale uk price, hyacinth macaw price breeder
http://420leafganja.com/product-tag/buy-skunk-online-uk/
https://420leafganja.com/product/buy-penis-envy-mushroom/
https://420leafganja.com/product/buy-penis-envy-mushroom/
https://gelatostrainestate.com/
https://gelatostrainestate.com/product/jambo-superfoods/
https://gelatostrainestate.com/product/darth-vader-og/
https://gelatostrainestate.com/product/jambo-superfoods/
http://netherlandsdwarfrabbit.com/product-tag/netherland-dwarf-rabbits-for-sale-in-michigan/
https://netherlandsdwarfrabbit.com/product-tag/free-bunnies-craigslist/
https://netherlandsdwarfrabbit.com/product-tag/free-bunnies-craigslist/
https://jungleboysfarm.org/product/sour-apple-strain/ ;
https://jungleboysfarm.org/product/wedding-cake/
https://jungleboysfarm.org/product/jungle-boys-mac/
https://jungleboysfarm.org/product/hippy-crasher/
https://jungleboysfarm.org/product/florida-og/
https://jungleboysfarm.org/product/frosted-cake/
https://jungleboysfarm.org/product/lava-cake/
https://jungleboysfarm.org/product/motor-breath/
https://jungleboysfarm.org/
https://420leafganja.com/product/buy-blue-cheese-kush/
https://420leafganja.com/product-tag/legit-online-dispensary-shipping-worldwide/
https://420leafganja.com/product/cheeba-chews/
https://420leafganja.com/product/buy-kiva-petra-mints-online/
https://420leafganja.com/product/buy-penis-envy-mushroom/
https://420leafganja.com/product/jambo-superfoods/
https://420leafganja.com/product/edipure-edible-gummies-250mg-thc-5-flavors/
https://420leafganja.com/
https://420leafganja.com/product-tag/buy-skunk-online-uk/
https://420leafganja.com/product/green-crack-shatter/
https://420leafganja.com/product/buy-penis-envy-mushroom/
https://420leafganja.com/product/lemon-trainwreck-wax/
https://420leafganja.com/product-tag/420-mail-order-marijuana-worldwide-shipping/
https://420leafganja.com/product-tag/legit-online-dispensary-shipping-worldwide/
https://420leafganja.com/product-tag/buy-skunk-online-uk/
https://420leafganja.com/product-tag/online-dispensary-shipping-worldwide-reviews/
https://420leafganja.com/product-tag/buy-marijuana-online-australia/
https://420leafganja.com/product-tag/buy-marijuana-online-australia/
https://420leafganja.com/product-tag/420-mail-order-marijuana-worldwide-shipping/
https://420leafganja.com/product-tag/online-dispensary-shipping-worldwide-reviews/
https://420leafganja.com/product-tag/mail-order-marijuana-online-usa/
https://420leafganja.com/product-tag/legit-online-dispensary-shipping-worldwide/
https://420leafganja.com/product-tag/legit-online-dispensary-shipping-worldwide/
https://420leafganja.com/product/edipure-edible-gummies-250mg-thc-5-flavors/
https://420leafganja.com/product/edipure-edible-gummies-250mg-thc-5-flavors/
http://420leafganja.com/product-tag/420-mail-order-marijuana-worldwide-shipping/
http://420leafganja.com/product-tag/buy-pop-naturals-cannabis-oil-cartridges-medical-speed-authority-the-best-online-cannabis-dispensary-order-cannabis-safely-buy-weed-online-buy-weed-in-usa/
https://420leafganja.com/product-tag/420-mail-order-marijuana-worldwide-shipping/
http://420leafganja.com/product/lemon-trainwreck-wax/
https://420leafganja.com/product/buy-kiva-petra-mints-online/
https://420leafganja.com/product/sfv-og/
https://blueberryofficial.org/product/blueberry-cobbler-strain/
http://420leafganja.com/product/green-crack-shatter/
https://blueberryofficial.org/product-tag/moon-rocks-nevada/
https://blueberryofficial.org/product/blueberry-cobbler-strain/
http://420leafganja.com/product-tag/buy-skunk-online-uk/
https://420leafganja.com/product/buy-penis-envy-mushroom/
https://420leafganja.com/product/buy-penis-envy-mushroom/
https://gelatostrainestate.com/
https://gelatostrainestate.com/product/jambo-superfoods/
https://gelatostrainestate.com/product/darth-vader-og/
https://gelatostrainestate.com/product/jambo-superfoods/
http://netherlandsdwarfrabbit.com/product-tag/netherland-dwarf-rabbits-for-sale-in-michigan/
https://netherlandsdwarfrabbit.com/product-tag/free-bunnies-craigslist/
https://netherlandsdwarfrabbit.com/product-tag/free-bunnies-craigslist/
https://jungleboysfarm.org/product/sour-apple-strain/ ;
https://jungleboysfarm.org/product/wedding-cake/
https://jungleboysfarm.org/product/jungle-boys-mac/
https://jungleboysfarm.org/product/hippy-crasher/
https://jungleboysfarm.org/product/florida-og/
https://jungleboysfarm.org/product/frosted-cake/
https://jungleboysfarm.org/product/lava-cake/
https://jungleboysfarm.org/product/motor-breath/
https://jungleboysfarm.org/
https://420leafganja.com/product/buy-blue-cheese-kush/
https://420leafganja.com/product-tag/legit-online-dispensary-shipping-worldwide/
https://420leafganja.com/product/cheeba-chews/
https://420leafganja.com/product/buy-kiva-petra-mints-online/
https://420leafganja.com/product/buy-penis-envy-mushroom/
https://420leafganja.com/product/jambo-superfoods/
https://420leafganja.com/product/edipure-edible-gummies-250mg-thc-5-flavors/
https://420leafganja.com/
https://420leafganja.com/product-tag/buy-skunk-online-uk/
https://420leafganja.com/product/green-crack-shatter/
https://420leafganja.com/product/buy-penis-envy-mushroom/
https://420leafganja.com/product-tag/legit-online-dispensary-shipping-worldwide/
https://420leafganja.com/product/lemon-trainwreck-wax/
jungleboysfarm.org/product/jungle-mints/
https://420leafganja.com/product-tag/420-mail-order-marijuana-worldwide-shipping/
https://420leafganja.com/product-tag/legit-online-dispensary-shipping-worldwide/
https://420leafganja.com/product-tag/buy-skunk-online-uk/
https://420leafganja.com/product-tag/online-dispensary-shipping-worldwide-reviews/
https://420leafganja.com/product-tag/buy-marijuana-online-australia/
https://420leafganja.com/product-tag/buy-marijuana-online-australia/
https://420leafganja.com/product-tag/420-mail-order-marijuana-worldwide-shipping/
https://420leafganja.com/product-tag/online-dispensary-shipping-worldwide-reviews/
Buy Jungle Boys Lava Cake Online, Buy Lava Cake Online, chocolate lava cake near me, chocolate lava crunch cake, domino's chocolate lava cake, dominos lava cake, Lava cake, lava cake dominos, lava cake near me, lava cake strain, lava cake weed
https://megabirdstore.com/bird/buy-amazon-parrot/
https://megabirdstore.com/bird/buy-african-grey/
danielwalthersaviary.com/product/buffon-macaw/
danielwalthersaviary.com/product/yellow-crested-cockatoo-for-sale/
danielwalthersaviary.com/product/major-mitchells-cockatoo-for-sale/
danielwalthersaviary.com/product/blue-eyed-cockatoo/
https://megabirdstore.com/bird/buy-macaw-parrots/
…jungle boys weed, jungle boys strains, jungle boys seeds,
Jungle BoyJungle boys weed
dosidos cookies, dosidos seeds, dosidos strain, dosidos strain yield, girl scout cookies dosidos, Leafly dosidos
Buy Jungle Boys Sour Apple Strain Online, Buy Sour Apple Strain, sour apple haze strain, Sour Apple Strain, sour apple strain review, sour apple weed strain
baby parrots for sale uk, blue macaw for sale, fertile eggs for sale, hyacinth macaw eggs, hyacinth macaw eggs for sale, hyacinth macaw for sale, hyacinth macaw for sale uk, hyacinth macaw price, scarlet macaw for sale
baby parrots for sale uk, blue macaw for sale, Buy African Grey Parrot Eggs, fertile eggs for sale, hyacinth macaw for sale, hyacinth macaw for sale uk, hyacinth macaw price, macaw for sale, macaw for sale uk, macaw parrots for sale uk, macaws for sale, macaws for sale uk, scarlet macaw for sale, umbrella cockatoo for sale uk
Hawaiian wedding cake, jungle boys, jungle boys wedding cake, sims 4 wedding cake, Wedding Cake, wedding cake flavors, wedding cake jungle boys, wedding cake pool steps, wedding cake stand, wedding cake weed
https://420leafganja.com/product-tag/mail-order-marijuana-online-usa/
Buy weed in usa, buy real marijuana online USA, buy skunk online UK, buy weed edibles online USA, Buy weed online, buy weed online Australia, Buy weed online Germany, Buy weed online safely, buy weed online UK, buy weed online USA, buy weed online with worldwide shipping, buy weed online worldwide, buying synthetic weed online, buying weed online, buying weed online reviews, can you buy weed online, edibles worldwide shipping, Legit online dispensary shipping USA, legit online dispensary shipping worldwide, mail order marijuana online USA, Mail order marijuana online with worldwide shipping, mail order weed online, mail order weed online with worldwide shipping, No medical card needed, online dispensary Canada, online dispensary shipping USA, online dispensary shipping worldwide, online dispensary shipping worldwide reviews, online dispensary USA, order moon rock, order weed online with worldwide shipping, order weed safely online, order weed without medical card, recreational-dispensary-near-me, weed for sale
cbd muscle balm, jambo, Jambo superfoods, jambo superfoods cbd, jambo superfoods paypal, jambos, joe rogan jambo superfoods, where can i find jambo superfoods products
buy Cheeba Chews, Cheeba Chews, cheeba chews cbd, cheeba chews green hornet, Cheeba Chews online, cheeba chews reviews, what are cheeba chews
EdiPure Edible Gummies, edipure edibles, edipure edibles for sale, edipure raspberry jellies, edipure review, thc infused gummies, where to buy edipure gummies
420 mail order, 420 Mail order marijuana worldwide shipping, best online dispensary, buy grams of weed online, buy legal weed online USA, buy marijuana online Australia, buy marijuana online Europe, buy marijuana online UK, Buy Marijuana online USA, Buy Marijuana online with worldwide shipping, Buy Marijuana online worldwide shipping, Buy POP Naturals Cannabis Oil Cartridges | Medical Speed Authority the best online cannabis dispensary | Order cannabis safely | Buy weed online | Buy weed in usa, buy real marijuana online USA, buy skunk online UK, buy weed edibles online USA, Buy weed online, buy weed online Australia, Buy weed online Germany, Buy weed online safely, buy weed online UK, buy weed online USA, buy weed online with worldwide shipping, buy weed online worldwide, buying synthetic weed online, buying weed online, buying weed online reviews, can you buy weed online, edibles worldwide shipping, Legit online dispensary shipping USA, legit online dispensary shipping worldwide, mail order marijuana online USA, Mail order marijuana online with worldwide shipping, mail order weed online, mail order weed online with worldwide shipping, No medical card needed, online dispensary Canada, online dispensary shipping USA, online dispensary shipping worldwide, online dispensary shipping worldwide reviews, online dispensary USA, order weed online with worldwide shipping, order weed safely online, weed for sale
QUICK VIEWUNCATEGORIZED
£450.00 QUICK VIEWINCUBATORS
10 Egg Incubator
£100.00 Sale! QUICK VIEWAFRICAN GREY PARROTS
African Grey Parrot
Rated 3.75 out of 5 £1,200.00 £1,000.00 QUICK VIEWAFRICAN GREY PARROTS
African Grey Parrots – Einstein
Rated 3.67 out of 5 £650.00 QUICK VIEWAFRICAN GREY PARROTS
African Greys for sale
Rated 4.50 out of 5 £900.00 QUICK VIEWPARAKEET PARROTS
Alexandrine Parakeet for Sale
£540.00 QUICK VIEWCOCKATOOS
Bare-Eyed Cockatoos
Rated 4.00 out of 5 £500.00 Sale! QUICK VIEWCOCKATOOS
Black Palm Cockatoos
Rated 4.00 out of 5 £20,000.00 £12,000.00 QUICK VIEWMACAWS
Blue and Gold Macaw
£1,200.00 QUICK VIEWPARROT EGGS
Blue and Gold Macaw eggs
£100.00 QUICK VIEWPARROT EGGS
Buy African Grey Parrot Eggs
£60.00 QUICK VIEWPARROT EGGS
Buy blue throated macaw eggs
£70.00If you’re looking for a mini rabbit breed that’ll be the perfect match for your family, check out our list of the best dwarf rabbit breeds. where to buy Netherland dwarf rabbits, dwarf rabbits for sale, buy dwarf rabbits, where to buy dwarf bunnies, Netherland dwarf rabbits for sale in Michigan, buy Netherland dwarf rabbits Dogs can be mischievous, so make sure your house or apartment is safe for a little furry explorer. There are tons of tips for puppy-prep,boxer puppies for sale near me, boxer puppies for sale in az, boxer puppies for sale craigslist, boxer puppies for sale in pa, cheap boxer puppies for sale, boxer puppies for sale in michigan, boxer mix puppies for sale near me, boxer puppies for sale in texas, boxer puppies for sale in california, mini boxer puppies for sale, akc boxer puppies for sale, boxer puppies for sale in nj, boxer puppies for sale in alabama check them out before choosing your new puppy.
https://nationalboxerpuppiesrescue.com/
https://josephbreedersfarm.com/product/umbrella-cockatoo/
boxer puppies for sale near me
https://420leafganja.com/product-tag/legit-online-dispensary-shipping-worldwide/
https://420leafganja.com/product-tag/legit-online-dispensary-shipping-worldwide/
https://420leafganja.com/product/edipure-edible-gummies-250mg-thc-5-flavors/
https://420leafganja.com/product/edipure-edible-gummies-250mg-thc-5-flavors/
http://420leafganja.com/product-tag/420-mail-order-marijuana-worldwide-shipping/
https://420leafganja.com/product/peanut-butter-breath/
https://jardinlasvegasofficial.com/product/jardin-dispensary/
https://jardinlasvegasofficial.com/product/jardin-dispensary/
https://danielwalthersaviary.com/product/blue-eyed-cockatoo/
danielwalthersaviary.com/product/yellow-crested-cockatoo-for-sale/
danielwalthersaviary.com/product/yellow-crested-cockatoo-for-sale/
danielwalthersaviary.com/product/buffon-macaw/
danielwalthersaviary.com/product/moluccan-cockatoo/
danielwalthersaviary.com/product/moluccan-cockatoo/
danielwalthersaviary.com/product/blue-eyed-cockatoo/
cockatoo for sale near me
https://danielwalthersaviary.com/product/buffon-macaw/
https://danielwalthersaviary.com/product/buffon-macaw
https://goldenretrieverwelpen.xyz/
https://danielwalthersaviary.com/product/blue-eyed-cockatoo/
jungle boyz
cancer drug keytruda, cervical cancer, Keytruda, keytruda cancer drug, lung cancer, merck access program keytruda
chronic lymphocytic leukaemia, imbruvica, imbruvica cost, imbruvica package insert, imbruvica side effects, mantle cell lymphoma, side effects of imbruvica, Waldenstrӧ, what is imbruvica used for
https://cancermedics.com/product/imbruvica/
https://cancermedics.com/product/keytruda/
https://cancermedics.com/product/avastin/
https://cancermedics.com/product-category/nitrile-gloves/
https://cancermedics.com/product-category/cancer-drugs/cervical-cancer/
https://cancermedics.com/product/imbruvica/
https://cancermedics.com/product/keytruda/
https://cancermedics.com/product/keytruda/
https://cancermedics.com/product/ibrance/
jungle boys
https://danielwalthersaviary.com/product/moluccan-cockatoo/
https://danielwalthersaviary.com/product/major-mitchells-cockatoo-for-sale/
https://danielwalthersaviary.com/product/yellow-crested-cockatoo-for-sale/
https://mikabirdsfarm.co.uk/product/cockatoo-for-sale-uk/
https://mikabirdsfarm.co.uk/product/hyacinth-macaw-for-sale-uk/
https://mikabirdsfarm.co.uk/product/african-grey-parrot/
https://mikabirdsfarm.co.uk/product/african-grey-parrot/
https://mikabirdsfarm.co.uk/product-category/african-greys-parrot/
https://mikabirdsfarm.co.uk/
parrot for sale uk
macaw for sale
african grey parrot for sale
cockatoo for sale
cockatoo for sale uk
talking parrots for sale uk
https://mikabirdsfarm.co.uk/product/hyacinth-macaw-for-sale-uk/
https://mikabirdsfarm.co.uk/product/hyacinth-macaw-for-sale-uk/
https://mikabirdsfarm.co.uk/product/buy-dusky-headed-parakeet/
https://mikabirdsfarm.co.uk/product/black-palm-cockatoos/
https://mikabirdsfarm.co.uk/product/black-palm-cockatoos/
baby parrots for sale uk, Blue and Gold Macaw eggs, blue and gold macaw eggs for sale, blue macaw for sale, fertile eggs for sale, fertile parrot eggs for sale, fertile parrot eggs for sale Uk, hyacinth macaw for sale, hyacinth macaw for sale uk, hyacinth macaw price, macaw for sale, macaw for sale uk, macaw parrots for sale uk, macaws for sale, macaws for sale uk, parrot eggs for sale, scarlet macaw for sale
Each Puppy comes to you with a health guarantee and this serves as an assurance. Please keep in that as long as you are a Boxer Puppies Lover we are ready to talk to you, weather or not you want to buy or just want to get info about the breed, do not hesitate to contact us..boxer puppies, boxer puppies for sale, boxer puppies for sale, boxer puppies for sale in az, boxer puppies near me, boxer puppies for sale craigslist, boxer puppies for sale in pa, boxer mix puppies Cheap boxer puppies for sale Boxer puppies for sale
There are tons of tips for puppy-prep,boxer puppies for sale near me, boxer puppies for sale in az, boxer puppies for sale craigslist, boxer puppies for sale in pa, cheap boxer puppies for sale, boxer puppies for sale in michigan, boxer mix puppies for sale near me, boxer puppies for sale in texas, boxer puppies for sale in california, mini boxer puppies for sale, akc boxer puppies for sale, boxer puppies for sale in nj, boxer puppies for sale in alabama check them out before choosing your new puppy.mikabirdsfarm.co.uk/product/african-grey-parrot/
Buy Moustache Parakeet Online, Parakeet, Parakeet Online, Parakeets
African grey parrots, African Greys for sale, african greys for sale cheap, african greys for sale uk, all star parrots, baby african greys for sale, baby parrots for sale, breeding african greys for sale, cheap african grey parrots for sale, parrots drumble, parrots for sale, parrots for sale glasgow, parrots for sale london, parrots for sale near me, parrots for sale scotland, parrots for sale uk, parrots minecraft, problem parrots, quaker parrots, scarletts parrots, small african parrots that are often kept in aviaries, small parrots, talking parrots for sale, types of parrots, what do parrots eat
alexandrine parakeet, alexandrine parakeet for sale, alexandrine parakeet price, ringneck alexandrine parakeet
mikabirdsfarm.co.uk/product/african-grey-parrot/
mikabirdsfarm.co.uk/shop/
cockatoo for sale Uk, Moluccan cockatoo for sale uk, umbrella cockatoo for sale uk
alexandrine parakeet, Alexandrine Parakeet for Sale, alexandrine parakeet for sale uk
African greys parrot Tags: African grey parrot cages for sale, African parrot for sale, grey parrot for sale, hand-reared African grey parrot for sale, parrot cages for sale UK, parrot fish for sale, talking parrot for sale
hyacinth macaw, hyacinth macaw for sale, hyacinth macaw for sale UK, hyacinth macaw pricehttps://420leafganja.com/product/cereal-milk-strain/
golden retriever welpen
golden retriever
golden retriever welpen kaufen
https://jungleboysfarm.org/product/jungle-cake-strain/
cereal and milk strain, cereal milk cookies strain, cereal milk strain, cereal milk weed strain
Peanut butter breath, peanut butter breath leafly, peanut butter breath seeds, peanut butter breath strain, peanut butter breath weed
http://420leafganja.com/product-tag/buy-pop-naturals-cannabis-oil-cartridges-medical-speed-authority-the-best-online-cannabis-dispensary-order-cannabis-safely-buy-weed-online-buy-weed-in-usa/
https://420leafganja.com/product-tag/420-mail-order-marijuana-worldwide-shipping/
http://420leafganja.com/product/lemon-trainwreck-wax/
https://420leafganja.com/product/buy-kiva-petra-mints-online/
https://420leafganja.com/product/sfv-og/
http://420leafganja.com/product/green-crack-shatter/
chocolate orange cookies, orange cookies strain, orange cookies weed, orange county girl scout cookies
6600 topanga canyon blvd, fire in topanga canyon today, Topanga Canyon, topanga canyon fire, topanga canyon hike, topanga canyon mall, topanga canyon og, topanga canyon road closure today, topanga canyon strain
black palm cockatoo for sale florida, buy birds online canada, citron cockatoo for sale, cockatoo for sale alberta, cockatoo for sale in los angeles, cockatoo for sale ontario canada, cockatoos for adoption in florida, cockatoos for sale on craigslist, major mitchell cockatoo for sale, Moluccan Cockatoo baby for sale, Moluccan Cockatoo for sale, moluccan cockatoo for sale california, moluccan cockatoo for sale Canada, moluccan cockatoo for sale florida, moluccan cockatoo for sale in uae, talking cockatoo for sale
buy Hyacinth Macaw, cheap Hyacinth Macaw for sale, Hyacinth Macaw breeder, Hyacinth Macaw for sale, hyacinth macaw for sale craigslist, Hyacinth Macaw for sale in canada, Hyacinth Macaw for sale in usa, Hyacinth Macaw for sale mexico, hyacinth macaw for sale uk price, hyacinth macaw price breeder
http://420leafganja.com/product-tag/buy-skunk-online-uk/
https://420leafganja.com/product/buy-penis-envy-mushroom/
https://420leafganja.com/product/buy-penis-envy-mushroom/
https://gelatostrainestate.com/
https://gelatostrainestate.com/product/jambo-superfoods/
https://gelatostrainestate.com/product/darth-vader-og/
https://gelatostrainestate.com/product/jambo-superfoods/
http://netherlandsdwarfrabbit.com/product-tag/netherland-dwarf-rabbits-for-sale-in-michigan/
https://netherlandsdwarfrabbit.com/product-tag/free-bunnies-craigslist/
https://netherlandsdwarfrabbit.com/product-tag/free-bunnies-craigslist/
https://jungleboysfarm.org/product/sour-apple-strain/ ;
https://jungleboysfarm.org/product/wedding-cake/
https://jungleboysfarm.org/product/jungle-boys-mac/
https://jungleboysfarm.org/product/hippy-crasher/
https://jungleboysfarm.org/product/florida-og/
https://jungleboysfarm.org/product/frosted-cake/
https://jungleboysfarm.org/product/lava-cake/
https://jungleboysfarm.org/product/motor-breath/
https://jungleboysfarm.org/
https://420leafganja.com/product/buy-blue-cheese-kush/
https://420leafganja.com/product-tag/legit-online-dispensary-shipping-worldwide/
https://420leafganja.com/product/cheeba-chews/
https://420leafganja.com/product/buy-kiva-petra-mints-online/
https://420leafganja.com/product/buy-penis-envy-mushroom/
https://420leafganja.com/product/jambo-superfoods/
https://420leafganja.com/product/edipure-edible-gummies-250mg-thc-5-flavors/
https://420leafganja.com/
https://420leafganja.com/product-tag/buy-skunk-online-uk/
https://420leafganja.com/product/green-crack-shatter/
https://420leafganja.com/product/buy-penis-envy-mushroom/
https://420leafganja.com/product/lemon-trainwreck-wax/
https://420leafganja.com/product-tag/420-mail-order-marijuana-worldwide-shipping/
https://420leafganja.com/product-tag/legit-online-dispensary-shipping-worldwide/
https://420leafganja.com/product-tag/buy-skunk-online-uk/
https://420leafganja.com/product-tag/online-dispensary-shipping-worldwide-reviews/
https://420leafganja.com/product-tag/buy-marijuana-online-australia/
https://420leafganja.com/product-tag/buy-marijuana-online-australia/
https://420leafganja.com/product-tag/420-mail-order-marijuana-worldwide-shipping/
https://420leafganja.com/product-tag/online-dispensary-shipping-worldwide-reviews/
https://420leafganja.com/product-tag/mail-order-marijuana-online-usa/
https://420leafganja.com/product-tag/legit-online-dispensary-shipping-worldwide/
https://420leafganja.com/product-tag/legit-online-dispensary-shipping-worldwide/
https://420leafganja.com/product/edipure-edible-gummies-250mg-thc-5-flavors/
https://420leafganja.com/product/edipure-edible-gummies-250mg-thc-5-flavors/
http://420leafganja.com/product-tag/420-mail-order-marijuana-worldwide-shipping/
http://420leafganja.com/product-tag/buy-pop-naturals-cannabis-oil-cartridges-medical-speed-authority-the-best-online-cannabis-dispensary-order-cannabis-safely-buy-weed-online-buy-weed-in-usa/
https://mikabirdsfarm.co.uk/
https://mikabirdsfarm.co.uk/product/black-palm-cockatoos/
https://mikabirdsfarm.co.uk/product/buy-dusky-headed-parakeet/
https://mikabirdsfarm.co.uk/product/caparrotua-cockatoo/
https://mikabirdsfarm.co.uk/product/cockatoo-for-sale-uk/
https://mikabirdsfarm.co.uk/product/eclectus-parrot-for-sale-uk/
https://mikabirdsfarm.co.uk/product/green-winged-macaw/
https://mikabirdsfarm.co.uk/product/hyacinth-macaw/
https://mikabirdsfarm.co.uk/product/african-grey-parrot/
http://420leafganja.com/product-tag/buy-skunk-online-uk/
https://420leafganja.com/product/buy-penis-envy-mushroom/
https://420leafganja.com/product/buy-penis-envy-mushroom/
https://gelatostrainestate.com/
Gelato cake strain
https://gelatostrainestate.com/product/jambo-superfoods/
https://gelatostrainestate.com/product/darth-vader-og/
https://gelatostrainestate.com/product/jambo-superfoods/
http://netherlandsdwarfrabbit.com/product-tag/netherland-dwarf-rabbits-for-sale-in-michigan/
https://netherlandsdwarfrabbit.com/product-tag/free-bunnies-craigslist/
https://netherlandsdwarfrabbit.com/product-tag/free-bunnies-craigslist/
https://jungleboysfarm.org/product/sour-apple-strain/ ;
https://jungleboysfarm.org/product/wedding-cake/
https://jungleboysfarm.org/product/jungle-boys-mac/
https://jungleboysfarm.org/product/hippy-crasher/
https://jungleboysfarm.org/product/florida-og/
https://jungleboysfarm.org/product/frosted-cake/
https://jungleboysfarm.org/product/lava-cake/
https://jungleboysfarm.org/product/motor-breath/
https://jungleboysfarm.org/
https://420leafganja.com/product/buy-blue-cheese-kush/
https://420leafganja.com/product-tag/legit-online-dispensary-shipping-worldwide/
https://420leafganja.com/product/cheeba-chews/
https://420leafganja.com/product/buy-kiva-petra-mints-online/
https://420leafganja.com/product/buy-penis-envy-mushroom/
https://420leafganja.com/product/jambo-superfoods/
https://420leafganja.com/product/edipure-edible-gummies-250mg-thc-5-flavors/
https://420leafganja.com/
https://420leafganja.com/product-tag/buy-skunk-online-uk/
https://420leafganja.com/product/green-crack-shatter/
https://420leafganja.com/product/buy-penis-envy-mushroom/
https://420leafganja.com/product-tag/legit-online-dispensary-shipping-worldwide/
https://420leafganja.com/product/lemon-trainwreck-wax/
jungleboysfarm.org/product/jungle-mints/
jungle boys dispensary
jungle boys strain
jungle boys weed
jungle boys seeds
jungle cake strain
https://420leafganja.com/product-tag/420-mail-order-marijuana-worldwide-shipping/
https://420leafganja.com/product-tag/legit-online-dispensary-shipping-worldwide/
https://420leafganja.com/product-tag/buy-skunk-online-uk/
https://420leafganja.com/product-tag/online-dispensary-shipping-worldwide-reviews/
https://420leafganja.com/product-tag/buy-marijuana-online-australia/
https://420leafganja.com/product-tag/buy-marijuana-online-australia/
https://420leafganja.com/product-tag/420-mail-order-marijuana-worldwide-shipping/
https://420leafganja.com/product-tag/online-dispensary-shipping-worldwide-reviews/
Buy Jungle Boys Lava Cake Online, Buy Lava Cake Online, chocolate lava cake near me, chocolate lava crunch cake, domino's chocolate lava cake, dominos lava cake, Lava cake, lava cake dominos, lava cake near me, lava cake strain, lava cake weed
https://megabirdstore.com/bird/buy-amazon-parrot/
https://megabirdstore.com/parrot/crimson-bellied-conure-for-sale/
https://megabirdstore.com/
https://megabirdstore.com/parrot/buy-african-grey-parrot-eggs/
https://megabirdstore.com/
cockatoo for sale uk
https://mikabirdsfarm.co.uk/
https://mikabirdsfarm.co.uk/product/african-grey-parrot/
https://mikabirdsfarm.co.uk/product/african-grey-parrot/
https://megabirdstore.com/bird/buy-african-grey/
danielwalthersaviary.com/product/buffon-macaw/
danielwalthersaviary.com/product/yellow-crested-cockatoo-for-sale/
danielwalthersaviary.com/product/major-mitchells-cockatoo-for-sale/
danielwalthersaviary.com/product/blue-eyed-cockatoo/
https://megabirdstore.com/bird/buy-macaw-parrots/
cockatoo for sale
https://paul-ragdollkittens.com/
https://top-bengalkittens.com/
https://mikabirdsfarm.co.uk/
parrot for sale uk
macaw for sale
african grey parrot for sale
cockatoo for sale
cockatoo for sale uk
talking parrots for sale uk
…jungle boys weed, jungle boys strains, jungle boys seeds, Jungle Boy
Jungle boys weed, jungle boys seeds, jungle cake strain, kush sorbet strain, jungle boys seeds
jungle boys carts jungle boys packaging jungle boys seeds for saledosidos cookies, dosidos seeds, dosidos strain, dosidos strain yield, girl scout cookies dosidos, Leafly dosidos
Buy Jungle Boys Sour Apple Strain Online, Buy Sour Apple Strain, sour apple haze strain, Sour Apple Strain, sour apple strain review, sour apple weed strain
baby parrots for sale uk, blue macaw for sale, fertile eggs for sale, hyacinth macaw eggs, hyacinth macaw eggs for sale, hyacinth macaw for sale, hyacinth macaw for sale uk, hyacinth macaw price, scarlet macaw for sale
baby parrots for sale uk, blue macaw for sale, Buy African Grey Parrot Eggs, fertile eggs for sale, hyacinth macaw for sale, hyacinth macaw for sale uk, hyacinth macaw price, macaw for sale, macaw for sale uk, macaw parrots for sale uk, macaws for sale, macaws for sale uk, scarlet macaw for sale, umbrella cockatoo for sale uk
Hawaiian wedding cake, jungle boys, jungle boys wedding cake, sims 4 wedding cake, Wedding Cake, wedding cake flavors, wedding cake jungle boys, wedding cake pool steps, wedding cake stand, wedding cake weed
https://420leafganja.com/product-tag/mail-order-marijuana-online-usa/
420 mail order,
ragdoll kittens, ragdoll kittens for sale, ragdoll kittens for sale near me, ragdoll kittens for adoption, how much are ragdoll kittens, ragdoll kittens for sale ohio, ragdoll kittens for sale in wisconsin, ragdoll kittens for sale in georgia, ragdoll kittens iowa, ragdoll kittens ct, ragdoll kittens for sale indiana, ragdoll kittens mn, ragdoll kittens for sale illinois, ragdoll kittens colorado, free ragdoll kittens, ragdoll kittens for sale california, ragdoll kittens texas, ragdoll kittens for sale in ky, ragdoll kittens price, ragdoll mix kittens, ragdoll kittens michigan
.shihpoo puppies for sale
shihpoo for sale
shih poo puppies for sale
shih poo for sale
mikabirdsfarm.co.uk/product/african-grey-parrot/
https://dalgonashihpoopuppies.com/available-puppies/ ;
https://dalgonashihpoopuppies.com/available-puppies/ ;
https://mikabirdsfarm.co.uk/product/buy-dusky-headed-parakeet/
https://mikabirdsfarm.co.uk/product/caparrotua-cockatoo/
african grey parrots for sale, african grey parrots for sale uk, baby macaw parrots for sale uk, baby parrots for sale uk, cockatoo for sale uk, eclectus parrots for sale uk, hand reared parrots for sale uk, macaw parrots for sale uk, minecraft parrots, moluccan cockatoo for sale uk, parrots for sale, parrots for sale near me, parrots for sale scotland, parrots for sale uk, quaker parrots for sale uk, scarletts parrots, talking parrots for sale uk, types of parrots, umbrella cockatoo for sale uk, what do parrots eat black palm cockatoo, black palm cockatoo birds sale, black palm cockatoo breeder, black palm cockatoo breeders, black palm cockatoo buy, black palm cockatoo cost, black palm cockatoo for sale, black palm cockatoo for sale uk, black palm cockatoo pet, black palm cockatoo price, black palm cockatoo sale, black palm cockatoo talking, buy black palm cockatoo
African Grey, African Grey Breeder Tags: african grey for sale, african grey pair for sale, african grey parrot breeder usa, african grey parrot for sale, african grey parrots eggs for sale, Buy congo african grey parrots, Congo African Grey For Sale, congo african grey for sale in uk, hand fed african grey parrots chicks for sale, talking african grey parrot for sale, usa parrotbreeders Blue Eyed Cockatoo Tags: baby cockatoo for sale, baby cockatoo for sale canada, baby cockatoo for sale ontario, bare eyed cockatoo for sale, Blue Eyed cockatoo breeder, Blue Eyed cockatoo for sale babies for sale, Blue Eyed cockatoo for sale in usa, Blue Eyed cockatoo for sale near me, blue eyed cockatoo pet, blue-eyed umbrella cockatoo, buy Blue Eyed cockatoo, cockatoo for sale in usa, cockatoo for sale toronto, rare blue cockatoo for sale, talking cockatoo for sale, umbrella cockatoo for saleblack palm cockatoo birds sale, black palm cockatoo breeder, black palm cockatoo breeders, black palm cockatoo buy, black palm cockatoo cost, black palm cockatoo for sale, black palm cockatoo for sale uk, black palm cockatoo pet, black palm cockatoo price, black palm cockatoo sale, black palm cockatoo talking, buy black palm cockatoo
african grey parrots for sale, african grey parrots for sale uk, baby macaw parrots for sale uk, baby parrots for sale uk, cockatoo for sale uk, eclectus parrots for sale uk, hand reared parrots for sale uk, macaw parrots for sale uk, minecraft parrots, moluccan cockatoo for sale uk, parrots for sale, parrots for sale near me, parrots for sale scotland, parrots for sale uk, quaker parrots for sale uk, scarletts parrots, talking parrots for sale uk, types of parrots, umbrella cockatoo for sale uk, what do parrots eat
african grey parrots for sale, african grey parrots for sale uk, African greys parrot Tags: african grey parrot cages for sale, african parrot for sale, baby macaw parrots for sale uk, baby parrots for sale uk, eclectus parrots for sale uk, grey parrot for sale, hand reared african grey parrot for sale, hand reared parrots for sale uk, macaw parrots for sale uk, minecraft parrots, parrot cages for sale uk, parrot fish for sale, parrots for sale, parrots for sale near me, parrots for sale scotland, parrots for sale uk, quaker parrots for sale uk, scarletts parrots, talking parrot for sale, talking parrots for sale uk, types of parrots, what do parrots eat
https://mikabirdsfarm.co.uk/product/african-grey-parrot/
https://mikabirdsfarm.co.uk/product/black-palm-cockatoos/
https://mikabirdsfarm.co.uk/product/african-grey-parrot/
parrots for sale uk
cockatoo for sale
african grey parrots for sale
african greys for sale
parrots for sale uk
african grey parrot for sale
african grey for sale
https://mikabirdsfarm.co.uk/product/cockatoo-for-sale-uk/
https://mikabirdsfarm.co.uk/
https://mikabirdsfarm.co.uk/product/african-grey-parrot/
https://mikabirdsfarm.co.uk/product/cockatoo-for-sale-uk/
https://mikabirdsfarm.co.uk/product/hyacinth-macaw-for-sale-uk/
https://mikabirdsfarm.co.uk/product/african-grey-parrot/
https://mikabirdsfarm.co.uk/product/african-grey-parrot/
https://mikabirdsfarm.co.uk/product-category/african-greys-parrot/
https://mikabirdsfarm.co.uk/
https://mikabirdsfarm.co.uk/product/hyacinth-macaw-for-sale-uk/
https://mikabirdsfarm.co.uk/product/hyacinth-macaw-for-sale-uk/
https://mikabirdsfarm.co.uk/product/buy-dusky-headed-parakeet/
https://mikabirdsfarm.co.uk/product/black-palm-cockatoos/
https://mikabirdsfarm.co.uk/product/black-palm-cockatoos/
baby parrots for sale uk, Blue and Gold Macaw eggs, blue
https://mikabirdsfarm.co.uk/product/cockatoo-for-sale-uk/
https://mikabirdsfarm.co.uk/product/hyacinth-macaw-for-sale-uk/
https://mikabirdsfarm.co.uk/product/african-grey-parrot/
https://mikabirdsfarm.co.uk/product/african-grey-parrot/
https://mikabirdsfarm.co.uk/product-category/african-greys-parrot/
https://mikabirdsfarm.co.uk/
https://goldenretrieverwelpen.xyz/
https://nationalboxerpuppiesrescue.com/
https://mikabirdsfarm.co.uk/
https://goldenretrieverwelpen.xyz/
https://goldenretrieverwelpen.xyz/
https://mikabirdsfarm.co.uk/
https://mikabirdsfarm.co.uk/product/hyacinth-macaw-for-sale-uk/
https://mikabirdsfarm.co.uk/product/cockatoo-for-sale-uk/
https://mikabirdsfarm.co.uk/product/hyacinth-macaw-for-sale-uk/
https://mikabirdsfarm.co.uk/product/african-grey-parrot/
https://mikabirdsfarm.co.uk/product/african-grey-parrot/
https://mikabirdsfarm.co.uk/product/african-grey-parrot/
https://mikabirdsfarm.co.uk/product/cockatoo-for-sale-uk/
https://mikabirdsfarm.co.uk/product/african-grey-parrot/
https://mikabirdsfarm.co.uk/product/african-grey-parrot/
https://mikabirdsfarm.co.uk/product/african-grey-parrot/
https://mikabirdsfarm.co.uk/product/african-grey-parrot/
https://mikabirdsfarm.co.uk/product/african-grey-parrot/
https://mikabirdsfarm.co.uk/product/cockatoo-for-sale-uk/
https://mikabirdsfarm.co.uk/product/buy-dusky-headed-parakeet/
https://mikabirdsfarm.co.uk/product/black-palm-cockatoos/
https://mikabirdsfarm.co.uk/product/black-palm-cockatoos/
https://mikabirdsfarm.co.uk/
https://mikabirdsfarm.co.uk/product/black-palm-cockatoos/
https://mikabirdsfarm.co.uk/product/buy-dusky-headed-parakeet/
https://mikabirdsfarm.co.uk/product/caparrotua-cockatoo/
https://mikabirdsfarm.co.uk/product/cockatoo-for-sale-uk/
https://mikabirdsfarm.co.uk/product/eclectus-parrot-for-sale-uk/
https://mikabirdsfarm.co.uk/product/green-winged-macaw/
https://mikabirdsfarm.co.uk/product/hyacinth-macaw/
https://mikabirdsfarm.co.uk/product/african-grey-parrot/
https://mikabirdsfarm.co.uk/
https://mikabirdsfarm.co.uk/product/african-grey-parrot/
https://mikabirdsfarm.co.uk/product/african-grey-parrot/
https://megabirdstore.com/bird/buy-african-grey/
https://dalgonashihpoopuppies.com/available-puppies/ ;
https://dalgonashihpoopuppies.com/available-puppies/ ;
https://mikabirdsfarm.co.uk/product/buy-dusky-headed-parakeet/
https://mikabirdsfarm.co.uk/product/caparrotua-cockatoo/
https://megabirdstore.com/bird/buy-amazon-parrot/
https://megabirdstore.com/
https://megabirdstore.com/bird/buy-african-grey/