

In this article, we will learn how to create a similar yet more customized plot using my favorite geovisualization package, Folium.I will also show you how to use the “Marker Cluster” feature of…...
Get Started for FREE
Sign up with Facebook Sign up with X
I don't have a Facebook or a X account


 Your new post is loading...
 Your new post is loading...
Your new post is loading...
In this article, we will learn how to create a similar yet more customized plot using my favorite geovisualization package, Folium.I will also show you how to use the “Marker Cluster” feature of…...
Phillip Trotter's insight:
This has been a really good series of articles on interactive GIS visualization - definitely worth reading

No comment yet.
Sign up to comment

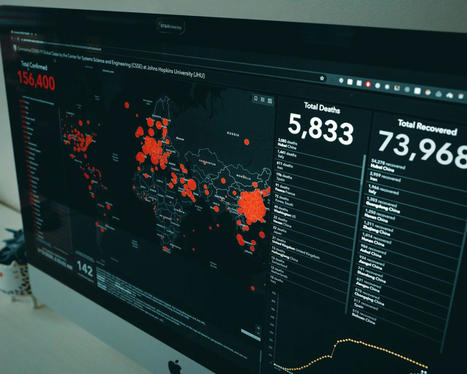
Digital volunteers are racing to map regions in West Africa where the Ebola virus, which has a 90 percent fatality rate, continues to spread
Phillip Trotter's insight:
The use of OpenStreetMap (OSM) as an unifying geodata system is increasing in humanitarian aid. The current Ebola outbreak in West Africa is a challenge at multiple levels for teams trying to coordinate a response. Due to years of war there are few up to date maps in the region and multiple boundaries mean different groups are collecting data. Digital volunteers creating new OSM entries will be a key asset in enabling health officials to manage the outbreak and hopefully bring things under control.
We investigate the growth dynamics of Greater London defined by the administrative boundary of the Greater London Authority, based on the evolution of its street network during the last two centuries. This is done by employing a unique dataset, consisting of the planar graph representation of nine time slices of Greater London's road network spanning 224 years, from 1786 to 2010. Within this time-frame, we address the concept of the metropolitan area or city in physical terms, in that urban evolution reveals observable transitions in the distribution of relevant geometrical properties. Given that London has a hard boundary enforced by its long standing green belt, we show that its street network dynamics can be described as a fractal space-filling phenomena up to a capacitated limit, whence its growth can be predicted with a striking level of accuracy. This observation is confirmed by the analytical calculation of key topological properties of the planar graph, such as the topological growth of the network and its average connectivity. This study thus represents an example of a strong violation of Gibrat's law. In particular, we are able to show analytically how London evolves from a more loop-like structure, typical of planned cities, toward a more tree-like structure, typical of self-organized cities. These observations are relevant to the discourse on sustainable urban planning with respect to the control of urban sprawl in many large cities which have developed under the conditions of spatial constraints imposed by green belts and hard urban boundaries.
Masucci AP, Stanilov K, Batty M (2013) Limited Urban Growth: London's Street Network Dynamics since the 18th Century. PLoS ONE 8(8): e69469. http://dx.doi.org/10.1371/journal.pone.0069469 Via Complexity Digest
Phillip Trotter's insight:
Mike Batty has created a truly world class research group and this paper by Paula Masucci and Mike is a great addition to literature relating to sustainable cities.
Phillip Trotter's insight:
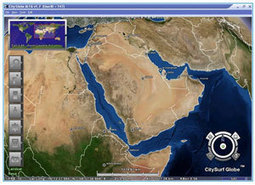
ESRI's acquisition of CityEngine is probably one of the smartest tech acquisitions in the geospatial market in a long time. As the product and technology integration rolls forward we get to see how very smart the acquisition was.The WebGL publishing capabilities are very exciting for city planners. Great video of highlights from the recent ESRI user group conference its great seeing how the products are evolving.

Jed Fisher's curator insight,
July 19, 2013 4:50 PM
Nice job Dominik, Pascal, and Jack. Great to see how Proceedural has evolved with the acquistiion by ESRI (now 2-3 years ago). I'm glad ESRI has continued to take City Engine further. Love the swipe tool. Great urban planning tool.

NJVC will leverage the Cloudcuity AppDeployer application PaaS to integrate various apps to support the needs of a diverse population of international disaster first responders (e.g., law enforcement, fire response, disaster medical response) into a common complex humanitarian disaster (CHD) management operating environment.
Phillip Trotter's insight:
In this implementation, the AppDeployer PaaS extends and complements the Google Maps Engine development PaaS platform. Google will provide massively scalable, critical geospatial data and mapping services to the demonstration participants. The Cloud-based Google Maps Engine product lets users create, share, publish and view (via a browser or Google Earth client) purpose-built maps to address key CHD mission requirements. Clickon the title or image to learn more.
From
www

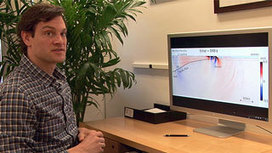
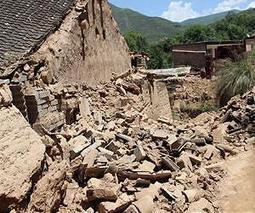
Stanford scientists have identified key acoustic characteristics of the 2011 Japan earthquake that indicated it would cause a large tsunami. The technique could be applied worldwide to create an early warning system for massive tsunamis.
Phillip Trotter's insight:
Computer simulations by Stanford scientists reveal that sound waves in the ocean produced by the earthquake probably reached land tens of minutes before the tsunami. If correctly interpreted, they could have offered a warning that a large tsunami was on the way. Click on the image or title to learn more.
Learn GIS for free online from these university and institution based resources. Learn GIS on your own or supplement your existing geospatial education.
Phillip Trotter's insight:
If you are new to GIS or brushing up - this article has asome great pointers to online resources where you can quickly get your skills up todate and learn hwo to use new developments. Worth reading.
Research based implementation of development programs is mainly assisted with Geographic Information System (GIS) and disseminated through Public Relations (PR). Via Knapco
With the combining increasingly of the Geographic Information System (GIS), Remote Sensing (RS) technologies with the modern network communication technology, some unique advantages have been displaying in the monitoring, forewarning and disaster... Via Knapco

Knapco's curator insight,
December 28, 2012 11:31 PM
RS and GIS technologies were used in processing of professional meteorological data like MODIS remote sensing images, the doppler radar echoes and the Meteoroloical Information Collecting, Analyzing and Processing System (MICAPS). The system is based on WebGIS and is convenient for the use of the agro-meteorological professionals, who use biological data and monitor weather diseaster events like spring frost, heal and drought. For some model crops some object-oriented user interfaces were developed with functions of the database management, data querying, map displaying, graphics rendering, spatial analysis, the professional data processing, information extraction, figure and table output. Read more....

Found this interesting: MongoDB has native support for geospatial indexes and extensions to the query language to support a lot of different ways of querying your geo spatial documents. We will touch on a all of the available features of the MongoDB geospatial support point by point as including:
Click on the image or the title to learn more
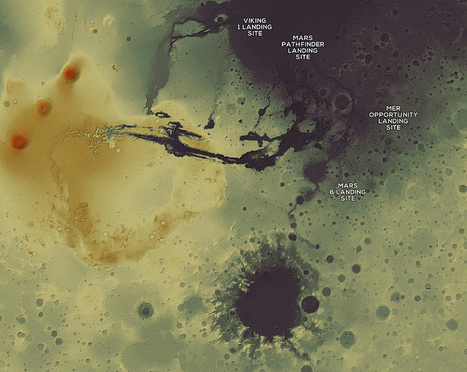
Curious where NASA's Curiosity is going? Then this is just he resource - a fantastic blog post from Mapbox.com on using open source mapping tools to create online maps of Mars. If you are into using map based services - this is a must read both for the technology covered, the processes described and because its awesome. Enjoy. Click on the image or the link to learn more.
The Next-Generation of Geospatial Technology and the World Bank’s Role in Using Geographic Information Systems (GIS) to enhance Development Outcomes. Many work programs within the World Bank are now embracing the use of ICT tools for engaging citizens, gathering data, disseminating information, improving transparency and accountability, and ensuring better communication and collaboration. These tools have been employed both in country-level work as well as through efforts to open up the World Bank’s processes. Esri president Jack Dangermond and World Bank staff discuss future possibilities of geospatial technology and how they can use those technologies to meet various development goals. Click on headline to see video of event.
Cities have long been the world’s economic dynamos, but today the speed and scale of their expansion are unprecedented. Through a combination of consumption and investment in physical capital, growing cities could inject up to $30 trillion a year into the world economy by 2025. Understanding cities and their shifting demographics is critical to reaching urban consumers and to preparing for the challenges that will arise from increasing demand for natural resources (such as water and energy) and for capital to invest in new housing, office buildings, and port capacity.
Report|McKinsey Global Institute Via Complexity Digest, Frédéric Amblard
|
DirectionsMag.com
Phillip Trotter's insight:
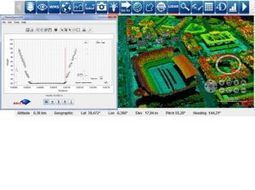
IF you are involved in developing or using professional mapping, survey and photogrammetric products - Dielmo have released their back office cloud platform that enables teams to upload, store, process and share LiDAR, Raster, Vector data derived from UAV, Helicopter, Fixed-wing and Mobile platforms. Helping data acquisition companies to benefit from the latest in sensor and big data processing technologies, reducing the complexity of data processing and data analysis means Dielmo can help professional cartographers and cartographic solution developers - save time to market and operations costs.
Nation puts geospatial data system on the map
Phillip Trotter's insight:
Accurate maps and geospatial data is critical to success of first responders in disaster zones. Good to see China establishing a national system to support first responders.

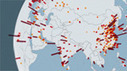
Each of the 24,000 dots on this map of London has been coloured according to its most frequently reported crime between May 2012 and April 2013. During this period, more than 250,000 crimes were reported – the equivalent of one every two minutes. Via James Cheshire
Phillip Trotter's insight:
great scoop by James Chesire - check out his scoop spot Spatial Analysis - awesome reading.
From
gigaom
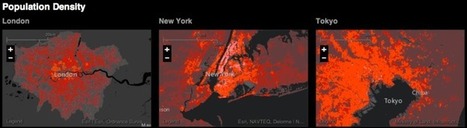
A new online mapping tool wants to make better urban planning by comparing a standardized map experience.
Phillip Trotter's insight:
Launched at ESRI's user conference the urban observatory enables cities to upload data and compare structural organisation, traffic, landuse, housing density, open space distribution and other variables. The gigaom article explains the aims and includes a video of Jack Dangermond and Richard Saul Wurman who jointly launched the venture.

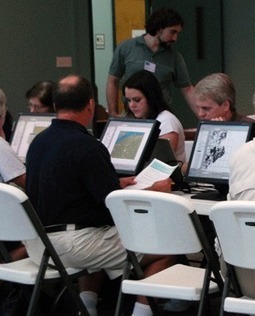
2013 Esri International User Conference in San Diego, California, from July 8-12, 2013. Esri's yearly user conference is the largest geospatial conference.
Phillip Trotter's insight:
ESRI maybe the grandfather company of the GIS industry- but they constantly innovate and their user base does incredible things with their GIS technologies. The annual ESRI user conference is a great source of info and the videos from the key notes are worth watching. If you can take time to watch the STEM & GIS in schools with the incredibly impressive student team from Roosevelt High School and then watch the Will.iam and Jack Dangermond interview. .
From
opengeo
Palantir's data platform, Gotham, enables data integration, search and discovery, knowledge management, secure collaboration, and algorithmic analysis across a wide variety of data sources.
Phillip Trotter's insight:
Palantir teamed with the OpenGeo to extend PostGIS to support WGS84 coordinate system and geodetic coordinates. This enabled Palantir to migrate from Oracle spatial to PostGIS as the underpinning spatial database for their Gotham platform. The benefits to the wider spatial community are signficiant since WGS84 based mapping is often a requirement in government and geoscience applications. Palantir's sponsored open source development undertaken by OpenGeo enables other to take advantage of the new features and integrate PostGIS into workflows. Click on the image or title to learn more.

According to a report by the Boston Consulting Group (BCG) the geospatial services industry in the United States generates annual revenues of $75 billion annually. That is about 0.5 % of the US GDP. The report breaks the geospatial services...

Transforming ArcGIS into a Platform, One of the primary drivers of the ArcGIS as a platform initiative has been making GIS easier not only for new users but for advanced users, as well. In addition, the platform is open, extendable, and can be leveraged by others, facilitating both the integration of other geospatial technologies, as well as other enterprise IT and web services of many origins. Looking to the future, we see our platform strategy as being of great benefit and value to our users, partners, developers, and ultimately the world itself. It is already creating an ecosystem and community of GIS users who are leveraging each other’s resources and knowledge. Via Jed Fisher
Phillip Trotter's insight:
Great catch from Jed Fisher at 4D pipeline on how ESRI are evolving from a tools company to a platform company.
Jed Fisher's curator insight,
February 6, 2013 10:10 AM
Interesting thoughts from ESRI founder Jack Dangermond. Firstly this article gives an insight into the process of evolving a "Tool" to a cloud based "Platform" (a difficult feat in itself and something that many are pursuing in their own disciplines and fields). Secondly, because again we are seeing the (potential) power of opening up a platform to "the masses" (aka downstream). That is, creating an open ecosystem and making complex useful data available in simpler forms for downstream users. In turn, some would argue that if you can get people hooked on your data then it will increase the need for more contact (demand and supply equation). People talk about "Big Data" all the time however it's often overlooked that the data must come from somewhere. I love that we are seeing more and more disciplines open up. CAD, AEC, GIS, and Manufacturing all seem to be trending towards opening up their platforms and their resulting data which in turn allows us to (potentially) have an incredible, powerful and connected experience.
I'm a bog fan of Geoff Zeiss's blog Between the Poles - H ehas a great review of the Eclipse Foundation Locationtech teleconference presentation by Matt Ford of Cesium Cesium is an open source 3D, 2.5 D and 2D globe visualisation toolkit written in webgl. Planned support for Openlayers is ont he roadmap which will make it a very interesting customizable alternative to Google Earth or WorldWind for specific applications. Click on the image or title to learn more.

Dubai Municipality to apply open geospatial standards for enterprise-wide GISAME InfoThe GIS Department at Dubai Municipality has recently organized a joint session for the project to apply the open geospatial standards of Geographical Information...

In what is rapidly becoming one of the most anticipated games releases in the simulation community - a little more info on the forthcoming SimCity release. IN this article and interview with Ocean Quigley of EA/Maxis quicly explains how the new SimCity simulation engine combines micro and macro simulation elements with each person, building and object will be simulated by the game's engine including individual sims that now have routines and lives and respond to the local events. Click on the image or title to learn more.

Having grown up relying on Ordance Survey maps for climbing and hill walking and hiking - I have a fond spot for the Ordanace Survey and their products. So this caught my eye from September 2012, the UK geospatial information agency, Ordnance Survey, will be launching a new international organisation, Ordnance Survey International. The aim is to provide advice and services across the full spectrum of Ordnance Survey’s expertise, including data collection and maintenance, product development and geospatial data management. Dr Vanessa Lawrence CB, director general and chief executive at Ordnance Survey added that “for some time the organisation has been approached by other national mapping agencies to provide guidance and share their expertise. Following encouragement by Ministers to export the skills, Ordnance Survey International has been set up to facilitate working with overseas customers who wish to seek our assistance. Click on image or title to learn more.
|


