


Considering 94% of a website’s first impressions are related to design, we curated a list of the best designed websites in 2021.
Via THE OFFICIAL ANDREASCY
Get Started for FREE
Sign up with Facebook Sign up with X
I don't have a Facebook or a X account


 Your new post is loading...
 Your new post is loading...
Your new post is loading...
Considering 94% of a website’s first impressions are related to design, we curated a list of the best designed websites in 2021. Via THE OFFICIAL ANDREASCY 

sofia carlos's curator insight,
April 16, 2022 7:59 PM
https://www.bostonterrierpetshome.com https://www.bostonterrierpetshome.com https://www.bostonterrierpetshome.com https://www.bostonterrierpetshome.com https://www.bostonterrierpetshome.com https://www.bostonterrierpetshome.com

museumofjewelry's comment,
September 13, 2023 2:06 AM
good
Sign up to comment
From
curatti

Over the last 5 years, the popularity of infographics in marketing has continued to climb. Thinking of creating one? Read these helpful tips Via janlgordon

janlgordon's curator insight,
April 5, 2017 3:46 PM
I selected this article from Curatti written by Susan Gilbert because it helps you improve your visual marketing with shareable infographics.
Visual graphics can be both fun and informative for your niche audience.
Create Infographics That Grow Your Following Online
People are drawn to appealing content that grabs their attention right away. I agree that infographics can help attract more subscribers and followers.
Gilbert shows you how to create graphics that audiences are more willing to share.
Here's what caught my attention:
Selected by Jan Gordon for Curatti covering Curation, Social Business and Beyond
Featured image: 123rf.
Read full article here: http://ow.ly/x9eO30aBqyw
Stay informed on trends, insights, what's happening in the digital world become a Curatti Insider today

Do you want to kick your social media marketing up a notch, but you don’t know where to start? Visual content could be the answer. Via janlgordon
janlgordon's comment,
November 3, 2016 10:47 AM
Thank you @Stan Smith @Ricard Lloria @Jenne & @Mehdi BH :-)

Content - Want to boost your referral traffic and generate more social shares from your content? Then craft engaging infographics. Here's how to get started. Via Daniel Watson

From
curatti
No matter how brilliant it may be, if your social media content is not digestible, it will not matter. Here are 10 types that succeed on social media. Via janlgordon
janlgordon's comment,
July 27, 2016 10:41 AM
Thank you Os, John, @Stan Smith, @Anna, @Nicholas Bodell & @Dejan Nikolic :-)
janlgordon's comment,
August 1, 2016 10:22 AM
Thank you @malek @Konstantinos Kalemis @MiniTool Software & @Anna :-)
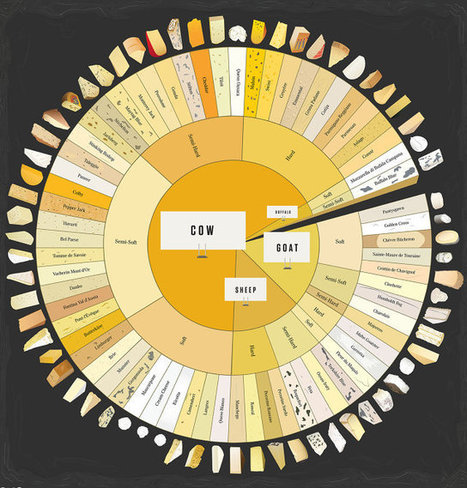
Over the course of the year, we saw infographics on a wide range of subjects, including 20th-century camera and sneaker design, house alliances of The Game Of Thrones, a colorwheel of cheeses, undersea internet cabling, beard typography, Batman symbols, and much, much more.
For years, marketers without a lick of design sense were slapping clip art on any data set that came their way and calling the finished poster an infographic. In 2013, there was a backlash against shoddy infographics. Perhaps that's why it feels like this year's data viz design is the most sophisticated, and the most accessible, yet: infographics don't have to be stupid anymore to be for everyone.
For your end-of-year perusal, we've collected 21 of our favorite infographics of 2013 in the slide show above. On the data viz front, we can't wait to see what 2014 has in store. Enjoy!... Via Jeff Domansky

Jeff Domansky's curator insight,
December 23, 2013 11:26 AM
Impressive creativity in these 21 best infographics picked by Fast Company. 
Media Marketing Mgmt.'s curator insight,
December 23, 2013 12:14 PM
Use Infographics, people love visuals
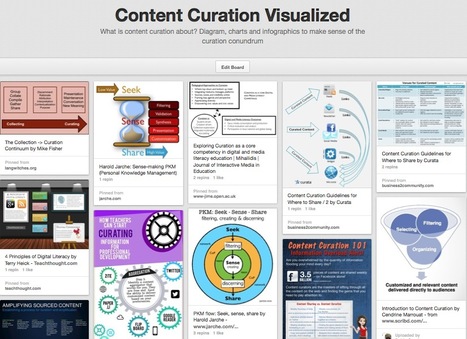
What is content curation about? Diagram, charts and infographics to make sense of the curation conundrum Via Robin Good, Ally Greer

Monica S Mcfeeters's curator insight,
March 30, 2014 9:18 AM
This will be helpful to share to those wondering about content curation.
Jeff Domansky's curator insight,
September 1, 2014 11:53 PM
Valuable collection of the art of curation from Robin Good.
Infographics are changing the way we share information, so we thought it would be a good idea to gather 12 essential ones that would help marketers and businesses understand what’s currently taking place in the online world as well as make better use of the tools we have at our disposal. Via Lauren Moss
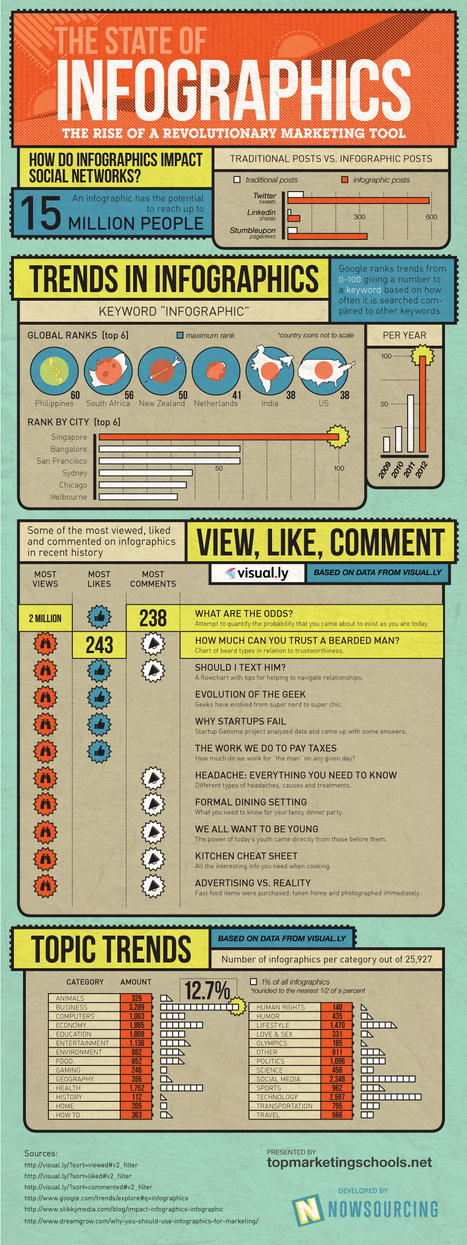
![Infographics ROCK Twitter and LinkedIn, Leave Facebook Cold: Measuring ROI [Infographic] | Business Improvement and Social media | Scoop.it](https://img.scoop.it/8ONIJFh_uLfxrIaXTBQTzzl72eJkfbmt4t8yenImKBVvK0kTmF0xjctABnaLJIm9)
Infographics on Return On Infographics ROI on business for sales and conversion of product with search engine ranking, social interaction, page views Via Martin (Marty) Smith

Lynn O'Connell for O'Connell Meier's curator insight,
February 8, 2013 4:05 PM
Facebook doesn't show enough of a infographic to allow it to have impact. To share there, make a photo of the top and link to another site. 
Ken Morrison's curator insight,
February 18, 2013 6:22 PM
Ken's Key Takeaway: I am sharing this link for two reasons. I like that it shares a list of the most popular infographic. I also like that it shows how to attempt to evaluate the ROI of an infographic. 
255's comment,
February 20, 2013 12:21 AM
Could be that infographics tells something in an easy way about relevant point ?
Infographics have become more popular with the rise of social media, fuelling the need for instant results by providing content in bite-size chunks. Via janlgordon

Deb Nystrom, REVELN's curator insight,
January 27, 2013 6:05 PM
An infographic on infographics and trends on visual communication. Very relevant to learning quickly and memorably. ~ Deb
With plenty of different forms of advertising and publication forming over the past several years, many bloggers are looking for alternative ways to catch the eyes of their readers.
One of the best ways to do this is by creating infographics that summarize a topic or event in an aesthetically-pleasing fashion. By boiling down the subject material into an easy-to-digest format, you stand to gain much attention from those seeking refuge in an internet environment of information overload... Via Lauren Moss

Belinda Suvaal's curator insight,
December 12, 2012 2:07 PM
Een goede #infographic is goud waard (IMHO: sommige infographics schieten hun doel voorbij door een overload aan feitjes en statistiekjes)
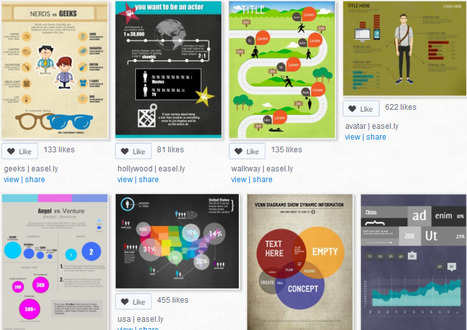
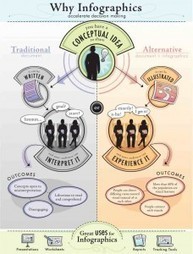
An easy way to create infographics and posters with ready-made visual themes.
Wow -- I see several templates I'm going to use today for my work with clients. What fun! This platform looks easy to use and I hope it is. Talk about some great visual storytelling!
In the meantime, I hope you find some templates you can use. Enjoy playing!
Thanks to fellow curator Baiba Svenca for finding this and sharing!
This review was written by Karen Dietz for her curated content on business storytelling at www.scoop.it/t/just-story-it ; Via Baiba Svenca, Becky Gaylord, Ivo Nový, Lauren Moss

Alfredo Corell's comment,
November 13, 2012 2:30 AM
Everybody could be relaxed... it's finally working back. Enjoy!!!

Nuava Solutions's curator insight,
December 19, 2012 10:35 AM
For more information on Online Solutions, please visit our website or contact us. 
Cb Bowman's curator insight,
September 10, 2013 12:31 PM
The current wave in marketing and/ or knowledge sharing.
![Visual Information & How It Affects Website Traffic [Infographic] | Business Improvement and Social media | Scoop.it](https://img.scoop.it/uw2LStByugjHwewG47Kdvjl72eJkfbmt4t8yenImKBVvK0kTmF0xjctABnaLJIm9)
Educate yourself about the importance of visual information on your website. With infographics, you will gain a lot more traffic for your growing website. Visual information is processed faster by the brain, with 90% of all the information that we take in is visual. But the thing with visual information is also that unless it’s a really good story or article, people don’t want to read through a whole page of text when he or she could do something else more fun. So, throw in an infographic with visual information, and you’ll have a winner... Via Lauren Moss
|

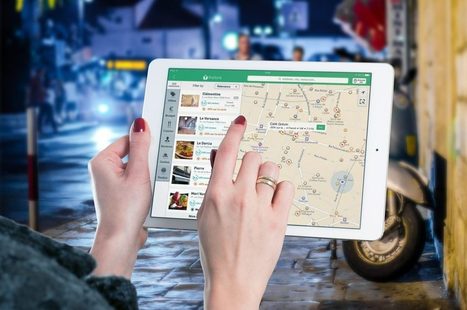
Interactive Content is gaining ever more popularity. It is a way of gauging customer needs and intent, as well as finding out other usefu Via janlgordon
janlgordon's curator insight,
April 24, 2017 11:09 PM
I selected this article from Curatti written by Joan Selby because it provides insights into how to effectively use video and multimedia to capture your audience's attention.
Bring more to your content marketing through the power of interaction.
Visual Content Marketing Success Strategies
A blog post can stand out from the rest by including a strong video that captures the reader's attention. I agree that you need to include visuals in order to take your marketing to the next level.
Selby explains the impact of interactive content on your business marketing reach.
Here's what caught my attention:
Selected by Jan Gordon for Curatti covering Curation, Social Business and Beyond
Image: Courtesy of 123rf. . Read full article here: http://ow.ly/gZjy30b8M3Y
Stay informed on trends, insights, what's happening in the digital world become a Curatti Insider today

Neither memes nor infographics are new concepts. However in recent years, they have been adopted with great success into social media marketing Via janlgordon
janlgordon's curator insight,
February 1, 2017 5:33 PM
I selected this article from Curatti written by Susan Gilbert because it provides the latest information to help you improve your visual marketing with memes and infographics.
Why adding fun and informative visuals can help improve your brand visibility online.
Using Memes and Infographics in Your Marketing Mix
In an online world where images take center stage your business can attract a larger audiences with memes and infographics. I agree that both forms of content can be beneficial to building trust.
Gilbert goes over the history of each and how to apply them to your marketing strategy.
Here's what caught my attention:
Selected by Jan Gordon for Curatti covering Curation, Social Business and Beyond
Featured image: Origin unknown
Read full article here: http://ow.ly/TW1v308ACln
Stay informed on trends, insights, what's happening in the digital world become a Curatti Insider today 
Carl david ceder's curator insight,
February 23, 2017 7:09 AM
Frank SanPietro ~ How Memes and Infographics Can Aid Your Visual Marketing
![Six Steps to Creating a Successful Infographic for Your Business [Infographic] | Business Improvement and Social media | Scoop.it](https://img.scoop.it/j-i36KCaWUQfk24Gxcs93zl72eJkfbmt4t8yenImKBVvK0kTmF0xjctABnaLJIm9)
Content - Want to boost your referral traffic and generate more social shares from your content? Then craft engaging infographics. Here's how to get started. Via massimo facchinetti, John van den Brink
According to the Content Marketing Institute, there will be a 75 percent increase in interactive content this year. Here are 4 ways you can can be creative Via janlgordon
These days, creating online content and gaining results can get pretty overwhelming. There are countless vehicles to use, plenty of social media sites to distribute on, and more than enough platforms. Here's a compilation of infographics out there to help with content creation efforts and maximize results... Via Lauren Moss

Mr Tozzo's curator insight,
August 18, 2014 9:49 AM
The Best Infographics to Help You Create Content 
One Marketeer's curator insight,
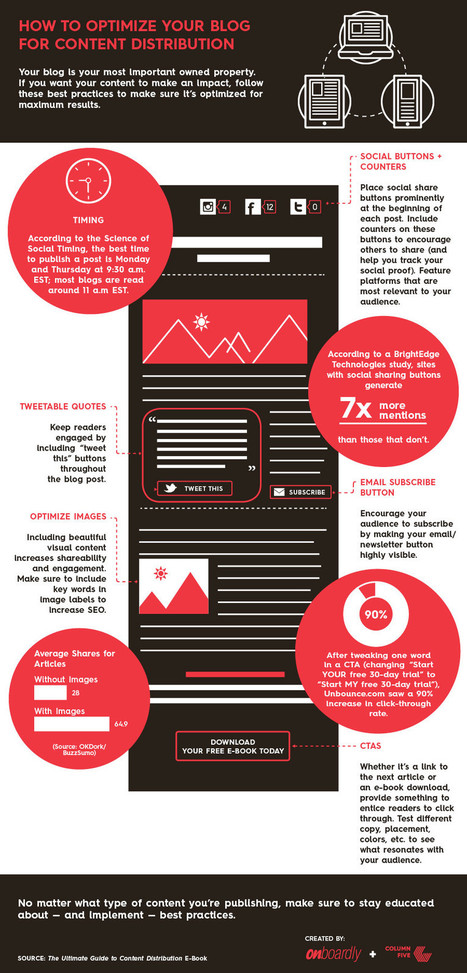
October 6, 2014 6:31 AM
I really like this Infographic, I must follow this advice as soon as I have time! HAVE A WONDERFUL AND ENERGETIC MONDAY! #blogging #contentdistribution #lay-out #blogstructure #learning
Whether you own a large online business or a small booming startup, we’re sure you are actively using social media to give your brand the right dose of exposure and get the message across to your targeted audience. This is a great list of useful cheatsheets for people who want to benefit more from social media marketing.
These 35 cheatsheets cover tips for Facebook, Twitter, Google+ and Pinterest, so you can better understand how to market via social media and how to design pages and content for optimum exposure. Via Lauren Moss

Mark Palmer's curator insight,
July 18, 2013 8:47 AM
A really good collection of social media infographics. 
Kika Lensvelt's curator insight,
July 19, 2013 7:35 AM
cheatsheets Facebook, Twitter, Google+ & Pinterest 
Stephen Dale's curator insight,
July 20, 2013 8:20 AM
Heavily biased towards brands and marketing, but some useful data nevertheless. Personally, I'd like to see more examples of how social media is being used for personal development, collaboration and knowledge sharing.

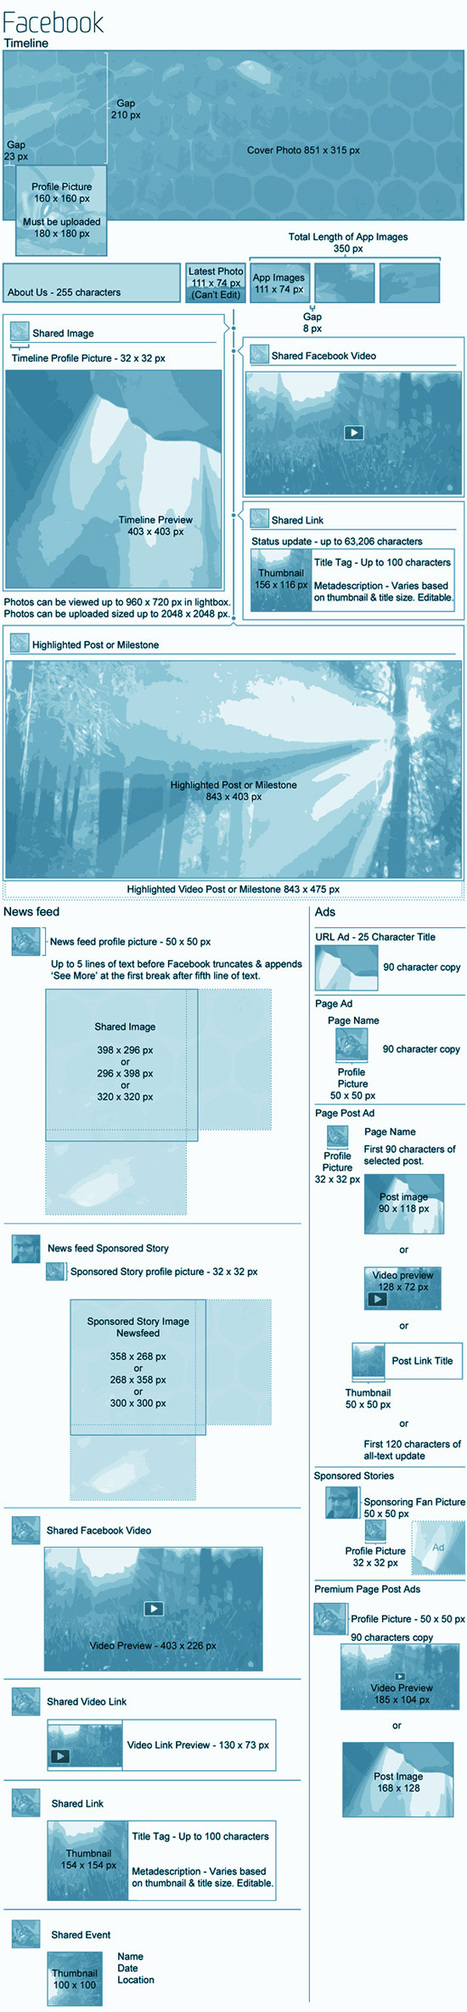
Like all new technology, social media changes fast. Just trying to keep your head around all of the different platforms, how to approach them and, of course, how to design for them can be a full time job. Social media has proven itself as a crucial component of a brand’s marketing mix, but with the many different platforms, it can be very difficult to put forth a consistent brand image online.
The [Ridiculously Exhausitive] Social Media Design Blueprint features all of the major design dimensions for all of the major platforms, including Facebook, Twitter, Google+, LinkedIN, YouTube, Pinterest and the most recent entry, Instagram. Via Lauren Moss

Two Pens's curator insight,
May 30, 2013 1:31 PM
How to keep up with all those pesky design requirements on FB,LI, Twitter, etc. Thank you, somebody! 
MESODEV's curator insight,
May 31, 2013 4:01 AM
Voilà une infographie utile plutôt que de rechercher sans cesse les bonnes dimensions ! 
Therese Matthys's curator insight,
June 6, 2013 10:05 AM
Is your company consistent with its brand image online across all channels?
![5 Reasons We Use Social Media [Infographic] | Business Improvement and Social media | Scoop.it](https://img.scoop.it/0dX8Ctv2ZvgMgSGXFog8zzl72eJkfbmt4t8yenImKBVvK0kTmF0xjctABnaLJIm9)
There are many reasons we use social media. From the basic to the more advanced, the tool is simply ubiquitous and addictive. This infographic sheds some light for us all. Via Gust MEES

Latisha Poulard's curator insight,
March 21, 2013 10:46 PM
You see why if you don't have an online presence then you are part of a dying breed...
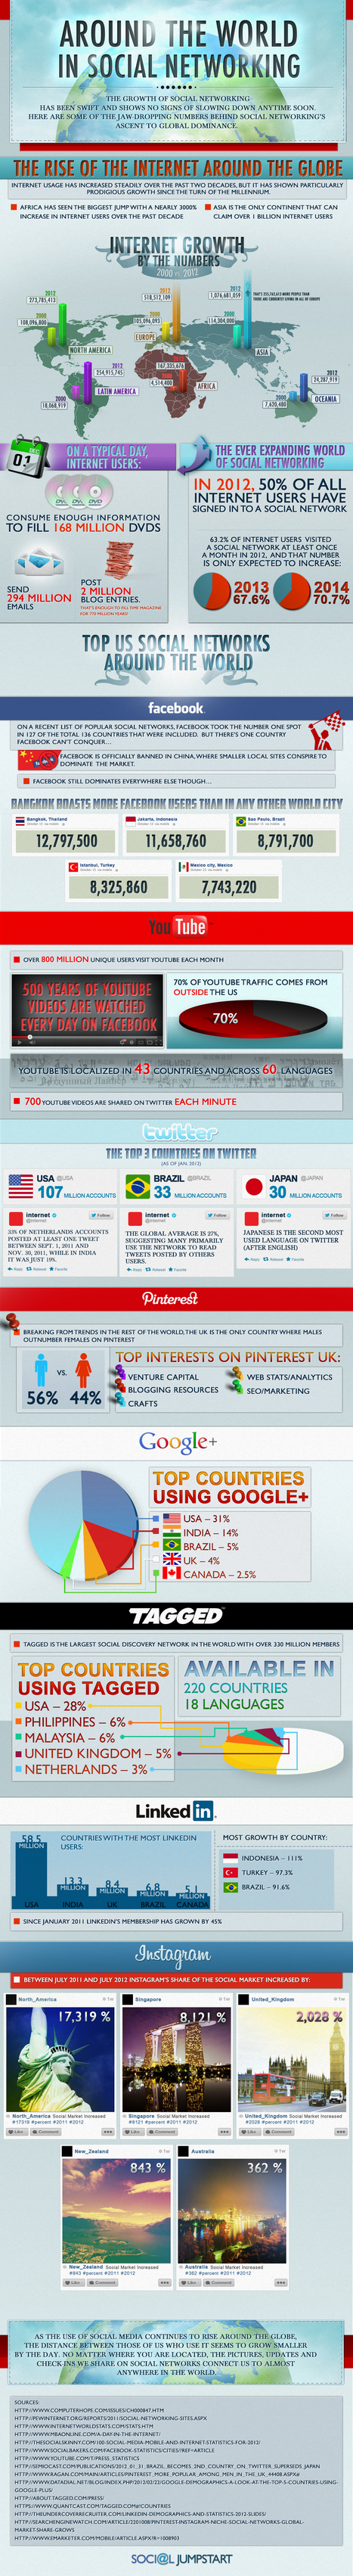
Facebook, Twitter, Pinterest, Instagram – How Big Is Social Media Around The World? Via myriam, ABroaderView, donhornsby, juandoming, Terheck, Jimun Gimm
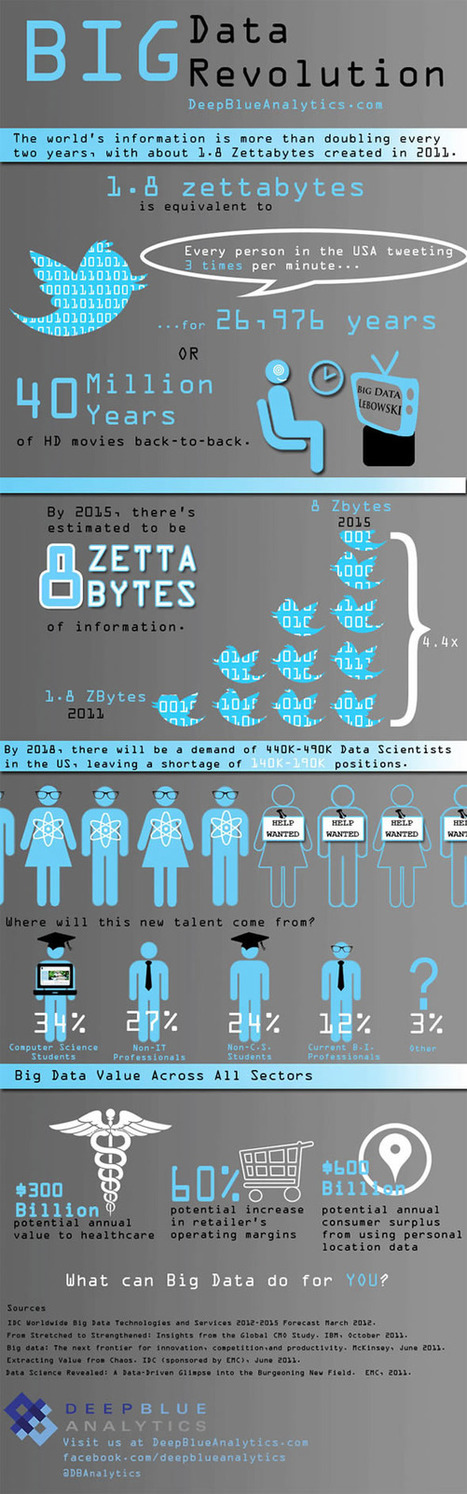
Is Big Data still a big mystery to you? Via Lauren Moss, Brian Yanish - MarketingHits.com
![Why You Need to Build Your Brand Online [infographic] | Business Improvement and Social media | Scoop.it](https://img.scoop.it/lnTzSJHISN3lgUBJZe22zjl72eJkfbmt4t8yenImKBVvK0kTmF0xjctABnaLJIm9)
The Internet offers so many more possibilities for small businesses than ever before. The online marketing opportunities are limitless, and it can be done with the social networks that you use everyday. So, 'Why Build Your Brand Online?' The answer is simple, because that’s where everyone is. People are going to look for information about your business all hours of the day, everyday. Give your customers the opportunity to see your brand and message at all times. Let them develop a loyalty to your business via the Internet, and the increased opportunities for revenue rewards will likely soon follow. Learn more about online branding and more tips for business development through social media at the article link... Via Lauren Moss
![The Formula Behind Facebook Engagement [infographic] | Business Improvement and Social media | Scoop.it](https://img.scoop.it/P7qpTRn9vxu7qiUJcHW2ADl72eJkfbmt4t8yenImKBVvK0kTmF0xjctABnaLJIm9)
A constant challenge for Internet marketers targeting Facebook has been gaining engagement. Generally brands and page admins have defined engagement as things such as likes, shares, and comments, but more importantly to gain reputation with Facebook’s algorithm. This infographic created by SocialMouths and American Express OPEN illustrates ways to help make a Facebook page’s post a bit more popular through optimization of post elements such as short posts, the use of emoticons, the best times to post, and contest ideas... Via Lauren Moss
|


