This article is from Mashable and infographic created by Nowsourcing. I chose this piece because it's a continuation of the last scoops I've posted recently about turn data into something businesses can understand and utilize.
Here are some highlights:.
We are all experiencing too much information and unable to process it in a way that is useful for our business needs
**"The use of infographics helps to break down data visually, helping viewers make sense of complex information"
**What's behind the science behind an infograpic's success? Allow an infographic to explain
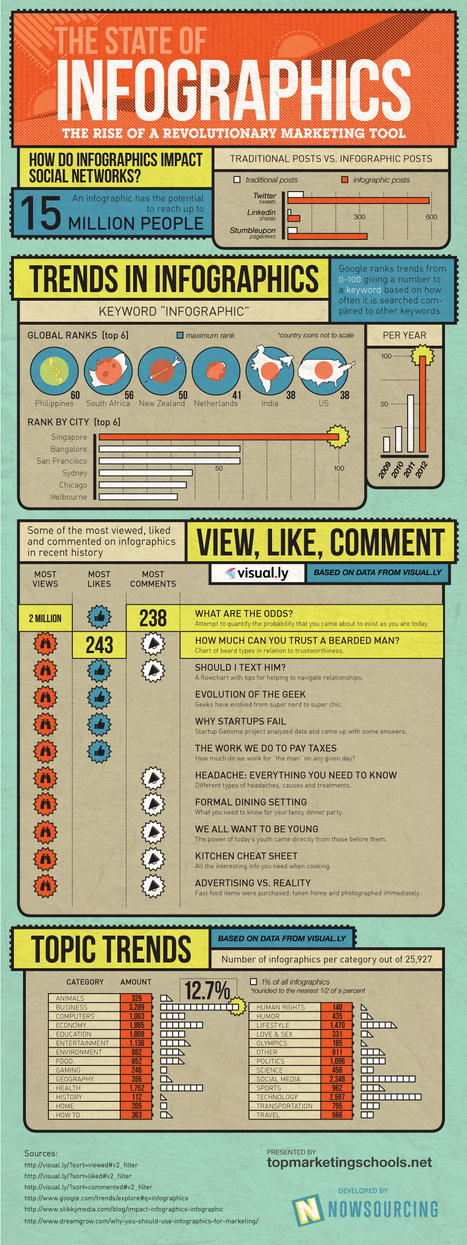
**An infographic has the potential to reach up to 15 million people
The infographic in this piece shows you
**How infographics impact social networks
**The difference between traditional posts vs. infographic posts and much more.......
To get content containing either thought or leadership enter:
To get content containing both thought and leadership enter:
To get content containing the expression thought leadership enter:
You can enter several keywords and you can refine them whenever you want. Our suggestion engine uses more signals but entering a few keywords here will rapidly give you great content to curate.


 Your new post is loading...


This article is from Mashable and infographic created by Nowsourcing. I chose this piece because it's a continuation of the last scoops I've posted recently about turn data into something businesses can understand and utilize.
Here are some highlights:.
We are all experiencing too much information and unable to process it in a way that is useful for our business needs
**"The use of infographics helps to break down data visually, helping viewers make sense of complex information"
**What's behind the science behind an infograpic's success? Allow an infographic to explain
**An infographic has the potential to reach up to 15 million people
The infographic in this piece shows you
**How infographics impact social networks
**The difference between traditional posts vs. infographic posts and much more.......
Selected by Jan Gordon covering "Curation, Social Business and Beyond"
See article and infographic here: [http://on.mash.to/XKAKcQ]