Your new post is loading...

|
Scooped by
Gilbert C FAURE
September 24, 4:18 AM
|
Objectives To evaluate temporal changes in rheumatoid arthritis (RA) synovial histopathology across treatment periods using the Rooney score in a surgical cohort. Methods This retrospective study included 1770 synovial specimens from 1150 patients who underwent orthopaedic surgery between 2011 and 2025. Specimens were classified into early biological disease-modifying antirheumatic drug (bDMARD) (2011–2013), established bDMARD (2014–2018) and contemporary targeted therapy (2019–2025) periods. Mixed-effects models included patient-level random intercepts. Sensitivity analyses used calendar year, 3-year intervals, specimen-count-based tertiles and operated-joint power Doppler (PD) grade. Results The median total Rooney scores were 29 (IQR 20–36), 24 (19.25–34) and 23 (20–32) across the periods (p for trend <0.001), driven by lower lymphocytic infiltration. The combined lymphocytic infiltration score decreased from 11 (0–20; early period) to 2 (0–11; contemporary period). After full adjustment, the contemporary period remained associated with a lower Rooney score than the early period (β –1.61, 95% CI –2.74 to –0.48; p=0.005). Tertile analyses were consistent, whereas adding operated-joint PD grade attenuated period estimates. Janus kinase (JAK) inhibitor-treated specimens did not have lower scores than bDMARD-treated specimens without JAK inhibitor exposure. Residual lymphocytic infiltration remained detectable despite clinical or imaging remission. Conclusions RA synovial histopathology evolved across treatment periods, with lower Rooney scores and marked reductions in lymphocytic infiltration. These changes appear to reflect broader contemporary RA management rather than a JAK inhibitor-specific effect, although tissue-level inflammation may persist despite clinical or imaging remission.
|
|
Scooped by
Gilbert C FAURE
June 11, 9:58 AM
|
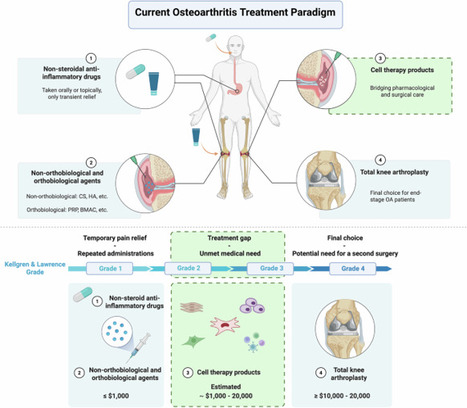
Osteoarthritis (OA) remains a major cause of disability worldwide; however, current non-surgical treatments offer transient symptom relief without altering disease course. This leaves a therapeutic gap for patients with early-to-moderate disease who are not candidates for surgery but continue to experience pain and functional limitation. Intra-articular interventions such as non-steroidal anti-inflammatory drugs, hyaluronic acid, and platelet-rich plasma may ease symptoms, but do not modify disease progression. By contrast, cell therapy products hold promise as regenerative approaches that may both alleviate pain and influence disease trajectory. Cell therapy products for knee OA exert multimodal effects through paracrine and immunomodulatory mechanisms, including modulation of synovial inflammation, attenuation of senescence-associated pathways, and support of extracellular matrix production. Despite encouraging preclinical and clinical signals, only a few cell therapy products have been approved globally, and most remain in development. However, substantial translational challenges remain, including variability in cell source and potency, limited persistence in joint environment, small clinical trial sizes, and regulatory and manufacturing hurdles. To achieve broader adoption, it will be essential to demonstrate superiority to minimally manipulated orthobiologics, clarify redosing strategies, and generate robust long-term evidence. This Review discusses recent clinical trial data, mechanistic insights, regulatory considerations, and operational challenges shaping the evolving role of cell therapy products for OA as next-generation candidates to bridge the gap between pharmacological and surgical interventions. In addition, this Review is written to support regulatory agencies as well as academics and clinicians involved in the development and evaluation of cell therapy products. Osteoarthritis is a leading cause of pain and disability, affecting more than 600 million adults globally, with its prevalence rising due to aging and obesity. This Review explores the potential of cell-based orthobiological regenerative therapies, particularly mesenchymal stem cells (MSCs), which may provide durable benefits by modulating inflammation and supporting endogenous tissue repair. MSCs, despite rapid clearance from the knee joint, exhibit multifactorial mechanisms, including immunomodulation and chondroprotection, which could offer broader therapeutic effects than currently available treatments. However, clinical evidence for their superiority remains limited, highlighting the need for further mechanistic studies and stratified clinical trials. This Review emphasizes the importance of developing standardized manufacturing processes and regulatory frameworks to advance these therapies. Future directions include exploring cell-free approaches and enhancing MSC durability in the osteoarthritis environment, aiming for long-term clinical benefits and potential disease modification. This summary was initially drafted using artificial intelligence, then revised and fact-checked by the author.
|
|
Scooped by
Gilbert C FAURE
November 22, 2025 2:52 AM
|
|
|
Scooped by
Gilbert C FAURE
November 28, 2024 1:07 PM
|
|
|
Scooped by
Gilbert C FAURE
December 20, 2023 8:37 AM
|
WHAT IS ALREADY KNOWN ON THIS TOPICMonoclonal therapy for one inflammatory disease may paradoxically trigger another inflammatory disease.Recent case reports have implicated an association between anti-IL-5 (IL, interleukin) antibody therapy used to treat severe asthma and the development of rheumatoid arthritis (RA).WHAT THIS STUDY ADDSOut of 142 patients within our asthma service taking anti-IL-5 antibody therapy for at least 1 month, and with a mean duration of 3.5 years on therapy, only one developed RA suggesting that RA is a relatively uncommon complication in the short-medium term.HOW THIS STUDY MIGHT AFFECT RESEARCH, PRACTICE OR POLICYTreating clinicians should be mindful of the possibility of developing inflammatory arthritis following the initiation of anti-IL-5 therapy and ensure appropriate review and assessment should their patient develop arthralgia as, while uncommon, these could represent a significant source of morbidity.IntroductionThere has been a wide adoption of monoclonal antibody therapy in rheumatology, respiratory medicine, and an increasing number of specialties for the treatment of many inflammatory diseases. Of particular interest is that monoclonal therapy for one inflammatory disease may paradoxically trigger another inflammatory disease. Pertinent examples include tumour necrosis factor inhibitor therapy triggering multiple sclerosis,1 interleukin 17 (IL-17) therapy for psoriasis linked to inflammatory bowel disease2 and more recently IL-4/13 blockade used for atopic dermatitis being associated with de novo psoriasis and arthritis.3 4Arthralgias are a known adverse effect of anti-IL-5 biologics,5 6 however, a few recent case reports have found this association may extend to inflammatory arthritis such as RA.7 8 The prevalence of these findings across a wider cohort of patients remains relatively unknown. Here we present an audit from a large, single-centre’s severe asthma service which looks for the prevalence of RA across all patients being treated with mepolizumab and benralizumab, two commonly used anti-IL-5 therapies.MethodsAll patients with severe eosinophilic asthma across the Leeds Teaching Hospitals NHS Trust’s (LTHT) Respiratory Service, who had received at least 1 month of mepolizumab or benralizumab therapy, were included in this clinical audit.Each patient’s electronic records, including hospital records, clinic letters, general practitioner (GP) records and electronic pathology results were searched. We recorded whether patients had presented with any signs or symptoms of synovitis (eg, joint pain, swelling and tenderness) either prior- or post-commencing biologics, whether their serology (rheumatoid factor (RF) and/or anti-CCP antibody (ACPA)) and acute phase reactants (C- Reactive Protein (CRP) and/or Erythrocyte Sedimentation Rate (ESR)) had been measured and the timing and duration of their symptoms. Using this information, we then calculated the number of points each patient with symptoms would score on the ACR/EULAR 2010 Rheumatoid Arthritis classification criteria.9 We also recorded the dose of routine steroids the patients were receiving prior to starting biologics, and whether they were weaned off steroids within 1 year of commencing biologics. Finally, we recorded whether the patients had been seen in our early arthritis clinic and received a formal diagnosis on an inflammatory arthritis.ResultsA total of 142 patients (57 males, 85 females and mean age 58.2 years old) were being treated with anti-IL-5 biologics under the LTHT’s severe asthma clinic, with a mean duration of 3.5 years on therapy. Eighty-nine were on mepolizumab and 53 on benralizumab. The mean daily dose of steroids prior to starting anti-IL-5 therapy was 6.0 mg prednisolone, reducing to 3.1 mg at 1 year post-therapy. Seventy-five patients were steroid-free after 1 year of therapy.Only one patient among 500 patient years of exposure to anti-IL-5 therapy received a formal diagnosis of RA suggesting an overall annual incidence of 20 cases per 10 000 patients (95% CI 2.8 to 142). This man in his 70s presented to our early arthritis clinic 18 months after having been started on mepolizumab for his severe eosinophilic asthma. Prior to starting biologics, his asthma had been poorly controlled with salbutamol, budesonide/formoterol combination inhaler, tiotropium inhalers and daily low-dose oral corticosteroids. Within weeks, he developed symmetrical arthralgia involving small joints, particularly his wrists and knuckles, as well as significant early morning stiffness lasting more than 1 hour. On examination, he had clinical synovitis in the wrists and metacarpophalangeal joints bilaterally, as well as right shoulder capsulitis with limiting range of motion.Blood tests revealed a raised CRP of 24 mg/L, White Cell Count (WCC) 8.77 10 × 9 /L, RF of 263.2 iu/mL (normal<14.0) and an ACPA of >300 U/mL (normal<2.99). Ultrasound imaging of the hands and wrists showed bilateral grade II grey scale with grade II power Doppler (figure 1) with bilateral wrist erosions. There was hypoechogenicity of the left extensor carpi ulnaris tendon with some associated grey scale and power Doppler. MRI of the left hand revealed extensive subchondral bone marrow oedema (figure 1) and multiple erosions across all carpal bones and carpometacarpal joints (figure 1).<img width="342" alt="Figure 1" height="440" class="highwire-fragment fragment-image" src="https://rmdopen.bmj.com/content/rmdopen/9/4/e003583/F1.medium.gif">Download figure Open in new tab Download powerpoint Figure 1 (A) Fat suppression MRI of the left wrist and MCPs showing extensive bone oedema (white arrows) and joint effusion (black asterisk). (B) T1-weighted MRI of the left wrist showing diffuse erosions of the left wrist (white arrows). (C) Longitudinal ultrasound image showing synovitis of the right wrist with grey scale (white asterisk) and power Doppler (white arrow).He was diagnosed with RA as per the American College of Rheumatology (ACR)/EULAR classification criteria and started on prednisolone 10 mg daily to control the inflammation, followed by sulfasalazine 1 month later as the disease modifying agent. He was followed-up in rheumatology clinic 2 months later and showed significant improvements: the joint pain and swelling had settled, and while he still experienced early morning stiffness, this was less debilitating. His inflammatory markers had also resolved with CRP<5.0 mg/L and WCC 9.31 10 × 9 /L.Of the remaining 141 patients, 16 developed bilateral polyarthralgia of greater than 1 month duration (eight mepolizumab and eight benralizumab), with a median onset of 12 months after commencing a biological therapy. Of these patients 9/16 were tested for RF and ACPA and in all cases, their serology was negative; 15/16 patients had acute phase inflammatory markers measured and these were only elevated in three patients. All 16 of these patients were on a maintenance dose of prednisolone prior to starting the biologic (mean dose 10.1 mg/day), with 10 of them completely weaned off steroids within 12 months.Using the information available from the patient’s electronic records, the mean number of points scored on the ACR/EULAR RA criteria was 3.2 (range 1–6). The patient who scored six points was reviewed in the early arthritis clinic and the symptoms were felt to be more in keeping with osteoarthritis than an inflammatory arthritis. Similarly, none of the other patients had received a confirmed diagnosis of inflammatory arthritis by either their GP or by a rheumatologist.Only one other patient became newly RF positive (17.1 iu/mL), 1 month after commencing mepolizumab; however, this seemed to be an incidental finding as the patient had a broad set of bloods taken while admitted to the intensive care unit for a severe exacerbation of asthma, and at no point since has complained of rheumatological symptoms.We were unable to access the GP records for 37 patients and as such could not review whether they had presented to their GPs with new rheumatological symptoms. However, we were able to access their pathology test records electronically and found no evidence of positive RA serology in any of these patients and no rheumatological referrals to our centre that has a well-developed early RA network.DiscussionThere is an emerging interest in IL-5 blockade and the potential development of RA. We present a single-centre’s experience of 500 patient years on anti-IL-5 monoclonal antibody exposure therapy for severe asthma.As expected, arthralgias were a relatively common side-effect of anti-IL-5 therapy. As for progression to RA, we found only one convincing case. While relatively low, the implied annual incidence of 20 cases per 10 000 patients is several fold higher than the annual incidence of RA in the UK (1.5 per 10 000 men and 3.6 per 10 000 women).10 Given the wide CIs, however, no firm conclusions can be offered in relationship to our single case and to the relative risk of RA following anti-IL-5 therapy.A major confounding variable is the weaning of steroids in most patients started on biologics. This poses a challenge in associating the development of symptoms with the initiation of the anti-IL-5 therapy, as opposed to the withdrawal of steroids unmasking a pre-existing disease. Additionally, one must consider whether the risk of developing RA is modified by the underlying condition, and indeed there is some evidence to suggested that asthma may be positively associated with RA.11 However, these population-based studies look at asthma as a whole, rather than divided into its endotypes (eg, eosinophilic vs neutrophilic asthma) and as such these have not yet challenged the conventional belief that Th1 and Th2 diseases are inversely related.Emerging evidence has implicated a core role for regulatory eosinophils (rEos) in the resolution of RA.12 In murine models of RA, the expansion of rEos in the synovial fluid as a by-product of inducing eosinophilic asthma was sufficient in bringing about remission of arthritis, and inhibiting the IL-5 pathway would subsequently induce relapse of the arthritis.12 Further evidence supporting a role for rEos in RA can be found at a genetic level where Eotaxin-3, one of the main drivers of eosinophil recruitment, has single nucleotide polymorphisms associated with RA13 and from studying the role of IL-5 in Th2 responses to Helminth infections,14 with mouse models of RA also identifying Helminth infections as protective.15 Hence, the suggestion that the expansion of eosinophils in the synovium ‘regulate’ the proinflammatory Th1 pathways driving synovial inflammation.12 This invites the notion that in a patient with subclinical, yet endogenously controlled, synovial inflammation, removing rEos by administering anti-IL-5 therapeutics may tip the balance in favour of inflammation and permit symptomatic disease. However, if there is little proinflammatory Th1 synovial activity in the first place, then inhibiting rEos with anti-IL-5 biologics may be insufficient to precipitate an inflammatory arthritis.Interestingly, there is debate as to whether rEos are depleted to varying degrees depending on the anti-IL-5 biologic used. In mice, inflammatory eosinophils (iEos)—the primary targets of anti-IL-5 biologics in asthma—may be dependent on IL-5 for activity, whereas rEos may not be.16 This would suggest that benralizumab, a high-affinity IL-5 receptor antagonist,17 would deplete both iEos and rEos through NK-mediated killing, whereas mepolizumab, an anti-IL-5 monoclonal antibody,17 may deplete iEos but keep rEos intact. However, this idea has recently been challenged with evidence that anti-IL-5 treatment depletes all populations of eosinophils.18 Whether this distinction would result in a different pattern of adverse effects in patients remains unclear, notably as the patient who developed RA in this report was receiving mepolizumab.As an audit, this study serves to identify the prevalence of a relatively rare complication of anti-IL-5 therapy. We were unable to find clear evidence for a pattern of emergent RA nor other inflammatory arthritis in our cohort of 142 patients. Further studies may be required to characterise the nature and significance of these findings in clinical groups and to identify whether there is an actual association between novel anti-IL-5 biologics and RA.Data availability statementThe data that support the findings of this study are available upon reasonable request.Ethics statementsPatient consent for publicationConsent obtained directly from patient(s).Ethics approvalThis study was registered as a clinical audit and given the retrospective nature of the data collection process did not require formal ethical approval. In completing this audit, full ethical standards were upheld in accordance with the principles of clinical governance. From the one patient whose details were discussed in more detail we have gained full written consent.References↵Sicotte NL, Voskuhl RR. Onset of multiple sclerosis associated with anti-TNF therapy. Neurology 2001;57:1885–8. doi:10.1212/wnl.57.10.1885OpenUrlCrossRefPubMed↵Hohenberger M, Cardwell LA, Oussedik E, et al. Interleukin-17 inhibition: role in psoriasis and inflammatory bowel disease. J Dermatolog Treat 2018;29:13–8. doi:10.1080/09546634.2017.1329511OpenUrlPubMed↵Bridgewood C, Newton D, Bragazzi N, et al. Unexpected connections of the IL-23/IL-17 and IL-4/IL-13 cytokine axes in inflammatory arthritis and enthesitis. Semin Immunol 2021;58:101520. doi:10.1016/j.smim.2021.101520OpenUrl↵Bridgewood C, Wittmann M, Macleod T, et al. T helper 2 IL-4/IL-13 dual blockade with dupilumab is linked to some emergent T helper 17‒Type diseases, including seronegative arthritis and enthesitis/enthesopathy, but not to humoral autoimmune diseases. J Invest Dermatol 2022;142:2660–7. doi:10.1016/j.jid.2022.03.013OpenUrl↵Harrison T, Canonica GW, Chupp G, et al. Real-world Mepolizumab in the prospective severe asthma REALITI-A study: initial analysis. Eur Respir J 2020;56:2000151. doi:10.1183/13993003.00151-2020↵Liu W, Ma X, Zhou W. Adverse events of benralizumab in moderate to severe eosinophilic asthma: a meta-analysis. Medicine (Baltimore) 2019;98:e15868. doi:10.1097/MD.0000000000015868↵Kawabata H, Satoh M, Yatera K. Development of rheumatoid arthritis during anti-Interleukin-5 therapy in a patient with refractory chronic eosinophilic pneumonia. J Asthma Allergy 2021;14:1425–30. doi:10.2147/JAA.S342993OpenUrl↵Dupin C, Morer L, Phillips Houlbracq M, et al. Arthritis, a new adverse effect of anti-Il5 Biologics in severe asthma patients. European Respiratory Journal 2022;60:2432. doi:10.1183/13993003.congress-2022.2432OpenUrlCrossRef↵Aletaha D, Neogi T, Silman AJ, et al. 2010 rheumatoid arthritis classification criteria: an American college of rheumatology/European League against rheumatism collaborative initiative. Arthritis Rheum 2010;62:2569–81. doi:10.1002/art.27584OpenUrlCrossRefPubMedWeb of Science↵NICE guideline. Overview: rheumatoid arthritis in adults: management [Guidance, NICE]. 2018. Available: https://www.nice.org.uk/guidance/ng100 [Accessed 25 Sep 2023].↵Rolfes MC, Juhn YJ, Wi C-I, et al. Asthma and the risk of rheumatoid arthritis: an insight into the heterogeneity and phenotypes of asthma. Tuberc Respir Dis (Seoul) 2017;80:113–35. doi:10.4046/trd.2017.80.2.113OpenUrl↵Andreev D, Liu M, Kachler K, et al. Regulatory eosinophils induce the resolution of experimental arthritis and appear in remission state of human rheumatoid arthritis. Ann Rheum Dis 2021;80:451–68. doi:10.1136/annrheumdis-2020-218902OpenUrlAbstract/FREE Full Text↵Guellec D, Milin M, Cornec D, et al. Eosinophilia predicts poor clinical outcomes in recent-onset arthritis: results from the ESPOIR cohort. RMD Open 2015;1:e000070. doi:10.1136/rmdopen-2015-000070↵Mishra PK, Palma M, Bleich D, et al. Systemic impact of intestinal helminth infections. Mucosal Immunol 2014;7:753–62. doi:10.1038/mi.2014.23OpenUrlCrossRefPubMed↵Osada Y, Shimizu S, Kumagai T, et al. Schistosoma Mansoni infection reduces severity of collagen-induced arthritis via down-regulation of pro-inflammatory mediators. Int J Parasitol 2009;39:457–64. doi:10.1016/j.ijpara.2008.08.007OpenUrlCrossRefPubMed↵Mesnil C, Raulier S, Paulissen G, et al. Lung-resident eosinophils represent a distinct regulatory eosinophil subset. J Clin Invest 2016;126:3279–95. doi:10.1172/JCI85664OpenUrlCrossRefPubMed↵Caminati M, Menzella F, Guidolin L, et al. Targeting eosinophils: severe asthma and beyond. Drugs Context 2019;8:212587. doi:10.7573/dic.212587OpenUrl↵Dolitzky A, Grisaru-Tal S, Avlas S, et al. Mouse resident lung eosinophils are dependent on IL-5. Allergy 2022;77:2822–5. doi:10.1111/all.15362OpenUrl
|
|
Scooped by
Gilbert C FAURE
July 27, 2023 5:53 AM
|
|
|
Scooped by
Gilbert C FAURE
February 12, 2023 1:23 AM
|
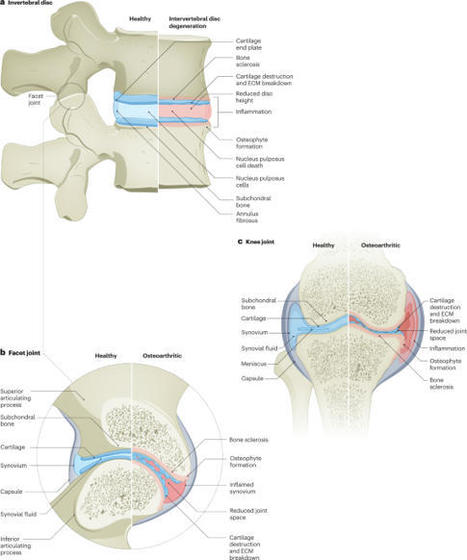
Intervertebral disc degeneration (IDD) and osteoarthritis (OA) affecting the facet joint of the spine are biomechanically interdependent, typically occur in tandem, and have considerable epidemiological and pathophysiological overlap. Historically, the distinctions between these degenerative diseases have been emphasized. Therefore, research in the two fields often occurs independently without adequate consideration of the co-dependence of the two sites, which reside within the same functional spinal unit. Emerging evidence from animal models of spine degeneration highlight the interdependence of IDD and facet joint OA, warranting a review of the parallels between these two degenerative phenomena for the benefit of both clinicians and research scientists. This Review discusses the pathophysiological aspects of IDD and OA, with an emphasis on tissue, cellular and molecular pathways of degeneration. Although the intervertebral disc and synovial facet joint are biologically distinct structures that are amenable to reductive scientific consideration, substantial overlap exists between the molecular pathways and processes of degeneration (including cartilage destruction, extracellular matrix degeneration and osteophyte formation) that occur at these sites. Thus, researchers, clinicians, advocates and policy-makers should consider viewing the burden and management of spinal degeneration holistically as part of the OA disease continuum. In this Review, the authors discuss the similarities and differences between intervertebral disc degeneration and osteoarthritis of the facet joint and argue that both diseases should be viewed as being part of the same molecular disease spectrum.
|
|
Scooped by
Gilbert C FAURE
June 15, 2022 8:51 AM
|
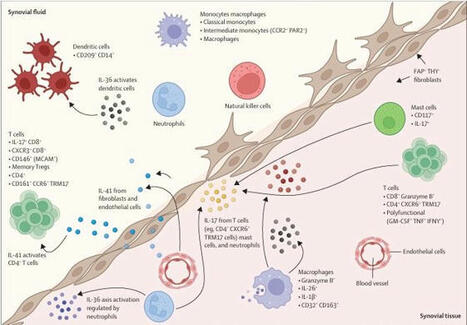
AbstractObjectives Immune and stromal cell communication is central in the pathogenesis of rheumatoid arthritis (RA) and psoriatic arthritis (PsA), however, the nature of these interactions in the synovial pathology of the two pathotypes can differ.
|
|
Scooped by
Gilbert C FAURE
September 12, 2021 3:26 AM
|
|
|
Scooped by
Gilbert C FAURE
May 14, 2021 4:39 AM
|
Osteoarthritis (OA) is a multifaceted musculoskeletal disorder, with a high prevalence worldwide. Articular cartilage and synovial membrane are among the main biological targets in the OA microenvironment.
|
|
Scooped by
Gilbert C FAURE
January 21, 2021 4:45 AM
|
Rheumatoid arthritis (RA) is a chronic autoimmune disease which causes degradation of cartilage and bone. It is well appreciated that the pathogenic hallmark of RA is the mass influx of inflammatory cells into the joint.
|
|
Scooped by
Gilbert C FAURE
December 1, 2020 7:37 AM
|
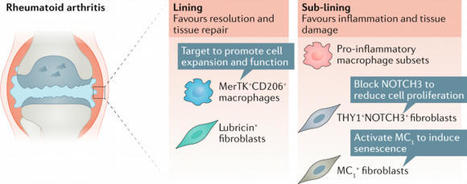
In inflammatory arthritides, such as rheumatoid arthritis (RA), synovial cells acquire aggressive and disruptive phenotypes that lead to joint disease. Three studies published in 2020 have described phenotypic variation in synovial cells, offering a novel perspective on the potential to resolve pathology and augment treatment options for patients with RA.
|
|
Scooped by
Gilbert C FAURE
November 28, 2020 4:42 AM
|
Research ArticleCell biologyMetabolism Open Access | 10.1172/jci.insight.139032 Pathogenic, glycolytic PD-1+ B cells accumulate in the hypoxic RA joint Achilleas Floudas,1 Nuno Neto,2,3 Viviana Marzaioli,1,4 Kieran Murray,4 Barry Moran,5 Michael G. Monaghan,2,3 Candice Low,4 Ronan H. Mullan,6 Navin Rao,7 Vinod Krishna,7 Sunil Nagpal,7 Douglas J. Veale,4 and Ursula Fearon1,4 Published November 5, 2020 - More info View PDF Abstract While autoantibodies are used in the diagnosis of rheumatoid arthritis (RA), the function of B cells in the inflamed joint remains elusive. Extensive flow cytometric characterization and SPICE algorithm analyses of single-cell synovial tissue from patients with RA revealed the accumulation of switched and double-negative memory programmed death-1 receptor–expressing (PD-1–expressing) B cells at the site of inflammation. Accumulation of memory B cells was mediated by CXCR3, evident by the observed increase in CXCR3-expressing synovial B cells compared with the periphery, differential regulation by key synovial cytokines, and restricted B cell invasion demonstrated in response to CXCR3 blockade. Notably, under 3% O2 hypoxic conditions that mimic the joint microenvironment, RA B cells maintained marked expression of MMP-9, TNF, and IL-6, with PD-1+ B cells demonstrating higher expression of CXCR3, CD80, CD86, IL-1β, and GM-CSF than their PD-1– counterparts. Finally, following functional analysis and flow cell sorting of RA PD-1+ versus PD-1– B cells, we demonstrate, using RNA-Seq and emerging fluorescence lifetime imaging microscopy of cellular NAD, a significant shift in metabolism of RA PD-1+ B cells toward glycolysis, associated with an increased transcriptional signature of key cytokines and chemokines that are strongly implicated in RA pathogenesis. Our data support the targeting of pathogenic PD-1+ B cells in RA as a focused, novel therapeutic option. Graphical Abstract Introduction Rheumatoid arthritis (RA) is the most common inflammatory arthropathy and is characterized primarily by the presence of circulating autoantibodies, first described in the 1940s. It often has a progressive and debilitating course, with significant impact on the patient’s quality of life. Despite the long-known association with autoantibodies, knowledge of the role of B cells and their potential direct contribution to disease pathogenesis in RA is limited (1). The recent observation of increased expression of programmed death-1 receptor (PD-1) in subjects who are autoantibody positive, even before they develop RA, suggests this is a primary immune dysregulation in the disease (2). Until recently, the main focus of PD-1 expression and therapeutic targeting of this pathway has been on T cells in the immune response of patients with cancer, which interestingly has led some patients to develop autoimmune diseases, including arthritis (3). Synovial accumulation of B cells correlates with increased radiographic scores and T cell activation in patients with RA; consequently, B cell–targeting therapies have demonstrated promising results for the treatment of RA, with rituximab (anti-CD20) showing significant efficacy and amelioration of disease progression in patients naive to methotrexate and those with incomplete responses to a TNF inhibitor (4–7). B cell depletion leads to significant but limited reduction in anti-citrullinated protein antibodies (ACPAs) and rheumatoid factor (RF), with studies showing clinical benefit for both autoantibody-positive and autoantibody-negative patients with RA (8, 9). While the exact mechanism leading to disease amelioration following B cell depletion is not fully elucidated, at-risk individuals who received a single dose of rituximab had a significant delay in disease onset that did not correlate with a reduction in IgG-RF or ACPA (10, 11). These studies highlight a key role for B cells at an early stage of disease pathogenesis in RA, in addition to their capacity to produce potentially autoreactive antibodies. Several aspects of B cell depletion remain poorly understood, which if uncovered, could exert a significant influence on therapeutic outcomes. Recent studies show a population of CD20+ T cells is subject to rituximab-mediated depletion (12). These cells express high levels of proinflammatory cytokines IL-17, TNF-α, and IFN-γ, and their potential contribution to the therapeutic effect of rituximab needs to be taken into consideration (13). Plasmablasts and plasma cells do not express CD20 and therefore are not affected by rituximab-mediated B cell depletion. A potential exception, however, has been described in a mouse model of inflammatory arthritis, where short-lived plasma cells residing in the spleen and secondary lymph nodes were shown to express CD20 and thus subject to depletion (14). These cells were preferentially autoreactive, highlighting that although overall antibody titers might remain unchanged following B cell depletion, certain antibody antigen specificities might be preferentially lost. Another complication that arises with current B cell–depleting strategies is the composition and immunological effect of B cell repopulation and the influence that may have on subsequent immune responses. Studies on B cell repopulation, following B cell depletion, have shown that returning B cells are primarily naive, immature, and enriched for IL-10–expressing cells (15, 16). Therefore, we hypothesized that there are missed opportunities for targeted therapeutic intervention that could potentially minimize off-target effects of B cell depletion by focusing either on the migration of memory B cells to the inflamed RA joint or on specific pathogenic B cell subpopulations, leaving the majority of the B cell pool intact. We have therefore performed extensive characterization of B cell subpopulations in the peripheral blood, synovial fluid, and synovial tissue of patients with early RA and have identified CXCR3 as a major contributor of memory B cell migration to the synovial tissue in RA. Importantly, a subpopulation of CXCR3+ B cells constitutively expresses PD-1. PD-1+ RA B cells maintained higher T cell costimulatory capacity and proinflammatory cytokine production than their PD-1– counterparts, under normoxic and hypoxic conditions that more closely resembled the environment of the inflamed RA joint. PD-1+ B cells accumulated at the site of inflammation in RA, showed increased activation of key metabolic pathways, including AKT/mTOR/S6 signaling pathway activity; and were dependent on STAT3 activation and glucose uptake. Using emerging noninvasive fluorescent lifetime imaging microscopy (FLIM) metabolic imaging technique and RNA-Seq, we show that these RA PD-1+ B cells are hyperactive and demonstrate increased glycolytic capacity. Results Accumulation of double-negative and switched memory B cells at the synovial tissue of RA patients. Multiparametric flow cytometric analysis for the identification of naive (IgD+CD27–), CD27+ memory, non–switched memory (IgD+CD27+), switched memory (IgD–CD27+), double-negative memory (IgD–CD27–), transitional (CD24hiCD38hi), and IgM-only memory (IgD–CD27+IgM+) B cell subpopulations and plasma cells (CD138+CD27hi) was performed (Figure 1A). Unexpectedly, a highly significant (P = 0.0022) increased frequency of naive B cells in the peripheral blood of healthy controls (HCs) compared with patients with RA was observed (Figure 1B). This difference was coupled with a significantly (P = 0.009) reduced frequency of CD27+ memory B cells in RA compared with HC that was similarly distributed between switched (P = 0.02) and non–switched memory (P = 0.04) B cells (Figure 1B). Although no significant differences were observed in the frequency of IgM-only memory B cells or plasma cells between RA and HC, a significant reduction in the frequency of transitional CD24hiCD38hi enriched for IL-10–producing B cells was observed in RA patient compared with HC peripheral blood (P = 0.04) (Figure 1B). Analysis of T cell costimulatory molecules of RA patient and HC peripheral blood B cells revealed no significant differences in the expression of CD80, CD86, HLA-DR, or CD40 (Figure 1C). Figure 1 RA patient peripheral blood B cell subpopulation distribution. (A) Representative flow cytometric analysis gating strategy for the identification of naive (IgD+CD27–), non-switched memory (IgD+CD27+), switched memory (IgD–CD27+), and double-negative memory (IgD–CD27–) B cells (over 20 independent experiments performed). DN, double-negative; L/D, LIVE/DEAD stain. (B) Frequency of the indicated B cell populations in the PBMCs of HC (n = 9–13) and RA patients (n = 18–30). Data are presented as mean ± SEM. Each symbol represents an individual sample. Statistical analysis was performed by using standard Student’s t test. *P < 0.05. (C) MFI values for the expression of CD40, CD86, CD80, and MHCII (HLA-DR) for HC and RA patient peripheral blood CD19+CD20+ B cells. Data are represented as a box-and-whisker plot, with bounds from 25th to 75th percentile, median line, and whiskers ranging from 5th to 95th percentile. Data are presented as mean ± SEM; each symbol represents an individual sample. Statistical analysis was performed by using 1-way ANOVA with Tukey’s multiple-comparisons test. *P < 0.05, **P < 0.01. We then performed an extensive characterization of B cell subpopulations in RA patient synovial fluid (SF) and enzymatically and mechanically digested synovial tissue. While the frequency of CD19+CD20+/– cells was significantly lower in RA patient SF (P = 0.0005) and synovial tissue (P = 0.02) compared with peripheral blood, the subpopulation distribution was markedly different (Supplemental Figure 1 and Supplemental Figure 2; supplemental material available online with this article; https://doi.org/10.1172/jci.insight.139032DS1). Interestingly, a significant reduction in naive (IgD+CD27–) B cells and a dramatic increase in the frequency of switched memory and double-negative memory B cells in RA SF (P < 0.0001 for all) and synovial tissue (P < 0.0001, P = 0.01, P = 0.0002, respectively) compared with peripheral blood was observed (Figure 2, A–C). Figure 2 Synovial tissue accumulation of DN and switched memory B cells in RA. (A) Representative plots of CD19+CD20+ B cells for the expression of IgD and CD27 in the peripheral blood, SF, and synovial tissue (at least 5 independent experiments performed). (B) Average subpopulation distribution of peripheral blood HC and RA patient B cells and RA patient SF and synovial tissue B cells. (C) Frequency of the indicated B cell populations in the periphery (n = 20), SF (n = 12), and synovial tissue (n = 6) of RA patients. Data are presented as mean ± SEM. Each symbol represents an individual sample. Statistical analysis was performed by using 1-way ANOVA with Tukey’s multiple-comparisons test. **P < 0.01, ***P < 0.001. CXCR3 is an important mediator for the accumulation of memory B cells to the site of inflammation in RA. We then examined the potential chemokine receptors involved in the accumulation of switched memory and DN memory B cells at the inflamed joint in RA. An extensive characterization of chemokine receptors was performed by flow cytometric analysis of the peripheral blood, SF, and synovial tissue B cells, including CXCR3, CXCR5, CCR6, and CCR7 (Figure 3, A and B). Chemokine receptor expression pattern differences were observed between HC and RA patient–derived peripheral blood. Such differences could potentially be utilized as novel diagnostic tools (Figure 3A). A significant increase in the expression of the chemokine receptor CXCR3 was evident for RA SF (P < 0.0001) and synovial tissue (P = 0.0007) B cells compared with peripheral blood B cells (Figure 3, B and C). A relatively small population (approximately 20%) of peripheral blood B cells expressed CXCR3, in comparison with approximately 80% positivity observed at the site of inflammation (Figure 3C). Peripheral blood CXCR3+ B cells belonged primarily to the switched memory and DN memory B cell subpopulations, therefore closely resembling the frequency of these cells at the RA synovial tissue (Figure 3, D and F), suggesting that CXCR3 is an important mediator of memory B cell accumulation from the periphery to the site of inflammation in RA. The local microenvironment of the inflamed joint could further contribute to B cell CXCR3 expression since CXCR3 is inducible by TNF and IFN-γ, 2 common proinflammatory cytokines of the joint microenvironment, but suppressed by IL-4 (Figure 3E). RA patient–derived B cells had the capacity to invade in response to RA synovial biopsy-conditioned media; however, upon treatment with the CXCR3 antagonist AMG487, B cell invasion was significantly reduced (P = 0.03) (Figure 3F). Importantly, there was a significant inverse correlation (r = –0.6, P = 0.047) between the peripheral blood frequency of CXCR3+ B cells and DAS28-CRP in patients with RA, potentially due to increased migration of CXCR3-expressing B cells to the site of inflammation in patients with higher disease severity, therefore further highlighting the importance of CXCR3 expression for the migration of B cells to the inflamed joint and disease progression (Figure 3G). Interestingly, 6 months to 1 year following rituximab-mediated B cell depletion, the returning B cells were primarily transitional B cells (P < 0.0001) expressing high levels of CD5 (associated with regulatory B cell function) (P = 0.0042) and CXCR3 (P < 0.0001) compared with B cells of patients who had not received B cell depletion therapy (Supplemental Figure 3). These studies highlight an important role for CXCR3 in the accumulation of memory B cells from the periphery to the inflamed synovial tissue. The potential for CXCR3-mediated trafficking of transitional B cells to the site of inflammation after B cell depletion therapy and any possible contribution to disease amelioration warrant further examination. Figure 3 Involvement of CXCR3 in the migration of peripheral blood memory B cells to the synovial tissue. (A) SPICE algorithm flow cytometric analysis of peripheral blood and synovial tissue RA patient B cell expression of the chemokine receptors CXCR3, CXCR5, CCR6, and CCR7. (B) Representative gating followed for the flow cytometric analysis and identification of CXCR3-expressing peripheral blood, SF, and synovial tissue B cells (at least 6 independent experiments were performed). FMO, fluorescence minus one. (C) Frequency of RA patient CXCR3-expressing B cells in the periphery (n = 12), SF (n = 7), and synovial tissue (n = 6). Data are presented as mean ± SEM. Statistical analysis was performed by using 1-way ANOVA with Tukey’s multiple-comparisons test. **P < 0.01, ***P < 0.001. (D) Representative flow cytometric analysis plots and frequency of RA patient switched memory and DN memory B cells within the CXCR3+ peripheral blood B cell compartment (n = 4). Data are presented as mean ± SEM. Ordinary 2-way ANOVA with Holm-Šidák multiple-comparisons test was performed. (E) Effect of CXCR3 expression change following incubation of isolated RA patient–derived peripheral blood B cells with the indicated cytokines (n = 6/group). (F) Representative flow cytometric analysis and CD19+/counting bead ratio for of invading B cells toward cRPMI (control), RA synovial biopsy-conditioned media (SP), or RA synovial biopsy-conditioned media following treatment of the B cells with the CXCR3 small molecule antagonist AMG487 (n = 7/group, 3 independent experiments); 1-way ANOVA with Tukey’s multiple-comparisons test; *P < 0.05. Data are represented as a box-and-whisker plot, with bounds from 25th to 75th percentile, median line, and whiskers ranging from 5th to 95th percentile. (G) Linear regression analysis between the frequency of RA patient peripheral blood CXCR3+ B cells and DAS28; n = 11; each symbol represents an individual sample. Spearman r correlation analysis was performed. RA patient–derived B cells express high levels of proinflammatory cytokines under hypoxic conditions, mimicking the environment of the inflamed RA joint. Previous studies have shown a positive correlation between hypoxia and cellular infiltration of the RA synovial tissue (17, 18). We therefore examined the effect of hypoxic conditions that mimic the microenvironment of the inflamed joint on B cell activation and cytokine production. RA patient– or HC-derived B cells were isolated and cultured under atmospheric oxygen levels (normoxia) or 3% O2 (hypoxia), which is the previously estimated in vivo average oxygen concentration in the inflamed joints of RA patients (17, 18). The expression of TNF, IL-6, and IL-1β by RA- and HC-derived B cells stimulated under normoxic and hypoxic conditions was examined. Under normoxic conditions, there was increased (P = 0.0047) IL-1β production but not TNF or IL-6 by RA-derived, compared with HC-derived, B cells when stimulated via the B cell receptor (BCR) with additional TLR stimulation (Figure 4, A–C). Under hypoxic conditions that mimic the microenvironment of the inflamed joint, however, RA-derived B cells secreted significantly higher IL-6 and TNF when stimulated through the BCR (P = 0.0003, P = 0.007, respectively) with or without additional TLR stimulation (P = 0.0007, P = 0.03, respectively) (Figure 4, A–C). In addition to the increased proinflammatory cytokine production, under hypoxic conditions, RA patient–derived B cells showed significantly higher expression of MMP-9 (P = 0.005), which is indicative of increased invasive capacity compared with HC-derived B cells (Figure 4D). These data demonstrate the importance of oxygen availability for B cell stimulation and cytokine production and raise important considerations for the interpretation of in vitro data performed under atmospheric O2 conditions. Figure 4 The effect of hypoxia on RA patient–derived B cells. (A) Schematic representation of peripheral blood B cell isolation and stimulation in vitro under normoxic or hypoxic conditions. aCD40, anti-CD40. (B) ELISA for the assessment of IL-6 and TNF-α concentration in HC- or RA patient–derived B cell cultures following stimulation as indicated under normoxic or hypoxic conditions (n = 4–6/group). Ordinary 2-way ANOVA with Holm-Šidák multiple-comparisons test was performed. *P < 0.05, **P < 0.01, ***P < 0.001. (C) Representative flow cytometric analysis plots and frequency of IL-1β–expressing HC- or RA patient–derived B cells following in vitro stimulation under the designated conditions (n = 3/group, 2 independent experiments). Ordinary 2-way ANOVA with Holm-Šidák multiple-comparisons test was performed. **P < 0.01. (D) Fold expression change of RA patient–derived B cell MMP-9 expression compared with HC-derived B cells following stimulation under hypoxic conditions (n = 5/group). Statistical analysis was performed by using paired standard Student’s t test. *P < 0.05, ***P < 0.001. All data are represented as a box-and-whisker plot, with bounds from 25th to 75th percentile, median line, and whiskers ranging from 5th to 95th percentile. Activated PD-1+ B cells accumulate at the site of inflammation in RA. Following in vitro stimulation by BCR-mediated signals, RA patient–derived B cells showed marked upregulation of PD-1 expression under normoxic or hypoxic conditions (Figure 5A). Earlier in this study, we demonstrated the importance of CXCR3 for the accumulation of memory B cells to the site of inflammation in RA. Importantly, the majority of CXCR3-expressing B cells following activation in vitro constitutively expressed PD-1 (Figure 5B). PD-1–expressing B cells constitute a rare (~2% of CD19+) population of cells in the periphery; however, there was significant accumulation of these cells in the SF (P = 0.0002) and synovial tissue (P = 0.005) in RA (Figure 5C). Immunofluorescence analysis of RA patient synovial tissue biopsies showed preferential accumulation of CD19+PD-1+ cells in tertiary lymphoid-like structures (Supplemental Figure 4). RA patient–derived PD-1–expressing B cells had higher expression of CD86 and CD80 compared with their PD-1– counterparts under normoxic (P = 0.0026, P = 0.001, respectively) and hypoxic (P = 0.0015, P < 0.0001, respectively) conditions (Figure 5D). Importantly, PD-1+ RA patient–derived B cells maintained significantly higher expression of IL-1β under normoxic (P = 0.0031) conditions and GM-CSF under normoxic and hypoxic conditions (P = 0.0003, P = 0.013, respectively) compared with PD-1– counterparts (Figure 5E). Figure 5 Identification of synovial PD-1+ B cells in RA. (A) Representative flow cytometric analysis and cumulative data for the identification of PD-1+ RA patient–derived B cells following in vitro stimulation under the indicated conditions (n = 3–6/group, 3 independent experiments). Data are represented as a box-and-whisker plot, with bounds from 25th to 75th percentile, median line, and whiskers ranging from 5th to 95th percentile. (B) Frequency of CXCR3 expression by PD-1– and PD-1+ RA patient–derived B cells under the indicated conditions. n = 5–7/group and n = 3 for aCD40. Data are represented as a box-and-whisker plot, with bounds from 25th to 75th percentile, median line, and whiskers ranging from 5th to 95th percentile. Ordinary 2-way ANOVA with Holm-Šidák multiple-comparisons test was performed. *P < 0.05, **P < 0.01. (C) Frequency of RA patient peripheral blood (PBMC), SF (SFMC), and synovial tissue (Bio) PD-1–expressing CD3+ T cells and CD19+ B cells. n = 3–7/group. Each symbol represents an individual sample. Data are presented as mean ± SEM. Ordinary 2-way ANOVA with Holm-Šidák multiple-comparisons test was performed. **P < 0.01, ***P < 0.001. (D) Representative flow cytometric analysis plots and frequency of CD80 and CD86 expression by RA patient–derived B cells following in vitro stimulation (aCD40+aBCR+CpG) under normoxic or hypoxic conditions (n = 8, 3 independent experiments). Each symbol represents an individual sample. Paired Student’s t test was performed. **P < 0.01, ***P < 0.001. (E) Frequency of IL-1β– and GM-CSF–expressing PD-1– and PD-1+ RA patient–derived B cells following stimulation under the indicated conditions (n = 6, 3 independent experiments). Data are represented as a box-and-whisker plot, with bounds from 25th to 75th percentile, median line, and whiskers ranging from 5th to 95th percentile. Statistical analysis was performed by using paired standard Student’s t test. *P < 0.05, **P < 0.01, ***P < 0.001. Previous studies have shown a potential immunoregulatory effect of PD-1+ B cells in patients with thyroid cancer because of an increased expression of PD-L1 by these cells (19). PD-1+ RA patient–derived B cells stimulated in vitro showed similar PD-L1 expression levels compared with matched PD-1– B cells (Supplemental Figure 5). PD-1+ RA patient B cells are dependent on glucose uptake and STAT3 activation. PD-1 expression is dependent on BCR-mediated signals, with TLR9 activation enhancing that effect. Because of the dependency of PD-1 on BCR signaling, the activation of AKT, a downstream kinase of the BCR signaling cascade, was analyzed under normoxic and hypoxic conditions. RA patient–derived PD-1+ B cells expressed significantly (P = 0.011 normoxia, P = 0.022 hypoxia) higher levels of activated AKT compared with PD-1– counterparts (Figure 6A) (20). AKT is a key regulator of mTOR. PD-1+ B cells showed higher activation of mTOR compared with PD-1– B cells (Figure 6A) (21). To assess if the increased phosphorylation of mTOR translates to higher downstream activity, the phosphorylation of the ribosomal protein S6, a target of the mTOR pathway, was assessed. In agreement with the increased AKT/mTOR activity, PD-1+ B cells showed significantly (P = 0.023 normoxia, P = 0.031 hypoxia) higher S6 phosphorylation compared with PD-1– B cells (Figure 6A). Figure 6 PD-1+ RA patient B cells are dependent on glycolysis. (A) Representative flow cytometric analysis histograms and cumulative MFI of RA patient peripheral blood–derived PD-1– and PD-1+ B cell expression of phosphorylated AKT, mTOR, and S6 following stimulation (aCD40+aBCR+CpG) under normoxic (21% O2) and hypoxic (3% O2) conditions (n = 6/group, 3 independent experiments). Data are represented as a box-and-whisker plot, with bounds from 25th to 75th percentile, median line, and whiskers ranging from 5th to 95th percentile. (B) Representative flow cytometric analysis plots and MFI of RA patient–derived PD-1– and PD-1+ B cell expression of GLUT1 and STAT3 phosphorylation (pSTAT3) following stimulation under the indicated conditions (n = 4/group, 2 independent experiments). Data are represented as a box-and-whisker plot, with bounds from 25th to 75th percentile, median line, and whiskers ranging from 5th to 95th percentile. (C) Representative flow cytometric analysis histograms of glucose analog 2-NBDG uptake by RA patient–derived PD-1– and PD-1+ B cells under the indicated conditions, (n = 5/group, 2 independent experiments). Data are represented as a box-and-whisker plot, with bounds from 25th to 75th percentile, median line, and whiskers ranging from 5th to 95th percentile. Ordinary 2-way ANOVA with Holm-Šidák multiple-comparisons test was performed. *P < 0.05, **P < 0.01. (D) Representative flow cytometric analysis plots of PD-1 expression by RA patient–derived B cells following stimulation in the presence of glucose analog 2DG (n = 4, 2 independent experiments). (E) Frequency of PD-1 B cells following incubation with STAT3 small molecule inhibitor Stattic (n = 3). Data are presented as mean ± SEM. Ordinary 2-way ANOVA with Holm-Šidák multiple-comparisons test was performed. **P < 0.01. (F) Effect of PD-1/PD-L1 engagement on PD-1+ RA patient–derived B cell expression of CD80 and CD86 and phosphorylation of AKT, mTOR, and S6 under normoxic or hypoxic conditions (n = 9). Data are represented as a box-and-whisker plot, with bounds from 25th to 75th percentile, median line, and whiskers ranging from 5th to 95th percentile. Statistical analysis was performed by using paired standard Student’s t test. The AKT/mTOR pathway has previously been shown to control glucose uptake and metabolism; therefore, we examined glucose transporter 1 (GLUT1) expression in RA patient PD-1+ and PD-1– B cells (22, 23). BCR engagement led to increased B cell GLUT1 expression that correlates with STAT3 phosphorylation, indicating a potential association between BCR signaling strength and GLUT1 upregulation, while additional TLR9-dependent signals enhanced the BCR-mediated effect (Figure 6B). PD-1+ B cells had significantly (P = 0.002 and P = 0.015, respectively) higher expression of GLUT1 and phosphorylation of STAT3 (P = 0.014 and P = 0.021, respectively) than PD-1– B cells under normoxic and hypoxic conditions (Figure 6B). The increased expression of GLUT1 led to significantly increased glucose uptake of PD-1+ compared with PD-1– B cells, under normoxic (P = 0.002) and hypoxic (P = 0.015) conditions, as assessed by the incorporation of the fluorescent glucose analog 2-(N-(7-nitrobenz-2-oxa-1,3-diazol-4-yl)amino)-2-deoxyglucose (2-NBDG) (Figure 6C). Additional indication that PD-1–expressing RA patient B cells rely on glycolysis is the increased mitochondrial mass of these cells under normoxic and hypoxic conditions compared with their PD-1– counterparts (Supplemental Figure 6). Deprivation of glucose by addition of the glucose analog 2-deoxyglucose (2DG) that fails to undergo glycolysis led to the elimination of PD-1–expressing B cells under in vitro stimulation conditions (Figure 6D). PD-1+ B cells had higher activation of STAT3 compared with PD-1– B cells; therefore, we inhibited STAT3 activation using a small molecular weight inhibitor, Stattic (24). STAT3 inhibition led to complete loss of PD-1+ B cells under normoxic and hypoxic conditions (P = 0.0014, P = 0.004, respectively) (Figure 6E). PD-1/PD-L1 interactions have been proposed to dampen down the BCR-mediated downstream signaling (25). Plate-bound recombinant PD-L1 was utilized to assess the effect of PD-1/PD-L1 engagement on the activation and metabolic status of PD-1+ B cells. PD-L1 did not result in decrease of CD80 and CD86 expression or AKT, mTOR, and S6 activation under normoxic or hypoxic conditions (Figure 6F). Altered cytokine, antigen presenting, and glycolysis gene signatures in ex vivo PD-1+ RA B cells. RNA-Seq analysis of ex vivo patient-derived B cells sorted on the basis of PD-1 revealed altered expression of approximately 900 genes between PD-1+ B cells and their PD-1– counterparts (Figure 7A). Principal components analysis (PCA) of PD-1+ and PD-1– B cells showed a separation between the 2 populations (Figure 7B). Proinflammatory cytokine gene expression for cytokines previously implicated in RA pathogenesis, namely TNFA, IL6, IL1B, and IL32, was significantly (P < 0.001) increased in PD-1+ B cells compared with PD-1– B cells while the immunomodulatory IL24 was significantly (P < 0.001) decreased (Figure 7C). Alterations were also observed in chemokine expression and genes involved in B cell maturation and activation, with PD-1+ B cells adopting an overall more activated profile than PD-1– B cells (Figure 7C). Several genes involved in glycolysis were significantly upregulated in PD-1+ B cells in contrast to PD-1– B cells, with pathway analysis showing enrichment in the glycolysis (P = 4.3 × 10⁻⁹), gluconeogenesis (P = 8.7 × 10⁻⁷), and oxidative phosphorylation (P = 4 × 10–40) pathways (Figure 7C, Supplemental Figure 7). To complement this analysis, a gene set enrichment analysis (GSEA) was performed on the differentially expressed genes ranked by their fold change values, using the Hallmark gene signature from the Broad Institute’s Molecular Signatures Database. This analysis showed an enrichment in the glycolysis gene signature (normalized enrichment score [NES] = 1.37, FDR = 0.222) and a stronger enrichment in genes corresponding to inflammatory response (NES = 1.77, FDR = 0.008) and TNF-α signaling through NF-κB (NES = 1.60, FDR = 0.018). Figure 7 Differential gene expression of ex vivo RA patient PD-1+ and PD-1– B cells. (A) Differential gene expression volcano plot of flow sorted, ex vivo RA patient–derived PD-1+ compared with PD-1– B cells. Red-colored genes show significant differential expression between the 2 groups. (B) PCA analysis of flow sorted, ex vivo RA patient PD-1+ and matched PD-1– B cells. Each point represents an independent sample. (C) Heatmap of RNA-Seq expression Z-scores for selected differentially regulated genes between PD-1+ and PD-1– B cells. Each column represents an individual sample. RA patient PD-1+ B cells are more glycolytic than their PD-1– counterparts. The data presented herein suggest an increased glycolytic capacity and glucose dependency of PD-1+ compared with PD-1– RA patient–derived B cells. In order to directly assess whether PD-1+ B cells are more reliant on either glycolysis or oxidative phosphorylation (OXPHOS), FLIM was utilized. FLIM is based on the principle of endogenous fluorescence molecules such as NAD and as a result requires no staining, fixation, or other type of processing of the target cells (26). FLIM’s capacity to distinguish between bound and unbound NAD is based on the self-quenching ability of NAD. In unbound NAD the nicotinamide and adenine rings are in close proximity, and the fluorescent signal decay following excitation is approximately 0.4 ns; however, NAD in its bound form has a significantly lower signal decay in the range of 2 ns because of stretching of the molecule, leading to longer distance between the nicotinamide and adenine rings and reduced self-quenching (26, 27). Importantly, higher unbound to bound NAD ratio is directly proportionate to the cell’s glycolytic versus oxidative metabolic capacity. Visualization of NAD by FLIM offers direct evidence of the cell’s metabolic state. FLIM analysis of RA patient–derived PD-1+ sorted B cells revealed a significant (P = 0.022) preference for glycolysis compared with matched PD-1– B cells (Figure 8, A and B). Figure 8 FLIM analysis of PD-1 B cell metabolic profile. (A) Representative multiphoton microscopy FLIM analysis of flow sorted RA patient–derived PD-1– and PD-1+ B cells (4 independent experiments were performed). (B) Average PD-1– and PD-1+ B cell emission lifetime (τavg) of NAD following excitation. n = 4/group. Data are presented as mean ± SEM. A reduction in τavg is reflected in an increase in free NAD and therefore increased glycolysis. Statistical analysis was performed by using paired standard Student’s t test. *P < 0.05. Discussion B cell depletion therapy has been efficacious for the treatment of patients with RA. However, opportunities for more targeted therapeutic intervention that can minimize potential side effects should be explored. Herein, we demonstrate a role for CXCR3 in the accumulation of switched and DN memory B cells at the site of inflammation in RA. Peripheral blood CXCR3-expressing B cells closely mirrored the B cell subpopulation distribution in the inflamed RA joint with overrepresentation of switched memory and DN memory B cells. A negative correlation between the frequency of CXCR3-expressing B cells and disease activity in RA patients, potentially because of increased migration of peripheral blood CXCR3-expressing B cells to the site of inflammation in RA patients with increased disease severity, further reinforces the contribution of CXCR3 in the migration of activated memory B cells and raises the possibility for early therapeutic intervention by inhibiting the CXCR3-mediated synovial migration of memory B cells. We have previously demonstrated that the RA joint is hypoxic with an average oxygen level of 3% and a positive correlation between hypoxia and synovial tissue cellular infiltration (17, 18). The effect of hypoxia on B cell function has not been fully elucidated; therefore, we examined the activation and costimulatory potential of RA patient–derived B cells, stimulated with physiologically relevant conditions under hypoxia, and identified a superior capacity of these cells to maintain proinflammatory cytokine production in a hypoxic environment recapitulating the inflamed joint. While the effect of hypoxia on RA B cell proinflammatory cytokine production was limited, with RA patient–derived B cells maintaining their capacity to produce proinflammatory cytokines, hypoxic conditions led to a reduction of proinflammatory cytokine production by HC-derived B cells. Therefore, hypoxia exacerbated the differences between HC- and RA patient–derived B cells. Additionally, RA patient–derived B cells cultured under hypoxic conditions expressed high levels of MMP-9 compared with HC-derived B cells; B cell MMP-9 expression has previously been correlated with clinical relapse in patients with multiple sclerosis and the capacity of B cells to invade the blood-brain barrier (28). In this study we identified a population of CXCR3hiPD-1+ B cells that preferentially accumulated in the synovial tissue in RA, as opposed to the peripheral blood, and were characterized by a markedly increased capacity for costimulation and proinflammatory cytokine production. PD-1+ B cells showed a strong dependency on glucose uptake and STAT3 activation and, based on direct visualization of bound and unbound forms of NAD by the potentially novel FLIM, were more glycolytic than their PD-1– counterparts. Altered gene expression in over 900 genes was observed between PD-1+ and PD-1– ex vivo patient B cells, with genes involved in B cell activation and proinflammatory cytokine production being upregulated in PD-1+ B cells compared with PD-1– B cells. Additionally the glycolysis, gluconeogenesis, and oxidative phosphorylation pathways were enriched in PD-1–expressing B cells. Several studies have previously demonstrated the capacity of B cells to express the T cell–associated coinhibitory factor PD-1. There is, however, a paucity of information on the functional effects of B cell PD-1 expression. A proposed mechanism of action for B cell PD-1 expression is the dampening of BCR-mediated downstream signaling, leading to decreased B cell activation and cytokine production (25, 29). Recent studies identify potentially tumorigenic B cells that express PD-1 and promote immune system regulation and tumor survival; however, there are discrepancies regarding the suggested mechanisms that these cells employ to exert their immunosuppressive effects. A study in patients with hepatoma shows PD-1+ B cell IL-10–dependent immune suppression of antitumor T cell responses, while a recent study in thyroid cancer patients highlights high PD-L1 expression and not IL-10 production by tumor PD-1 B cells as being responsible for T cell suppression and cancer survival (19, 30). An alternative suggested mechanism of action of B cell PD-1 that warrants further investigation is the possibility that PD-1 engages PD-L1 on the same cell in cis formation, resulting in reduced availability of PD-L1 for suppression of T cell activation during immunological synapse formation (31). We examined PD-L1 expression by RA patient–derived PD-1+ and PD-1– B cells and observed no differences in their capacity to express PD-L1. Although PD-1+ B cell IL-10 secretion was not assessed, these cells were more activated, evidenced by increased expression of CD86 and CD80, and produced high levels of several proinflammatory cytokines, including GM-CSF. Pathogenic GM-CSF–expressing B cells have recently been described in humans. GM-CSF expression is increased following in vitro BCR-mediated stimulation in the presence of surrogate T cell help, with multiple sclerosis patient–derived B cells showing significantly higher GM-CSF–secreting capacity than HC-derived B cells (32). The proinflammatory characteristics of RA patient–derived PD-1+ B cells were evident under normoxic, and more notably, under hypoxic conditions that more closely resembled the unique environment of the inflamed RA joint. RA patient PD-1+ B cells had higher activation of the AKT/mTOR/S6 pathway, leading to increased GLUT1 expression and glucose uptake under normoxic and hypoxic conditions compared with PD-1– counterparts. Deprivation of glucose led to loss of PD-1 expression, and STAT3 activation coupled with direct visualization of NAD in RA B cells revealed a potent glycolytic profile, delineating an important role of glycolysis for the maintenance of PD-1+ B cells. There is a paucity of data on the metabolic requirement of B cell activation and function, and the effect of glycolysis on B cell biology has only recently been explored. B cells, following stimulation, rapidly increased glycolysis in a GLUT1-dependent manner, paralleled with increased antibody-producing capacity (33). Humoral responses can be greatly influenced by changes in oxygen availability, with activated B cells becoming more glycolytic under hypoxic conditions (34). Importantly, B cells exposed to chronic B cell–activating factor and autoimmune-prone B cells maintain high glycolytic capacity, with deletion of Glut-1 leading to reduced B cell proliferation and impaired antibody production (33). The increased glycolytic capacity of PD-1 B cells could in addition to their activation/proliferation/cytokine secretion also affect the metabolites they are contributing to their microenvironment. Further studies analyzing the metabolite contribution and cytokine production of PD-1 B cells are required. While B cell infiltration of the joint correlates with disease activity and B cell depletion therapy leads to disease amelioration in autoantibody-positive and autoantibody-negative RA patients, B cells are a relatively small population of the immune infiltrate of the joint (5, 6). Further investigation of the role of B cells in synovitis and the particular role of RA joint PD-1 B cells is required. Additionally, a more expansive RA patient synovial biopsy sample size, inclusive of RA patients with high disease activity and paralleled with classification based on type of synovial infiltrate, would allow for the identification of relations between degree of PD-1 B cell infiltration, type of infiltrate, and synovitis. In conclusion, we provide evidence in support of early therapeutic intervention by inhibiting the role of CXCR3 in B cell migration to the synovial tissue and the potential for more specific B cell therapeutic targeting of pathogenic, glycolytic PD-1–expressing synovial B cells. We also highlight the importance of careful data extrapolation from normoxic to more physiologically relevant hypoxic conditions that closely resemble the unique environment of the inflamed joint. Methods Synovial tissue single-cell suspensions. Synovial biopsies (~15) were enzymatically and mechanically digested using the gentleMACS Tumor Dissociation Kit, human (Miltenyi Biotec), as per manufacturer’s instructions. Briefly, 15 synovial biopsies were placed in 4.7 mL of RPMI supplemented with 200 μL of enzyme H, 100 μL enzyme R, and 25 μL enzyme A in a gentleMACS C Tube followed by initial mechanical disruption of the tissue using program h_tumor_01 on a gentleMACS Dissociator. Samples were then incubated for a total of 1 hour at 37°C under continuous rotation using the MACSmix Tube Rotator with further applications of the gentleMACS Dissociator at the halfway point and at the end of the 1 hour incubation according to the manufacturer’s instructions. A single synovial cell suspension was generated by filtration through a 70 μm cell strainer. Matched PBMCs and SFMCs were also isolated using a density gradient preparation for direct comparison of B cell frequency in the circulation versus the inflamed synovium. Cell isolation and culture. B cells were isolated by magnetic bead cell sorting using negative (human B Cell Isolation Kit II, Miltenyi Biotec) or positive selection on the basis of CD19 expression (CD19 MicroBeads, human, Miltenyi Biotec) according to the manufacturer’s instructions. Purity of the isolated B cells was routinely checked by flow cytometric analysis for the detection of the B cell marker CD20 and was over 90%. Isolated B cells were then cultured in cRPMI (RPMI from Glutamax, Thermo Fisher Scientific), supplemented with 10% FBS (MilliporeSigma) and 1000 U/mL pen/strep (MilliporeSigma) in a 5% CO2 humidified incubator at 37°C under atmospheric O2 conditions or a humidified hypoxia chamber (5% CO2, 37°C) at 3% O2 as indicated. Cells were left unstimulated or were stimulated in vitro for 72 hours (at 1 × 10⁶ cells/mL) with combinations of aCD40 (5 μg/mL, G28.5, InVivoMAb, Bio X Cell), F(ab′)2 aIgG + aIgM H and L chain cross-linking antibody (1 μg/mL, catalog 16-5099-85, Thermo Fisher Scientific), and CpG ODN2006 (0.2 μM, InvivoGen). Following incubation, supernatants were collected for cytokine analysis by ELISA, and cells were either analyzed by flow cytometric analysis or flow sorted (4-laser BD Aria flow sorter) on the basis of PD-1 expression for subsequent FLIM analysis. Flow cytometric analysis. Isolated and in vitro–cultured HC and RA patient–derived B cells, PBMCs, SFMCs, and synovial tissue single-cell suspensions were subjected to flow cytometric analysis. The generation of synovial tissue single-cell suspension was performed as previously described (18). Briefly, approximately 15 synovial biopsies per patient were enzymatically and mechanically digested using the gentleMACS dissociation kit (Miltenyi Biotec) as per manufacturer’s instructions. Cells were then passed through a 70 μm cell strainer before analysis. All extracellular targets were evaluated for loss of expression due to enzymatic digestion. Of all the targets tested, only CD27 was cleaved and expression was artificially lost. However, incubation of the synovial tissue single-cell suspensions for 6 hours postdigestion restored CD27 B cell expression (Supplemental Figure 1). Following the generation of single-cell suspensions, cells were washed in PBS and incubated with LIVE/DEAD fixable NIR (Thermo Fisher Scientific) viability reagent as per the manufacturer’s instructions. Cells were then incubated with TruStain FcX receptor blocking solution (BioLegend) to minimize nonspecific antibody binding. Next, cells were stained with antibody combinations targeting surface markers for 30 minutes at 4°C (Supplemental Table 1). Following incubation, cells were washed twice in FACS buffer (PBS with 2% FBS and 0.002% w/v sodium azide). If intracellular staining was required, cells were subsequently fixed and permeabilized using the intracellular Foxp3 staining kit (eBioscience, Thermo Fisher Scientific) as per the manufacturer’s instructions. Briefly, following incubation with the kit’s fix/perm buffer at 4°C for 30 minutes, cells were washed in perm buffer and incubated with antibody combinations for intracellular staining for 30 minutes at 4°C (Supplemental Table 1). Cells were then washed once with perm buffer and once with the FACS buffer before acquisition on a 4-laser LSRFortessa cytometer (BD). Glucose uptake and mitochondrial mass analysis. Sorted B cells were cultured in vitro under normoxic or hypoxic conditions and stimulated as described herein. For the last 30 minutes of culture, the cell culture medium was replaced with glucose-free RPMI (Thermo Fisher Scientific) supplemented with 1000 U/mL pen/strep (MilliporeSigma) and 50 μM of 2-NBDG (Invitrogen, Thermo Fisher Scientific). Prior to addition of the glucose-free cell culture medium, the media were left to equilibrate under the respective normoxic or hypoxic conditions of the cells. Following incubation, cells were washed in PBS, incubated with viability dye followed by Fc blocking step and extracellular staining as described herein, and then immediately acquired on a 4-laser Fortessa analyzer (BD). Relative mitochondrial mass was estimated based on incorporation of MitoTracker Green (Thermo Fisher Scientific). RA patient–derived B cells were isolated and stimulated under normoxic and hypoxic conditions as described herein. During the last 30 minutes of culture, cells were washed and resuspended in RPMI without FBS supplemented with 20 nM of MitoTracker Green. Cells were washed and stained for viability and expression of PD-1 before acquisition on a 4-laser Fortessa analyzer. Immunofluorescence. Synovial biopsies were fixed in 10% neutral-buffered formalin solution followed by paraffin embedding. Synovial tissue sections, 3 μm thick, were heated for 30 minutes at 60°C, deparaffinized in xylene, and rehydrated in alcohol and deionized water. Antigen retrieval was performed by heating sections in antigen retrieval solution (15 mL of 1 M sodium citrate and 15 mL of 1 M citric acid in deionized water, pH 6.0) in a pressure cooker. Slides were washed in PBS for 5 minutes. Nonspecific binding was blocked using 10% casein in PBS for 30 minutes. Primary antibodies aPD-1 (Abcam, clone: NAT105) and aCD19 (Thermo Fisher Scientific, clone: JF100-06) were incubated on sections for 2 hours at room temperature. An IgG1 control antibody (Dako) was used as a negative control. Slides were washed in PBS/Tween followed by 1-hour incubation at room temperature with secondary Cy2 (catalog 115-225-146) and Cy3 (catalog 111-165-144) AffiniPure secondary antibodies (Jackson ImmunoResearch). Slides were washed with PBS/Tween and PBS, before counterstaining of nuclei with DAPI (MilliporeSigma) and cover slide mounting with ProLong Gold Antifade (Thermo Fisher Scientific). Stained cells were visualized with a Leitz DM40 microscope (Leica Microsystems), and images were captured using the AxioCam system and AxioVision 3.0.6 software (Carl Zeiss Inc). ELISA. Tissue culture supernatants of sorted and in vitro–cultured B cells were analyzed by ELISA for the presence of IL-6 (DuoSet, R&D, Bio-Techne) or TNF-α (DuoSet, R&D Systems, Bio-Techne) according to the manufacturer’s instructions. PCR. RA patient and HC peripheral blood B cells were isolated and cultured under normoxic or hypoxic conditions as described herein. Total RNA was isolated using the RNeasy Mini Kit (QIAGEN) according to the manufacturer’s instructions. RNA quantification was performed on a NanoDrop spectrophotometer (Thermo Fisher Scientific). Samples with a 260/280 nm and 260/230 nm ratio of 1.8 or above were used for subsequent cDNA synthesis. Total RNA was reverse-transcribed to cDNA using the RT2 First Strand Kit (QIAGEN) as per manufacturer’s instructions. Genomic DNA elimination was performed as described previously (19). PCR was performed using the RT2 SYBR Green Mastermix (QIAGEN) as per the manufacturer’s instructions. PCR was performed on a LightCycler 480 System (Roche Diagnostics) with the following primers: MMP9 forward: ATTGGATCCAAAACTACTCGGAAGA, MMP9 reverse: GGGCAAAGGCGTCGTCAATC. Relative gene expression changes were determined by the 2−ΔΔCt method and normalized to the housekeeping gene RPLPO (primers: forward: GCGTCCTCGTGGAAGTGACATCG and reverse: TCAGGGATTGCCACGCAGGG) (all from Microsynth). Cell invasion assays. RA patient–derived B cells, isolated as described herein, were seeded at a density of 1.5 × 10⁴ cells per well with aCD40 (5 μg/mL) in the migration chamber of a 24-well Corning Matrigel (8 μm membrane precoated with Matrigel, Thermo Fisher Scientific) with or without addition of the small molecular weight antagonist of CXCR3, AMG487 (200 μM, Tocris, Bio-Techne). Medium supplemented with or without 10% RA patient ex vivo synovial biopsy-conditioned media was added to the well. The cells were incubated for 24 hours. Noninvading cells remaining on the migration chamber were removed and counted by flow cytometric analysis using cell counting beads (CountBright absolute counting beads, Thermo Fisher Scientific) following LIVE/DEAD and CD20 staining. Cells that migrated from the insert to the corresponding well were similarly counted by flow cytometric analysis. Fluorescence lifetime imaging microscopy. Peripheral blood RA patient–derived B cells, isolated as described above, were stimulated in vitro for 72 hours with aCD40 (5 μg/mL), F(ab′)2 aIgG + aIgM H and L chain cross-linking antibody (1 μg/mL), and CpG ODN2006 (0.2 μM). Cells were cultured at 1 × 10⁶ cells/mL. B cells were then flow sorted with a purity greater than 98% on the basis of PD-1 expression using a 4-laser Aria sorter (BD) and were immediately transferred to an 18-well 15-μ-Slide (Ibidi). FLIM utilizes endogenous fluorophores such as NAD in order to obtain an image. FLIM’s capacity to distinguish between bound and unbound NAD is based on the self-quenching process of NAD. In unbound NAD, the nicotinamide and adenine rings are in close proximity, and the fluorescence decay signal following excitation is approximately 0.4 ns. When in protein-bound form, NAD has a significantly longer fluorescence lifetime in the range of 2–4 ns due to stretching of the molecule, leading to longer distance between the nicotinamide and adenine rings and reduced self-quenching (20–22). FLIM was performed using an upright Olympus BX61W1 multiphoton microscopy system equipped with a Ti:Sapphire Laser (Chameleon Ultra, Coherent), a water-immersion objective (×25 Olympus 1.05 NA), and a temperature-controlled stage (37°C). NAD excitation was performed at a wavelength of 760 nm, and fluorescence emission was selected with a 455/90 nm bandpass filter. Fluorescence decay measurements were obtained using a PicoHarp 300 TCSPC system operating in the time-tagged mode coupled with a photomultiplier detector assembly hybrid detector (PicoQuanT GmbH) at 256 time bins per pixel. A 2-component fitting was used to differentiate between the free (τ1) and protein-bound (τ2) NAD(P)H: the average lifetime (τavg) of NAD(P)H for each pixel was calculated by a weighted average of both free and bound lifetime contributions: τavg = ([α1 × τ1] + [α2 × τ2])/(α1 + α2). RNA-Seq. Single-end 75-bp RNA-Seq at a read depth of 50,000,000 reads per sample was performed. Raw reads from FASTQ files were assessed for quality using FastQC. The reads were then pseudoaligned and transcript expression quantified (35) with kallisto. Transcripts were annotated with the Homo sapiens Ensembl version 86 build. The resulting transcript counts were used for differential analysis with edgeR after removal of transcripts with low counts. Testing for differential expression was performed using the generalized linear model options in edgeR (glmQFTest function in the Bioconductor edgeR package). Our RNA-Seq data have been deposited in the NCBI’s Gene Expression Omnibus database (accession number GSE154988). PCA plots of the samples based on their transcript profiles were plotted using the R stats and ggplot2 packages. Downstream pathway enrichment studies were performed using a variety of methods, including GSEA and gene set variation analysis as implemented in the corresponding R/Bioconductor package. Further information can be found in Supplemental Methods. Statistics. Statistical analysis was performed using Prism 7 (GraphPad) software. One-way or 2-way ANOVA with Tukey’s multiple-comparisons test and unpaired 2-tailed standard Student’s t test was used as indicated. Statistical significance was considered with P values of less than 0.05. Study approval. Peripheral blood, SF, and synovial tissue samples were collected from patients who were recruited from the Rheumatology Department, St. Vincent’s University Hospital; University College Dublin; and Tallaght University Hospital, Trinity College Dublin (Supplemental Table 2 and Supplemental Table 3). HC peripheral blood samples were obtained from buffy coats from St. James’s Hospital blood transfusion department and healthy volunteers recruited at Trinity Biomedical Sciences Institute and St. Vincent’s University Hospital. All subjects gave fully informed written consent approved by the institutional Ethics Committee, and research was performed in accordance with the Declaration of Helsinki. RA patient arthroscopies were performed under local anesthetic using Wolf 2.7 mm needle arthroscopy or ultrasound-guided biopsy as previously described (17). Author contributions AF designed and performed experiments, analyzed data, and wrote the manuscript. NN performed FLIM assay and analyzed data. VM performed experiments. KM recruited patients and obtained patient samples. BM performed flow cytometric cell sorting. MGM analyzed data and wrote the manuscript. CL recruited patients and obtained patient samples. RHM recruited patients and obtained patient samples. NR analyzed data. VK performed RNA-Seq data analysis and wrote the manuscript. SN analyzed data and wrote the manuscript. DJV recruited patients and obtained patient samples, analyzed data, and wrote the manuscript. UF designed experiments, analyzed data, and wrote the manuscript. Supplemental material View supplemental data Acknowledgments Graphical abstract created with BioRender. This work was supported by the Health Research Board (ILP-POR-2017-047) and Arthritis Ireland. Footnotes Conflict of interest: NR, VK, and SN are current or former employees of Janssen Research & Development, Johnson & Johnson. Copyright: © 2020, Floudas et al. This is an open access article published under the terms of the Creative Commons Attribution 4.0 International License. Reference information: JCI Insight. 2020;5(21):e139032.https://doi.org/10.1172/jci.insight.139032. References Aletaha D, Blüml S. Therapeutic implications of autoantibodies in rheumatoid arthritis. RMD Open. 2016;2(1):e000009. View this article via: PubMed CrossRef Google Scholar Guo Y, et al. Immune checkpoint inhibitor PD-1 pathway is down-regulated in synovium at various stages of rheumatoid arthritis disease progression. PLoS One. 2018;13(2):e0192704. View this article via: PubMed CrossRef Google Scholar Johnson DB, Sullivan RJ, Menzies AM. Immune checkpoint inhibitors in challenging populations. Cancer. 2017;123(11):1904–1911. View this article via: PubMed CrossRef Google Scholar Cohen MD, Keystone E. Rituximab for rheumatoid arthritis. Rheumatol Ther. 2015;2(2):99–111. View this article via: PubMed CrossRef Google Scholar Mease PJ, et al. Efficacy and safety of retreatment in patients with rheumatoid arthritis with previous inadequate response to tumor necrosis factor inhibitors: results from the SUNRISE trial. J Rheumatol. 2010;37(5):917–927. View this article via: PubMed CrossRef Google Scholar Lewis MJ, et al. Molecular portraits of early rheumatoid arthritis identify clinical and treatment response phenotypes. Cell Rep. 2019;28(9):2455–2470.e5. View this article via: PubMed CrossRef Google Scholar Humby F, et al. Synovial cellular and molecular signatures stratify clinical response to csDMARD therapy and predict radiographic progression in early rheumatoid arthritis patients. Ann Rheum Dis. 2019;78(6):761–772. View this article via: PubMed CrossRef Google Scholar Váncsa A, et al. Longterm effects of rituximab on B cell counts and autoantibody production in rheumatoid arthritis: use of high-sensitivity flow cytometry for more sensitive assessment of B cell depletion. J Rheumatol. 2013;40(5):565–571. View this article via: PubMed CrossRef Google Scholar Haraoui B, Cividino A, Stewart J, Guérette B, Keystone EC. Safety and effectiveness of adalimumab in a clinical setting that reflects Canadian standard of care for the treatment of rheumatoid arthritis (RA): results from the CanACT study. BMC Musculoskelet Disord. 2011;12:261. View this article via: PubMed Google Scholar Gerlag DM, et al. Effects of B-cell directed therapy on the preclinical stage of rheumatoid arthritis: the PRAIRI study. Ann Rheum Dis. 2019;78(2):179–185. View this article via: PubMed CrossRef Google Scholar Cohen SB, et al. Continued inhibition of structural damage over 2 years in patients with rheumatoid arthritis treated with rituximab in combination with methotrexate. Ann Rheum Dis. 2010;69(6):1158–1161. View this article via: PubMed CrossRef Google Scholar Palanichamy A, et al. Rituximab efficiently depletes increased CD20-expressing T cells in multiple sclerosis patients. J Immunol. 2014;193(2):580–586. View this article via: PubMed CrossRef Google Scholar Schuh E, et al. Features of human CD3+CD20+ T cells. J Immunol. 2016;197(4):1111–1117. View this article via: PubMed CrossRef Google Scholar Huang H, Benoist C, Mathis D. Rituximab specifically depletes short-lived autoreactive plasma cells in a mouse model of inflammatory arthritis. Proc Natl Acad Sci U S A. 2010;107(10):4658–4663. View this article via: PubMed CrossRef Google Scholar Anolik JH, et al. Delayed memory B cell recovery in peripheral blood and lymphoid tissue in systemic lupus erythematosus after B cell depletion therapy. Arthritis Rheum. 2007;56(9):3044–3056. View this article via: PubMed CrossRef Google Scholar Palanichamy A, et al. Novel human transitional B cell populations revealed by B cell depletion therapy. J Immunol. 2009;182(10):5982–5993. View this article via: PubMed CrossRef Google Scholar Ng CT, et al. Synovial tissue hypoxia and inflammation in vivo. An
|
|
|
Scooped by
Gilbert C FAURE
June 21, 9:46 AM
|
Innate lymphoid cells (ILCs) are emerging as critical modulators of inflammation in rheumatoid arthritis, contributing to both disease pathology and resolution. Group 3 ILCs (ILC3s) mirror TH17 cells in their production of IL-17A and IL-22, promoting fibroblast activation, neutrophil recruitment and synovial inflammatory cascades. By contrast, group 2 ILCs (ILC2s) engage reparative and immunoregulatory pathways via secretion of IL-9, IL-13 and IL-10. Lymphoid tissue inducer (LTi) ILCs contribute to ectopic lymphoid tissue neogenesis and stromal remodelling in early disease. Clinically, alterations in ILC subset composition correlate with disease activity, therapeutic responsiveness and inflammatory burden. Advances in high-dimensional immunophenotyping, spatial transcriptomics and single-cell multi-omics now enable precise mapping of ILC subsets and their effector programmes across peripheral blood and synovial tissue, supporting their use in biomarker discovery and treatment pipelines. Furthermore, modulation of ILCs by targeting upstream cytokines, signalling pathways or the use of microbiota-derived metabolites is a potential therapeutic strategy. Finally, cell-based avenues include IL-10-producing ILC2s (ILC210) and engineered chimeric antigen receptor (CAR)-ILC2s for targeted, tissue-resident immune modulation. Although still in the preclinical stages, these approaches highlight the translational potential of ILCs as biomarkers and therapeutic targets in rheumatoid arthritis. Innate lymphoid cells (ILCs) influence rheumatoid arthritis by amplifying inflammatory circuits through ILC3 activity and promoting immune regulation via ILC2 responses. These context-dependent functions position ILC subsets as emerging biomarkers and targets for innovative therapies.
|
|
Scooped by
Gilbert C FAURE
March 14, 2:14 PM
|
Synovial inflammation is a central feature of knee osteoarthritis (OA), linking systemic and local pathogenic pathways with clinical outcomes. This re…
|
|
Scooped by
Gilbert C FAURE
October 9, 2025 5:57 AM
|
📢 NEW REVIEW
Although psoriatic arthritis and rheumatoid arthritis are both common types of inflammatory arthritis characterised by synovial inflammation, there are distinct molecular and cellular landscapes between these conditions.
In this Review, Ryan Malcolm Hum and colleagues explore how research of the synovium has advanced the understanding of psoriatic arthritis, the potential of identified cell types and cytokines as biomarkers and novel therapeutic targets, how limited sample sizes in high-dimensional studies are hindering clinical translation, and the future directions for synovial research in psoriatic arthritis.
Maria Christofi, Lysette Marshall, NIHR Manchester Biomedical Research Centre (BRC)
Read the full Review here ➡️ https://lnkd.in/eFY6uAbF
Alt text: Previously identified cell types and cytokines implicated in psoriatic arthritis pathogenesis in the synovial fluid and synovial tissue
|
|
Scooped by
Gilbert C FAURE
August 10, 2024 4:46 AM
|
Osteoarthritis (OA) is a highly prevalent joint disease that causes substantial disability, yet effective approaches to disease prevention or to the delay of OA progression are lacking. Emerging evidence has pinpointed ion channels as pivotal mediators in OA pathogenesis and as promising targets for disease-modifying treatments. Preclinical studies have assessed the potential of a variety of ion channel modulators to modify disease pathways involved in cartilage degeneration, synovial inflammation, bone hyperplasia and pain, and to provide symptomatic relief in models of OA. Some of these modulators are currently being evaluated in clinical trials. This review explores the structures and functions of ion channels, including transient receptor potential channels, Piezo channels, voltage-gated sodium channels, voltage-dependent calcium channels, potassium channels, acid-sensing ion channels, chloride channels and the ATP-dependent P2XR channels in the osteoarthritic joint. The discussion spans channel-targeting drug discovery and potential clinical applications, emphasizing opportunities for further research, and underscoring the growing clinical impact of ion channel biology in OA. Ion channels have key functions in chondrocytes, bone cells, immune cells and neurons. Liu and colleagues discuss how these functions might contribute to cartilage degeneration, bone formation inflammation and pain in osteoarthritis, and highlight the therapeutic potential of ion channel modulators.
|
|
Scooped by
Gilbert C FAURE
December 2, 2023 4:35 AM
|
WHAT IS ALREADY KNOWN ON THIS TOPICPatients with rheumatoid arthritis (RA) can be divided into seropositive and seronegative subgroups. The presence of antibodies against post-translationally modified (PTM) proteins such as citrullinated proteins is nowadays used as a diagnostic and prognostic marker in RA. Antibodies directed against carbamylated proteins have more recently been shown to be present in a subset of the seronegative patients and are associated with bone erosions in that group.WHAT THIS STUDY ADDSIn this study, two different anti-PTM antibodies are investigated: anti-advanced glycation end-product modified protein antibodies (anti-AGE) and anti-malondialdehyde-acetaldehyde adduct modified protein antibodies (anti-MAA). These antibodies can be detected in several forms of inflammatory arthritis. Within seronegative RA (negative for rheumatoid factor, anti-citrullinated protein antibodies and anti-carbamylated protein antibodies), 16.9% of patients are positive for anti-MAA and/or anti-AGE antibodies. This subgroup is characterised by an association with HLA-DRB1*03, increased radiographic joint damage and (for anti-MAA) inflammation.HOW THIS STUDY MIGHT AFFECT RESEARCH, PRACTICE OR POLICYThe presence of anti-PTM antibodies like anti-AGE and anti-MAA in patients with RA and other patients with inflammatory arthritis previously considered to be seronegative, may not only serve as a prognostic marker, but importantly may contribute to understanding the pathogenesis of these conditions, including a subset of RA.IntroductionIn rheumatoid arthritis (RA) around two-thirds of patients are autoantibody positive for rheumatoid factor (RF), anti-citrullinated protein antibodies (ACPA) and/or anti-carbamylated protein (anti-CarP) antibodies.1 The remaining seronegative subgroup of RA is clinically heterogeneous and thus far no reliable biomarkers are available to identify these patients or predict their disease course.1ACPA and anti-CarP are antibodies that recognise proteins that have undergone post-translational modification (PTM), citrullination of arginine and carbamylation of lysine respectively.2 3 However, many other types of PTMs exist.4 Two examples of PTMs that are found to associate with disease are advanced glycation end-products (AGE) and malondialdehyde-acetaldehyde adducts (MAA). AGEs are a result of oxidative stress and tissue damage5 and are, for example, present in patients with diabetes mellitus type 2.6 Interestingly, in these patients also antibodies directed against this PTM were observed.6 MAA modifications are a result of reactive oxygen species that are formed during inflammation and oxidative stress.7 Both MAA-modified proteins and anti-MAA antibodies are found in patients with RA, as well as in other diseases.7 AGE and MAA are both highly immunogenic PTMs.8 9 Therefore, it is plausible that antibodies against AGE and MAA are also present in patients with arthritis.Seronegative RA is associated with HLA-DRB1*03, suggesting a role for immunopathology driven by, for example, B cell immunity.10 Indeed, within the ACPA-negative patients, the presence of anti-CarP was associated with HLA-DRB1*03.11 12 However, it did not yet explain the full HLA-DRB1*03 association, raising the possibility that other anti-PTM responses may be present in ‘seronegative’ RA that are present in the remainder of the HLA-DRB1*03 positive individuals.13 14 On top of this haplotype association, within these patients with ACPA-negative RA, anti-CarP was found to associate with a more severe radiological progression.3 Patients with seronegative RA are a diverse group of patients that in many ways resemble undifferentiated arthritis. Presence of antibodies, like anti-PTM antibodies, might help to better understand and characterise subgroups that possibly belong to this so-called seronegative RA.We therefore investigated whether anti-AGE and anti-MAA antibodies are present in patients with RA and other forms of arthritis, and whether they could potentially close the so-called serological gap1 in seronegative RA.MethodsPatientsOne thousand one hundred eighty-six patients with arthritis of at least one joint and a symptom duration of less than 2 years were included in the Leiden Early Arthritis Clinic (EAC) cohort.15 Data were collected at baseline and follow-up (4, 12 months and yearly thereafter). Patients were being followed as long as the patient remained being seen clinically by the rheumatologist. RA was classified based on the 1987 American College of Rheumatology criteria (n=648).16 Definitive diagnoses other than RA (n=538) were made by the treating physician after 1 year of follow-up and were predominantly psoriatic arthritis (PsA) (n=100), inflammatory osteoarthritis (n=95) and gout (n=93) besides other more rare forms of arthritis. For this manuscript, the following diagnoses were termed autoimmune (AI): RA, PsA, spondyloarthritis, sarcoidosis, systemic lupus erythematosus (SLE) and paraneoplastic arthritis. The diagnoses termed as non-autoimmune (non-AI) were: gout, pseudogout and septic arthritis. Clinical and demographic patient characteristics were collected as described previously.17Genotyping, radiological progression and remissionFrom all patients, HLA genotypes were established as described previously.18 The alleles that were marked as shared epitope-encoding HLA (HLA-SE) positive were: HLA-DRB1*01:01, 01:02, 04:01, 04:04, 04:05, 04:08, 10:01 and 14:02. For the radiological progression analyses, 2853 X-ray sets of the hands and feet of 635 patients with RA were scored as described previously using the Sharp-van der Heijde score (SHS).19 20 Sustained drug-free remission (SDFR) was defined as the absence of clinical synovitis after discontinuation of disease-modifying antirheumatic drug treatment, that persisted for the entire follow-up, being at least 1 year.21Anti-AGE and anti-MAA measurementsAnti-AGE and anti-MAA antibodies were detected using an in-house ELISA based on modified fetal calf serum (FCS) as described previously.22 Briefly, modified and non-modified FCS were coated to a Nunc Maxisorp ELISA plate (430341, Thermofisher). In between each sequential step, plates were washed three times using phosphate buffered saline (PBS)/0.05%Tween (Sigma, P1379). After blocking (PBS/1%bovine serum albumin) for 6 hours at 4°C plates were incubated overnight at 4°C with 1/100 or 1/1000 diluted serum for anti-AGE and anti-MAA, respectively. Each plate contained a standard of anti-PTM positive serum to calculate arbitrary units. After incubation, IgG levels were detected using Rabbit-anti-Human IgG-HRP (Dako, P0214). Plates were developed by incubating with 2,2'-azino-bis(3-ethylbenzothiazoline-6-sulfonic acid (ABTS)/0.015% H2O2 (A1888 and 7722-84-1, both from Merck) and absorbance at 415 nm was measured using a microplate reader (Bio-Rad iMark). The cut-off for positivity was set as the mean arbitrary units plus two times the SD of 80 healthy controls, excluding values higher than 10× the mean.Statistical analysisIndependent samples t-test and Mann-Whitney U tests were used to analyse the baseline characteristics. The association of HLA-DRB1*03 with autoantibodies was assessed with logistic regression, and stratified for anti-cyclic citrullinated peptide 2 (anti-CCP2) and anti-CarP if relevant. Correlations between anti-PTM antibodies and inflammatory markers were calculated using Spearman’s rank correlation. For the radiological progression analyses, a multivariate normal regression model for longitudinal data was used with SHS as response variable. The model controlled for the age, sex and inclusion year of the patients.19 SDFR development until follow-up was calculated using Kaplan-Meier survival analysis and Cox’s regression. All statistical analysis were performed using SPSS statistics V.25 (IBM).ResultsAnti-AGE and anti-MAA in patients with arthritisBaseline characteristics are described in table 1. Anti-PTM antibody levels were measured in RA and non-RA arthritis patients and compared with healthy controls (figure 1A,B and online supplemental table 1). The non-RA arthritis group was divided into subgroups and separately depicted based as AI arthritis (without RA) including PsA, paraneoplastic arthritis, SLE, sarcoidosis and spondyloarthritis and as non-AI arthritis including septic arthritis, gout and pseudogout.Supplemental material[rmdopen-2023-003480supp001.pdf]View inline View popup Table 1 Baseline characteristics of the rheumatoid arthritis (RA), non-RA, autoimmune no RA and non-autoimmune group<img class="highwire-fragment fragment-image" height="440" src="https://rmdopen.bmj.com/content/rmdopen/9/4/e003480/F1.medium.gif"; width="315" alt="Figure 1">Download figure Open in new tab Download powerpoint Figure 1 Anti-AGE and anti-MAA show higher levels in RA and occur in a subgroup of patients with anti-CarP anti-CCP2 negative RA. IgG antibody levels of anti-AGE (A) and anti-MAA (B) in patients with (n=648) and without (n=538) RA. Early patients with arthritis were separately depicted as groups: AI without RA (including psoriatic arthritis, paraneoplastic arthritis, SLE, sarcoidosis and spondyloarthritis) and non-AI (including septic arthritis, gout, pseudogout). (C) Upset plots of groups of patients with RA (n=499*) positive for anti-PTM combinations; anti-AGE, anti-MAA, anti-CarP, anti-CCP2 and RF. *Data for anti-CarP was missing for 149 patients with RA. AGE, advanced glycation end-product; AI, autoimmune; aU/mL, arbitrary units per mL; CarP, carbamylated protein; CCP2, citrullinated cyclic peptide 2; MAA, malondialdehyde acetaldehyde adduct; RA, rheumatoid arthritis; RF, rheumatoid factor.Compared with healthy controls, anti-AGE and anti-MAA were most prevalent in RA (anti-AGE: 7.5% in HC vs 44.6% in RA and anti-MAA: 3.8% in HC vs 46.1% in RA) but were also present in other types of early arthritis. Within patients without RA, anti-AGE and anti-MAA were present in 32.9% and 30.3%, respectively and in non-RA AI arthritis anti-AGE and anti-MAA were found in 38.5% and 41.5%, respectively. These data indicate that the presence of anti-PTM antibodies is not specific for RA. When analysing combinations of autoantibodies, the largest subgroup of patients with RA (n=99) had all four anti-PTM antibodies (anti-AGE, anti-MAA, anti-CarP, anti-CCP2) as well as RF, after which the second largest group (n=63) was characterised by the combination of RF, anti-CCP2 and anti-CarP (figure 1C).Interestingly, 67 (34.0%) and 57 (28.9%) of patients with seronegative (RF negative, ACPA negative and anti-CarP negative) RA were positive for anti-AGE and anti-MAA, respectively. Moreover, 40 (20.3%) of these patients with seronegative RA were positive for both anti-AGE and anti-MAA. These anti-PTM responses may identify a new subgroup in the patients with otherwise seronegative RA.HLA-DRB1*03 associates with anti-AGE and anti-MAA independently of anti-CarP in patients with anti-CCP2-negative RASince HLA class II alleles are known to associate with autoantibody positivity in RA, we sought to investigate the presence of HLA-SE and its association with anti-AGE and anti-MAA antibodies. Of all patients with RA, 63.3% were HLA-SE+ (table 1). Based on the well-known association between HLA-SE and RA, the HLA-SE alleles were assessed and were significantly more prevalent in all RA subgroups compared with healthy controls. In the anti-AGE-positive group, as compared with patients with anti-AGE-negative RA however, the prevalence of HLA-SE alleles was similar (table 2). The same was true for anti-MAA; therefore, both anti-AGE and anti-MAA antibodies were not associated with HLA-SE.View inline View popup Table 2 Association between anti-AGE and anti-MAA antibodies and HLA-SE and HLA-DRB1*03 presence in RA and HLA-DRB1*03 presence in non-RA patients from the Leiden EAC cohortSince HLA-DRB1*03 is associated with seronegative RA and anti-CarP antibodies in this disease subset, we sought to investigate the association of HLA-DRB1*03 with anti-AGE and anti-MAA. In patients with RA, HLA-DRB1*03 was more prevalent in anti-AGE-positive and anti-MAA-positive patients as compared with healthy controls with OR values of 1.34 (95% CI 1.01 to 1.78, p=0.05) and 1.29 (95% CI 0.96 to 1.73, p=0.09), although this did not achieve statistical significance compared with anti-AGE-negative or anti-MAA-negative patients, respectively (table 2, part I). To investigate whether HLA-DRB1*03 is associated with anti-MAA and anti-AGE in anti-CCP2-negative RA, we focused on this subset and stratified the analysis for anti-CarP. Within the patients with anti-CCP2 negative RA, anti-AGE and anti-MAA antibodies were associated with HLA-DRB1*03 compared with healthy controls (OR: 1.98, 95% CI 1.27 to 3.07, p=0.003, and OR: 2.37, 95% CI 1.50 to 3.74, p<0.001, respectively). Anti-MAA was associated with HLA-DRB1*03 in the anti-CCP2 negative stratum independent of anti-CarP (OR: 1.91, 95% CI 1.11 to 3.30, p=0.02) (table 2, part II). In this stratified analysis, anti-AGE showed the same trend for association but did not reach significance (OR: 1.48, 95% CI 0.86 to 2.52, p=0.16). Since anti-AGE and anti-MAA often co-occur, we next stratified the association analysis for these autoantibodies, to dissect whether the observed association to HLA-DRB1*03 could be attributed to one of them in particular. After stratification for anti-AGE or anti-MAA, only patients with double positive RA showed a significant association with HLA-DRB1*03 compared with healthy controls (online supplemental table 2, part I). Since some controversy exists on the association of HLA-DRB1*03 in patients with anti-CCP2 negative RA, we investigated the association between anti-AGE and anti-MAA with HLA-DRB1*03 within patients with HLA-SE negative RA. In both HLA-SE negative and anti-CCP2 negative stratum, we find similar associations with anti-AGE/-MAA and HLA-DR1*03 (table 2, part III).In non-RA arthritis patients, both anti-AGE and anti-MAA showed a similar association with HLA-DRB1*03 with OR values of 2.34 (95% CI 1.58 to 3.47, p<0.001) and 1.94 (95% CI 1.29 to 2.92, p=0.002) compared with healthy controls (table 2, part I). In a comparison within the non-RA arthritis patients, HLA DRB1*03 remained significantly associated with anti-AGE-positive compared with anti-AGE-negative patients (OR: 2.22, 95% CI 1.28 to 3.84, p=0.01), while the association with anti-MAA did not remain significant. To disentangle the effects of anti-AGE and anti-MAA, analyses were again stratified, after which only the presence of anti-AGE in patients with anti-MAA-negative without RA remained significantly associated with HLA-DRB1*03 (online supplemental table 2, part II).Taken together, these data indicate that anti-AGE and anti-MAA associate with HLA-DRB1*03 in RA and non-RA arthritis patients, and that this association (which cannot be ascribed to anti-AGE or anti-MAA in particular) is mainly present in patients with anti-CCP2 negative RA. Similar associations were observed in patients with HLA-SE negative RA.Inflammation markers associate with anti-MAA positivity in RA and non-RA arthritisNext, we sought to investigate whether anti-PTM antibodies correlate with inflammation markers erythrocyte sedimentation rate (ESR) and C reactive protein (CRP) (table 3). Higher inflammation parameters in anti-AGE- and anti-MAA-positive individuals were observed in RA and non-RA arthritis patients, and in both the autoimmune and non-autoimmune subgroups of patients with arthritis. To investigate whether both anti-MAA and anti-AGE were associated with acute phase reactants in RA independently, anti-AGE and anti-MAA were stratified for each other. After this stratification, anti-AGE was no longer associated with either CRP or ESR whereas the association of anti-MAA with these inflammation markers remained significant (online supplemental table 3). These data indicate that anti-PTM responses, especially anti-MAA, is associated with markers of inflammation in early arthritis in both RA and non-RA arthritis patients.View inline View popup Table 3 Association between anti-AGE and anti-MAA antibin RA and non-RA arthritis patientsodies and ESR and CRP levelsAnti-AGE and anti-MAA associate with radiological progression in patients with anti-CCP2-negative RAWe next analysed if the presence of anti-AGE and anti-MAA is associated with radiological progression in RA. Anti-AGE-positive patients displayed more radiographic damage per year than anti-AGE-negative patients (p<0.001) (figure 2A). Data were then stratified for anti-CCP2, which revealed that this association was mainly present in the anti-CCP2-negative subgroup (figure 2B). When anti-CCP2 negative patients were further stratified for anti-CarP, the association between anti-AGE and radiographic progression remained significant (figure 2C). This indicates that in patients with anti-CCP2 negative RA, anti-AGE is associated with radiological progression independent of anti-CarP, suggesting that this anti-PTM antibody could discriminate a different subgroup. Anti-MAA positivity was also associated with radiological progression (p=0.002) (figure 2D). This effect was also observed in the anti-CCP2-negative stratum (figure 2E), although no longer significant after stratifying for anti-CCP2. The latter could be a consequence of power as the effect size (beta) which decreased only slightly to 1.03/year, p=0.16 (figure 2E).<img width="393" alt="Figure 2" height="440" class="highwire-fragment fragment-image" src="https://rmdopen.bmj.com/content/rmdopen/9/4/e003480/F2.medium.gif">Download figure Open in new tab Download powerpoint Figure 2 Anti-AGE and anti-MAA associate with radiological progression in patients with RA (n=600). (A) Radiological progression in anti-AGE positive and negative RA. (B) Data stratified for CCP2. (C) Data stratified for anti-CarP in anti-CCP2-negative stratum. (D) Radiological progression in anti-MAA positive and negative RA. (E) Data stratified for CCP2. Data presented as estimate (95% CI), p value. AGE, advanced glycation end-product; CarP, carbamylated protein; CCP2, citrullinated cyclic peptide 2; MAA, malondialdehyde acetaldehyde adduct.Presence of anti-MAA or anti-AGE is not associated with SDFR in RANext, we sought to investigate whether anti-AGE and anti-MAA were associated with SDFR over time (online supplemental figure 3). Anti-AGE was not associated with SDFR, HR 0.93 (95% CI 0.66 to 1.30; p=0.66) which did not differ after adjusting for CCP2 status (HR 1.14, 95% CI 0.81 to 1.61, p=0.46). Anti-MAA-positive patients were less likely to achieve SDFR, compared with anti-MAA-negative patients, HR 0.72 (95% CI 0.51 to 1.00, p=0.053). After adjusting for CCP2 status, there was no longer an association between anti-MAA and SDFR, HR 1.05 (95% CI 0.74 to 1.50, p=0.80).DiscussionIn this study, we demonstrated that anti-AGE and anti-MAA are present in patients with RA, and interestingly also in a substantial part of patients with otherwise seronegative RA. This is not specific for RA, as anti-AGE and anti-MAA antibodies were also present in other forms of early arthritis. Both anti-AGE and anti-MAA are associated with HLA-DRB1*03 in RA, and anti-AGE is also associated with HLA-DR1*03in non-RA arthritis patients. Anti-AGE and anti-MAA are associated with a distinct clinical phenotype: anti-AGE associates with radiological progression in RA whereas anti-MAA only showed a trend with radiological progression but associated with increased inflammatory parameters in both RA and non-RA arthritis.Associations with particular HLA class II alleles have been described to occur in many seropositive AI diseases.13 14 More specifically, HLA-DRB1*03, initially reported to be associated with anti-CCP2 negative RA, was later associated with the presence of anti-CarP, although not all HLA-DRB1*03-positive patients were anti-CarP-positive.10 12 In this study, we observed that HLA-DRB1*03 was associated with anti-AGE and anti-MAA in patients with anti-CCP2 negative RA which was independent of anti-CarP, thereby identifying another subgroup of anti-CCP2 negative RA that is associated with HLA-DRB1*03. In addition, anti-AGE associated with HLA-DRB1*03 in non-RA confirming the robustness of this finding. Together, these observations provide additional insight into the association of HLA-DBR1*03 with (rheumatoid) arthritis; although these alleles are not associated with the presence of ACPA, they do appear to predispose to the formation of other autoantibodies (anti-CarP, anti-AGE and anti-MAA) in a process in which HLA class II-associated T-cell-dependent immune responses are likely to be involved.Interestingly, in RA, anti-AGE associated with radiological progression independent of anti-CCP2 and anti-CarP suggesting an additive value of anti-AGE in determining disease evolution as it could define a new subgroup of patients with RA. Strikingly, anti-AGE was not associated with SDFR. In RA and non-RA, a subgroup of patients is characterised by more extensive inflammation and the presence of anti-MAA antibodies, while a subgroup of patients with CCP2-negative RA is characterised by radiological progression and presence of anti-AGE antibodies. Based on these results, distinct subgroups within RA and non-RA can be delineated based on their specific clinical phenotype.The presence of AGE-modified proteins and anti-AGE antibodies has been observed in diabetes and hypertension.6 23 Also, in synovial tissue and sera of patients with RA, AGE-modified proteins have been detected.24–26 In addition, MAA-modified proteins have been observed before in RA tissue7 and it is clear that both modifications can be induced by inflammation and oxidative stress in the inflamed joint.5 7 Our study now adds that in a subset of the patients with RA antibodies against these PTMs are present. Additionally, anti-AGE and anti-MAA have been found to be associated with ESR in previous studies in RA and SLE.22 PTMs and anti-PTMs such as anti-AGE and anti-MAA add to the understanding that the combined presence of the antigen and the antibody could trigger effector mechanisms and contribute to the overall process of arthritis and joint damage, in RA and also in non-RA. It would therefore be interesting to investigate whether next to carbamylated proteins27 also the modifications AGE and MAA are present in cartilage and synovium. Additionally, experimental pathogenicity studies on anti-AGE and anti-MAA specifically should be performed to elucidate on the contribution of these anti-PTM antibodies to pathogenesis.There are some limitations to our study. Data on anti-CarP antibody levels were missing for 149 patients with RA; therefore, analysis using stratification including anti-CarP could only be performed in a subgroup of all patients with RA. However, this group still consists of 499 patients with RA and therefore still appears a good representation of the RA population. Radiological progression was assessed in 635 patients with RA included before 2006. Thereafter, radiographs have not been scored since radiographic damage has become rare/nearly non-existent with current treatment strategies. This effectively enabled us to detect differences in the, earlier, informative part of the cohort. When stratifying radiological progression data, groups became small and therefore could suffer from insufficient power implicating that significance could not always be reached. It is therefore important to verify associations using different and/or bigger cohorts to be able to generalise findings to the whole RA population. Additionally, in order to verify the results obtained in this study, a replication cohort is needed. In such a study, IgA and IgM responses could be included to elaborate on the full anti-PTM antibody responses in patients with (rheumatoid) arthritis.28 29 One of the strengths of this study is that the EAC is a well-defined cohort containing RA and non-RA early arthritis patients with extensive information on the HLA haplotype and radiological progression for patients with RA.15 Second, antibody responses have been investigated on the PTM-modified proteins and their control proteins. All PTMs were created on the same antigen backbone and reactivity against FCS itself was subtracted from the results. This results in reliable measurements that capture truly PTM-specific signals and decreases the chance of false observations.30 Additionally, correlation analyses were performed (data not shown) and data were stratified for the other investigated anti-PTM and to verify that anti-AGE and anti-MAA are solely responsible for the observed result and not cross-reactive.In conclusion, anti-AGE and anti-MAA antibodies are both prevalent in patients with RA, and other inflammatory rheumatic conditions, and although not specific for RA they each correlate with specific parameters. Anti-MAA associates with HLA-DRB1*03 in CCP2-negative (RA) patients independent of anti-CarP and associates with inflammation. Anti-AGE associates with HLA-DRB1*03 in patients with CCP2-negative RA and is associated with a worse radiological progression especially in patients with anti-CCP2-negative and anti-CarP-negative RA. With this study, we have now characterised a seropositive subgroup within the heterogeneous group of patients with RA that have been thus far been considered seronegative.Data availability statementData are available upon reasonable request. Requests can be sent to l.a.trouw@lumc.nl.Ethics statementsPatient consent for publicationNot applicable.Ethics approvalThe Leiden Early Arthritis Clinic (EAC) cohort was approved by the Medical Ethics Committee Leiden The Hague Delft under reference number: B19.008. For the current study, measurement of anti-PTM antibodies in serum from the EAC cohort is approved under reference number B15.003. Participants gave informed consent to participate in the study before taking part.AcknowledgmentsWe thank Marloes Verstappen and Bianca M. Boxma-de Klerk for their assistance regarding the remission analysis on EAC cohort data.References↵Trouw LA, Mahler M. Closing the serological gap: promising novel biomarkers for the early diagnosis of rheumatoid arthritis. Autoimmun Rev 2012;12:318–22. doi:10.1016/j.autrev.2012.05.007OpenUrlCrossRefPubMed↵Schellekens GA, de Jong BA, van den Hoogen FH, et al. Citrulline is an essential constituent of antigenic determinants recognized by rheumatoid arthritis-specific autoantibodies. J Clin Invest 1998;101:273–81. doi:10.1172/JCI1316OpenUrlCrossRefPubMedWeb of Science↵Shi J, Knevel R, Suwannalai P, et al. Autoantibodies recognizing carbamylated proteins are present in sera of patients with rheumatoid arthritis and predict joint damage. Proc Natl Acad Sci U S A 2011;108:17372–7. doi:10.1073/pnas.1114465108OpenUrlAbstract/FREE Full Text↵Xu H, Wang Y, Lin S, et al. PTMD: a database of human disease-associated post-translational modifications. Genom Proteom Bioinform 2018;16:244–51. doi:10.1016/j.gpb.2018.06.004OpenUrl↵Schmidt AM, Yan SD, Yan SF, et al. The multiligand receptor RAGE as a progression factor amplifying immune and inflammatory responses. J Clin Invest 2001;108:949–55. doi:10.1172/JCI14002OpenUrlCrossRefPubMedWeb of Science↵Nikolov A, Blazhev A, Tzekova M, et al. Serum levels of antibodies to advanced glycation end products in patients with type 2 diabetes mellitus and hypertension. Folia Med (Plovdiv) 2020;62:295–301. doi:10.3897/folmed.62.e47788OpenUrl↵Thiele GM, Duryee MJ, Anderson DR, et al. Malondialdehyde-acetaldehyde adducts and anti-malondialdehyde-acetaldehyde antibodies in rheumatoid arthritis. Arthritis Rheumatol 2015;67:645–55. doi:10.1002/art.38969OpenUrl↵Buongiorno AM, Morelli S, Sagratella E, et al. Immunogenicity of advanced glycation end products in diabetic patients and in nephropathic non-diabetic patients on hemodialysis or after renal transplantation. J Endocrinol Invest 2008;31:558–62. doi:10.1007/BF03346408OpenUrlPubMed↵Thiele GM, Tuma DJ, Willis MS, et al. Soluble proteins modified with acetaldehyde and malondialdehyde are Immunogenic in the absence of adjuvant. Alcohol Clin Exp Res 1998;22:1731–9.OpenUrlCrossRefPubMed↵Verpoort KN, van Gaalen FA, van der Helm-van Mil AHM, et al. Association of HLA-DR3 with anti-cyclic citrullinated peptide antibody-negative rheumatoid arthritis. Arthritis Rheum 2005;52:3058–62. doi:10.1002/art.21302OpenUrlCrossRefPubMedWeb of Science↵Regueiro C, Rodriguez-Rodriguez L, Triguero-Martinez A, et al. Specific association of HLA-Drb1*03 with anti-carbamylated protein antibodies in patients with rheumatoid arthritis. Arthritis Rheumatol 2019;71:331–9. doi:10.1002/art.40738OpenUrl↵Jiang X, Trouw LA, van Wesemael TJ, et al. Anti-carp antibodies in two large cohorts of patients with rheumatoid arthritis and their relationship to genetic risk factors, cigarette smoking and other autoantibodies. Ann Rheum Dis 2014;73:1761–8. doi:10.1136/annrheumdis-2013-205109OpenUrlAbstract/FREE Full Text↵Kirino Y, Remmers EF. Genetic architectures of seropositive and seronegative rheumatic diseases. Nat Rev Rheumatol 2015;11:401–14. doi:10.1038/nrrheum.2015.41OpenUrlCrossRefPubMed↵Cruz-Tapias P, Pérez-Fernández OM, Rojas-Villarraga A, et al. Shared HLA class II in six autoimmune diseases in Latin America: a meta-analysis. Autoimmune Dis 2012;2012:569728. doi:10.1155/2012/569728↵de Rooy DPC, van der Linden MPM, Knevel R, et al. Predicting arthritis outcomes--what can be learned from the Leiden early arthritis clinic Rheumatology (Oxford) 2011;50:93–100. doi:10.1093/rheumatology/keq230OpenUrlCrossRefPubMedWeb of Science↵Arnett FC, Edworthy SM, Bloch DA, et al. The American rheumatism association 1987 revised criteria for the classification of rheumatoid arthritis. Arthritis Rheum 1988;31:315–24. doi:10.1002/art.1780310302OpenUrlCrossRefPubMedWeb of Science↵van Aken J, van Bilsen JH, Allaart CF, et al. The leiden early arthritis clinic. Clin Exp Rheumatol 2003;21:S100–5.OpenUrlPubMedWeb of Science↵Huizinga TWJ, Amos CI, van der Helm-van Mil AHM, et al. Refining the complex rheumatoid arthritis phenotype based on specificity of the HLA-DRB1 shared EPITOPE for antibodies to citrullinated proteins. Arthritis Rheum 2005;52:3433–8. doi:10.1002/art.21385OpenUrlCrossRefPubMedWeb of Science↵Knevel R, Krabben A, Brouwer E, et al. Genetic variants in Il15 associate with progression of joint destruction in rheumatoid arthritis: a multicohort study. Ann Rheum Dis 2012;71:1651–7. doi:10.1136/annrheumdis-2011-200724OpenUrlAbstract/FREE Full Text↵van der Heijde D. How to read radiographs according to the sharp/Van der heijde method. J Rheumatol 2000;27:261–3.OpenUrlPubMedWeb of Science↵Verstappen M, van Steenbergen HW, de Jong PHP, et al. Unraveling heterogeneity within ACPA-negative rheumatoid arthritis: the subgroup of patients with a strong clinical and serological response to initiation of DMARD treatment favor disease resolution. Arthritis Res Ther 2022;24:4. doi:10.1186/s13075-021-02671-z↵Monahan RC, van den Beukel MD, Borggreven NV, et al. Autoantibodies against specific post-translationally modified proteins are present in patients with lupus and associate with major neuropsychiatric manifestations. RMD Open 2022;8:e002079. doi:10.1136/rmdopen-2021-002079↵Aso Y, Inukai T, Tayama K, et al. Serum concentrations of advanced glycation endproducts are associated with the development of atherosclerosis as well as diabetic microangiopathy in patients with type 2 diabetes. Acta Diabetol 2000;37:87–92. doi:10.1007/s005920070025OpenUrlCrossRefPubMedWeb of Science↵Drinda S, Franke S, Canet CC, et al. Identification of the advanced glycation end products N(Epsilon)-carboxymethyllysine in the synovial tissue of patients with rheumatoid arthritis. Ann Rheum Dis 2002;61:488–92. doi:10.1136/ard.61.6.488OpenUrlAbstract/FREE Full Text↵de Groot L, Hinkema H, Westra J, et al. Advanced glycation endproducts are increased in rheumatoid arthritis patients with controlled disease. Arthritis Res Ther 2011;13:R205. doi:10.1186/ar3538↵Ligier S, Fortin PR, Newkirk MM. A new antibody in rheumatoid arthritis targeting glycated IgG: Igm anti-IgG-AGE. Br J Rheumatol 1998;37:1307–14. doi:10.1093/rheumatology/37.12.1307OpenUrlCrossRefPubMed↵Verheul MK, Janssen GMC, de Ru A, et al. Mass-spectrometric identification of carbamylated proteins present in the joints of rheumatoid arthritis patients and controls. Clin Exp Rheumatol 2021;39:570–7. doi:10.55563/clinexprheumatol/0ms5pkOpenUrlPubMed↵van Delft MAM, van der Woude D, Toes REM, et al. Secretory form of rheumatoid arthritis-associated autoantibodies in serum are mainly of the Igm Isotype, suggesting a continuous reactivation of autoantibody responses at mucosal surfaces. Ann Rheum Dis 2019;78:146–8. doi:10.1136/annrheumdis-2018-213724OpenUrlFREE Full Text↵Mikuls TR, Duryee MJ, England BR, et al. Malondialdehyde-acetaldehyde antibody concentrations in rheumatoid arthritis and other rheumatic conditions. Int Immunopharmacol 2018;56:113–8. doi:10.1016/j.intimp.2018.01.022OpenUrl↵Åhlin E, Elshafie AI, Nur MAM, et al. Anti-citrullinated peptide antibodies in sudanese patients with leishmania donovani infection exhibit reactivity not dependent on citrullination. Scand J Immunol 2015;81:201–8. doi:10.1111/sji.12265OpenUrl
|
|
Scooped by
Gilbert C FAURE
April 2, 2023 5:26 AM
|
During the osteoarthritis (OA) process, activation of immune systems, whether innate or adaptive, is strongly associated with low-grade systemic inflammation. This process is initiated and driven in the synovial membrane, especially by synovium cells, themselves previously activated by damage-associated molecular patterns (DAMPs) released during cartilage degradation. These fragments exert their biological activities through pattern recognition receptors (PRRs) that, as a consequence, induce the activation of signaling pathways and beyond the release of inflammatory mediators, the latter contributing to the vicious cycle between cartilage and synovial membrane. The primary endpoint of this review is to provide the reader with an overview of these many molecules categorized as DAMPs and the contribution of the latter to the pathophysiology of OA. We will also discuss the different strategies to control their effects. We are convinced that a better understanding of DAMPs, their receptors, and associated pathological mechanisms represents a decisive issue for degenerative joint diseases such as OA.
|
|
Scooped by
Gilbert C FAURE
December 2, 2022 11:19 AM
|
Glycosylation has a profound influence on protein activity and cell biology through a variety of mechanisms, such as protein stability, receptor interactions and signal transduction. In many rheumatic diseases, a shift in protein glycosylation occurs, and is associated with inflammatory processes and disease progression. For example, the Fc-glycan composition on (auto)antibodies is associated with disease activity, and the presence of additional glycans in the antigen-binding domains of some autoreactive B cell receptors can affect B cell activation. In addition, changes in synovial fibroblast cell-surface glycosylation can alter the synovial microenvironment and are associated with an altered inflammatory state and disease activity in rheumatoid arthritis. The development of our understanding of the role of glycosylation of plasma proteins (particularly (auto)antibodies), cells and tissues in rheumatic pathological conditions suggests that glycosylation-based interventions could be used in the treatment of these diseases. Glycosylation is a common modification that can affect protein stability and interactions. In this Review, the authors discuss the role of glycosylation in rheumatic diseases, as well as the therapeutic potential of glycosylation-based interventions.
|
|
Scooped by
Gilbert C FAURE
February 21, 2022 4:53 AM
|
Rheumatoid arthritis (RA) is a multifactorial autoimmune disease characterized by chronic inflammation and destruction of multiple small joints which may lead to systemic complications. Altered immunity via pathogenic autoantibodies pre-date clinical symptom development by several years. Incompletely understood range of mechanisms trigger joint-homing, leading to clinically evident articular disease. Advances in therapeutic approaches and understanding pathogenesis have improved prognosis and likely remission. However, partial/non-response to conventional and biologic therapies witnessed in a subset of patients highlights the need for new therapeutics. It is now evident that joint disease chronicity stems from recalcitrant inflammatory synovial environment, majorly maintained by epigenetically and metabolically reprogrammed synoviocytes. Therefore, interference with effector functions of activated cell types seems a rational strategy to reinstate synovial homeostasis and complement existing anti-inflammatory interventions to mitigate chronic RA. Presenting this newer aspect of fibroblast-like synoviocytes and myeloid cells underlying the altered synovial biology in RA and its potential for identification of new druggable targets is attempted in this review. Major leads from i) molecular insights of pathogenic cell types from hypothesis free OMICS approaches; ii) hierarchy of their dysregulated signaling pathways; and iii) knowledge of druggability of molecular nodes i
|
|
Scooped by
Gilbert C FAURE
July 5, 2021 4:58 AM
|
IL-17A and IL-6 are elevated in synovial fluid of SLE arthritis patients. The Th17 pathway have been implicated in several aspects of SLE disease pathogenesis and our data points to Th17 involvemen
|
|
Scooped by
Gilbert C FAURE
February 2, 2021 3:58 AM
|
Research ArticleAutoimmunity Free access | 10.1172/JCI93450 Two rheumatoid arthritis–specific autoantigens correlate microbial immunity with autoimmune responses in joints Annalisa Pianta,1 Sheila L. Arvikar,1 Klemen Strle,1 Elise E. Drouin,1 Qi Wang,2 Catherine E. Costello,2 and Allen C. Steere1 Published June 26, 2017 - More info View PDF Abstract In rheumatoid arthritis (RA), immunological triggers at mucosal sites, such as the gut microbiota, may promote autoimmunity that affects joints. Here, we used discovery-based proteomics to detect HLA-DR–presented peptides in synovia or peripheral blood mononuclear cells and identified 2 autoantigens, N-acetylglucosamine-6-sulfatase (GNS) and filamin A (FLNA), as targets of T and B cell responses in 52% and 56% of RA patients, respectively. Both GNS and FLNA were highly expressed in synovia. GNS appeared to be citrullinated, and GNS antibody values correlated with anti–citrullinated protein antibody (ACPA) levels. FLNA did not show the same results. The HLA-DR–presented GNS peptide has marked sequence homology with epitopes from sulfatase proteins of the Prevotella sp. and Parabacteroides sp., whereas the HLA-DR–presented FLNA peptide has homology with epitopes from proteins of the Prevotella sp. and Butyricimonas sp., another gut commensal. Patients with T cell reactivity with each self-peptide also had responses to the corresponding microbial peptides, and the levels were directly correlated. Furthermore, HLA-DR molecules encoded by shared-epitope (SE) alleles were predicted to bind these self- and microbial peptides strongly, and these responses were more common in RA patients with SE alleles. Thus, sequence homology between T cell epitopes of 2 self-proteins and a related order of gut microbes may provide a link between mucosal and joint immunity in patients with RA. Introduction Rheumatoid arthritis (RA) is an HLA class II–associated autoimmune disease, in which arthritogenic T cells drive the progressive inflammation and destruction of synovial joints (1). Both genetic and environmental factors are thought to contribute to disease development and progression. The greatest genetic risk factor is HLA-DRB1–susceptibility alleles that share a 5–amino acid sequence in the B1 chain, termed the RA shared epitope (SE) (2). HLA-DRB1 SE alleles largely influence the development of seropositive RA, which is defined by positive tests for rheumatoid factor (RF) and/or anti–citrullinated protein antibodies (ACPAs) (3), the latter being the only known specific autoantibodies for this disease (4–6). RF and/or ACPAs may develop years before the onset of clinical arthritis (7–9), suggesting that autoimmunity may be triggered at sites other than joints in patients with RA. Causative environmental factors are less well characterized. However, T cell epitope mimicry between microbial pathogens and self-proteins has been implicated as a possible factor in the induction or exacerbation of autoimmune disease (10–12). In addition, alteration of the oral or gut microbiota may affect mucosal immunity, inducing aberrant immune responses that affect joints in patients with RA (13, 14). Using high-throughput sequencing, Scher et al. showed that Prevotella species (spp.), including P. copri, in the gut microbiota were expanded in stool samples from patients with new-onset RA (NORA), suggesting that these organisms might have this role in RA pathogenesis (13). Moreover, a recent study in mice showed that gut dysbiosis contributes to arthritis development via the activation of autoreactive T cells in the intestine (15). Proposed mechanisms to link infection and autoimmunity include molecular mimicry between T cell microbial and host epitopes (16); infection-induced alteration and release of sequestered self-antigens (11); or nonspecific, infection-induced inflammatory responses that function as adjuvants in the induction of pathogenic autoimmunity (17, 18). The identification of disease-relevant infectious or self-antigens has been challenging in any autoimmune disease, but current discovery-based methods offer innovative approaches to this problem. We have developed an approach for antigen detection in chronic inflammatory arthritides, in which HLA-DR–presented peptides (T cell epitopes) are identified directly from patients’ inflamed synovial tissue, synovial fluid mononuclear cells (SFMCs), or peripheral blood mononuclear cells (PBMCs) by liquid chromatography–tandem mass spectrometry (LC-MS/MS) and tested for immunogenicity using patients’ samples (19–24). With this approach, we recently identified an HLA-DR–presented peptide from a 27-kDa protein of P. copri (Pc-p27), which stimulated T and B cell responses in approximately 40% of patients with RA, but not in patients with other rheumatic diseases or in healthy controls (HCs) (25). Using the same methodology, we report here the identification of 2 previously unidentified autoantigens, N-acetylglucosamine-6-sulfatase (GNS) and filamin A (FLNA) that are targets of T and B cell responses and appear to be specific for RA. Both autoantigens are highly expressed in inflamed synovial tissue; they share homologous T cell epitopes with Prevotella and several other gut microbes, and they are targets of specific T and B cell responses in patients with RA, providing evidence that may link immune responses to microbial peptides from gut commensals and autoimmune responses affecting joints. Results Identification of naturally presented HLA-DR peptides (T cell epitopes). In a recent study (20), we identified HLA-DR–presented peptides in synovial tissue, SFMCs, and PBMCs from 5 patients with RA using LC-MS/MS, and the immunogenicity of the peptides was determined using patients’ samples in enzyme-linked immunospot (ELISpot) assays. The findings from 1 patient (referred to here as RA1) were of particular interest. She had classic, seropositive RA, with severe symmetrical polyarthritis, a positive test for ACPAs, and 2 copies of SE alleles (HLA-DRB1*0401 and *0101). In this patient, an immunogenic HLA-DR–presented peptide derived from a P. copri protein (Pc-p27) was identified from the patient’s PBMCs (25). We then showed that approximately 40% of patients with RA have T and/or B cell responses to Pc-p27 or to the whole P. copri organism (25). In patient RA1, 2 immunogenic HLA-DR–presented human self-peptides derived from GNS and FLNA were also identified from her synovial tissue, and the same FLNA peptide was also found in her PBMCs (20). The HLA-DR–presented peptide derived from GNS was predicted to be promiscuous, binding to 24 of the 25 HLA-DR molecules modeled in the program TEPITOPE (26), and the FLNA-derived peptide was predicted to bind 9 of the 25 HLA-DR molecules. With both peptides, this included binding by HLA-DR molecules encoded by SE alleles *0101, *0401, *0404, and *0405. Neither the GNS protein, nor the FLNA protein, nor the P. copri protein had previously been noted to be antigens in RA. T cell reactivity to GNS and FLNA peptides. To determine the immunogenicity of HLA-DR–presented peptides and their source proteins more broadly, we have developed a cohort of NORA patients seen prior to commencing therapy with disease-modifying antirheumatic drugs (DMARDs), which is a time when immune responses would be expected to be most robust. For comparison, we tested samples from patients with Lyme arthritis (LA) and from HC subjects. HLA-DR typing showed that 60% of the 40 RA patients had SE alleles, and 50% of the 10 LA patients and 42% of the 15 healthy subjects also had SE alleles. Nevertheless, since the patients and HCs had a range of different HLA-DR alleles, and since cell numbers are limited in human patients, our initial approach for determining T cell responses in multiple individuals consisted of pooling the original peptide with 3 additional peptides from the same protein that are predicted by the program TEPITOPE to be promiscuous HLA-DR binders (26). In addition, because of a limited number of cells, we did not include the testing of irrelevant control peptides in these experiments. However, we have previously shown that patients with RA do not have reactivity to peptides derived from endothelial cell growth factor (ECGF) or MMP-10 peptides (21, 23). These autoantigens in LA are irrelevant in RA. When PBMCs from 40 patients with NORA were stimulated with the GNS peptides, we found that 14 of the 40 patients (35%) secreted levels of IFN-γ that were greater than 3 SD above the mean value for HCs (P = 0.006), as determined by an IFN-γ/IL-17 double-color ELISpot assay (Figure 1A). In comparison, PBMCs from patients with LA lacked reactivity to these peptides (P = 0.005). When FLNA peptides were used to stimulate PBMCs from the same set of patients and control subjects, 17 of the 40 patients with NORA (42%) had IFN-γ levels that were greater than 3 SD above the mean value for HCs (P = 0.001) and for patients with LA (P = 0.0005) (Figure 1B). In patients with RA, the predominant response to stimulation with both peptide sets was a Th1-type response with IFN-γ secretion, whereas PBMCs from only 3 RA patients secreted IL-17 (data not shown). Altogether, 21 of the 40 patients (52%) had T cell reactivity to GNS and/or FLNA peptides, and 10 (25%) had reactivity to both. Figure 1 T cell reactivity to GNS and FLNA peptides in RA patients and comparison group subjects. In initial experiments, (A) PBMCs from patients with RA or LA or from HC subjects were stimulated with a pool of 4 peptides, including the single GNS HLA-DR–presented peptide isolated from the synovial tissue of patient RA1, and 3 predicted promiscuous HLA-DR–binding peptides from GNS (1 μM each). (B) PBMCs from patients and HCs were incubated with a pool of 4 peptides, including the single FLNA HLA-DR–presented peptide identified from the synovial tissue and PBMCs from patient RA1, and 3 predicted promiscuous HLA-DR–binding peptides from FLNA (1 μM each). In each assay, a positive control (phytohemagglutinin) and a negative control (no peptide) were included. The amount of IFN-γ secretion, as determined by an ELISpot assay, is shown. A positive response was defined as greater than 3 SD above the mean value for HCs (area above the shaded region). The values for patient RA1 are indicated with a star. Horizontal lines represent the mean values for each group. P values were determined by unpaired, 2-tailed t test with Welch’s correction. SFU, spot-forming units per million PBMCs. B cell reactivity to GNS and FLNA proteins. Since the role of CD4+ T cells would likely be to help B cells produce autoantibodies against GNS or FLNA, we examined IgG levels for these proteins in serum samples from patients with RA and control group subjects. Since sera (but not PBMCs) were also available from patients with chronic RA (CRA), testing was done in 48 NORA patients and 53 CRA patients. Because the results were similar in both groups, they are presented together here. Of the 101 patients with RA, 32 (32%) had IgG antibody responses against GNS that were greater than 3 SD above those in HCs (P < 0.0001) (Figure 2A). In contrast, none of the 106 patients with other diseases, including those with LA, spondyloarthropathy (SpA), or connective tissue diseases (CTD), and none of the 50 HC subjects had positive IgG antibody responses against the protein (in each instance, P < 0.0001). Similarly, 27 of the 101 (27%) patients with RA had levels of IgG antibodies against FLNA that were greater than 3 SD above those in HCs (P < 0.0001), whereas only 2 patients with CTD had borderline positive IgG antibody responses against FLNA, and none of the other control subjects had positive responses (Figure 2B). Altogether, 48 (48%) of the 101 RA patients had IgG autoantibodies against GNS and/or FLNA, and 10 (10%) had IgG reactivity against both proteins. Figure 2 IgG and IgA responses to GNS and FLNA in RA patients and comparison group subjects. Serum samples from 259 patients with RA, patients with other forms of chronic inflammatory arthritis, and HCs were tested by ELISA for autoantibodies. (A and C) Plates were coated with the GNS protein and incubated with serum from patients or HCs. All serum samples were tested in duplicate for anti-GNS IgG (A) or IgA (C) antibody responses. (B and D) Plates were coated with the FLNA protein and incubated with serum from patients or control subjects. All serum samples were tested in duplicate for anti-FLNA IgG (B) or IgA (D) antibody responses. For all analyses, positivity was defined as greater than 3 SD above the mean value for HCs (area above the shaded region). Symbols represent values in individual patients, and horizontal lines show the mean values. Values for patient RA1 are indicated with a star. Only significant P values, determined by unpaired, 2-tailed t test with Welch’s correction, are shown. Because autoimmune processes in RA may be triggered at mucosal sites, we also tested the levels of IgA antibodies against GNS and FLNA in serum samples from patients and control subjects. Of the 101 patients with RA, 16 (16%) had elevated IgA antibody responses against GNS that were greater than 3 SD above those in HCs (P < 0.0001) (Figure 2C). In contrast, of the 106 patients with other rheumatic diseases and the 50 HC subjects, only 1 patient with SpA had borderline positive IgA antibodies. Similarly, 15 (15%) of the 101 RA patients had FLNA IgA responses that were greater than 3 SD above those in HCs (P = 0.0002), whereas only 1 HC subject and 2 patients with LA had low-level positive responses (Figure 2D). Altogether, 21 (21%) of the 101 RA patients had IgA antibody responses against GNS and/or FLNA, and 10 (10%) had IgA antibody responses against both proteins. When IgG and IgA responses were considered together, 48 of the 101 patients with RA (48%) had IgG antibody responses against GNS and/or FLNA; 21 (21%) had IgA responses against 1 or both of the proteins; and 56 (55%) had IgG and/or IgA responses against the proteins. Of the 14 patients who had T cell responses to GNS peptides, 11 (79%) had IgG and/or IgA antibody responses against the GNS protein. Among the 17 patients who had T cell reactivity to the FLNA peptides, 6 (35%) had IgG and/or IgA antibody responses against the FLNA protein. Thus, T and B cell concordance was greater with GNS than with FLNA. Correlation of antibody responses against P. copri, GNS, and FLNA. Using these same serum samples (25), we have previously tested IgG and IgA antibody responses against 2 RA-associated bacteria, P. copri, a gut microbe, and Porphyromonas gingivalis, a periodontal pathogen (27). Antibody responses against P. copri were found in 32% of RA patients, but were absent in patients with other CTDs, SpA, or LA, as well as in healthy subjects (25). Therefore, using these data, we correlated IgG and IgA antibody responses against these 2 organisms with the GNS and FLNA antibody responses determined here. In patients with RA, the levels of anti-GNS IgG and IgA antibodies strongly correlated with P. copri antibody responses (P = 0.002 and P < 0.0001, respectively), and we found a similar correlation between anti-FLNA IgG and IgA antibody responses and P. copri antibodies (P < 0.0001 and P < 0.0001) (Figure 3A). In contrast, anti-GNS and anti-FLNA IgG or IgA levels did not correlate with P. gingivalis antibody responses (Figure 3B). Additionally, we observed no correlations among these parameters in healthy subjects. Thus, in RA patients, the higher the IgG or IgA antibody responses against P. copri, the greater the autoantibody responses against these autoantigens. Figure 3 Autoantibody correlations with P. copri and P. gingivalis antibodies. Correlations between anti-GNS or anti-FLNA antibodies (IgG or IgA) and antibodies against P. copri (A) or P. gingivalis (B) in 101 RA patients. The r and P values for the corresponding statistical comparisons were determined by Spearman’s correlation test. Testing of citrullinated GNS and FLNA proteins. Because citrullinated autoantigens are thought to play a central role in RA, particularly in patients with SE alleles, we investigated whether autoantibody responses against GNS or FLNA were greater when these proteins were citrullinated. For this purpose, the native proteins were citrullinated in vitro using recombinant human (rh) peptidylarginine deiminase 4 (PAD4) enzyme. Using samples from 46 RA patients in whom a sufficient amount of serum still remained, IgG antibody responses were higher against citrullinated GNS compared with responses against the uncitrullinated protein (P = 0.005), whereas the responses were negative against both forms of the protein in 15 HC subjects (Figure 4A). Moreover, the magnitude of anti–citrullinated GNS antibody responses correlated with ACPA levels in these patients (P = 0.03) (Figure 4B). In contrast, IgG antibody responses against citrullinated and uncitrullinated FLNA were not significantly different in the 46 patients (Figure 4C), and the levels of anti–citrullinated FLNA antibodies did not correlate with ACPA levels (Figure 4D). These results suggest that the GNS protein, but not the FLNA protein, may be citrullinated in vivo in patients with RA. Figure 4 Autoantibody responses to citrullinated GNS and FLNA, and correlations with ACPAs. Serum samples from 46 patients with RA and 15 healthy individuals were tested for IgG antibody responses against citrullinated versus uncitrullinated GNS or FLNA. Plates were coated with GNS (A) or FLNA (C), with or without citrullination, incubated with serum from patients or HC subjects, and tested in duplicate. Symbols represent values for individual patients, and horizontal lines indicate the mean values. In A and C, only significant P values, calculated by an unpaired, 2-tailed t test with Welch’s correction, are shown. (B) Correlation between IgG antibody responses against citrullinated GNS or citrullinated FLNA (D) and ACPA levels in the 46 patients with RA. The r and P values shown in B and D were determined by Spearman’s correlations. citGNS, citrullinated GNS; citFLNA, citrullinated FLNA. Utility of GNS and FLNA autoantibody evaluation in the diagnosis of RA. In our patient cohort, 70 (69%) of the 101 NORA and CRA patients were seropositive for ACPAs and/or RF, which are standard, commercially available autoantibody determinations for support of the diagnosis of RA. Among the 31 patients who did not have a positive test for ACPAs and/or RF, 13 had a positive test for IgG and/or IgA GNS autoantibodies and 9 had a positive test for IgG and/or IgA FLNA autoantibodies. Taken together, 17 of the 31 seronegative patients (55%) had such autoantibodies, 15 of whom could be identified with the IgG test alone. Overall, when autoantibody responses against GNS and FLNA were combined with standard autoantibody determinations, 87 (86%) of the 101 patients with RA had a positive test result for support of the diagnosis, and only 14 (14%) lacked a specific marker for RA. GNS and FLNA protein levels in serum and joints. For a self-protein to become the target of autoimmune responses in RA patients’ inflamed joints, one would predict that the protein would be present at high concentrations there. For this purpose, we measured GNS and FLNA protein concentrations in serum samples from the 101 patients with RA and in synovial fluid (SF) from 17 patients for whom such samples were available. The levels of GNS were higher in the serum of RA patients than were GNS levels in the control groups (P ≤ 0.002) (Figure 5A), and in RA patients, the levels of this protein tended to be higher in SF than in serum. Similarly, FLNA protein levels were significantly higher in the serum of RA patients than in HCs (P < 0.0001), but in RA patients, FLNA protein levels in SF and serum were similar (Figure 5B). Figure 5 GNS and FLNA protein levels in RA patients and comparison group subjects. GNS and FLNA protein concentrations were measured in serum and SF samples from patients with RA, serum samples from patients with CTD, SpA, or LA, and serum samples from HCs. (A) GNS protein concentrations and (B) FLNA protein concentrations are shown, as measured by ELISA assay. For both analyses, positivity was defined as greater than 3 SD above the mean value for HC subjects (area above the shaded region). Symbols represent values for individual patients, and horizontal lines indicate the mean values. The values for patient RA1 are indicated with a star. Only significant P values, determined by unpaired, 2-tailed t test with Welch’s correction, are shown. SLE, systemic lupus erythematosus. To gain further insight into the protein abundance and distribution, synovial tissues from 10 patients, 4 with RA and 3 each with LA or osteoarthritis (OA), were stained for expression of GNS and FLNA, using immunohistologic methods. GNS showed a fine, reticular pattern in and around endothelial cells in 3 of the 4 patients with RA, but not in those with LA or OA (Figure 6). We observed that FLNA was intensely expressed in the tunica muscularis around blood vessels and in large or elongated cells, presumably synoviocytes, and it was also faintly expressed in the extracellular matrix. We detected FLNA expression in all RA patients, lesser staining in 2 of the LA patients, but no staining in the OA patients (Figure 6). Thus, in RA, these 2 proteins were present in inflamed synovial tissue, particularly around blood vessels, where they could become targets of autoimmune responses. Figure 6 Immunohistochemical staining of synovial tissue for GNS and FLNA. Representative synovial tissue images from 1 patient with RA, 1 with LA, and 1 with OA are shown for expression of GNS or FLNA protein. Brown color indicates specific staining of GNS or FLNA self-proteins, and purple indicates hematoxylin staining. Images were taken at ×20 magnification, and ×40 magnification was used for the RA patient to highlight the staining around blood vessels. Sequence homology between T cell epitopes of microbial and self-peptides. In an effort to determine whether T cell epitope mimicry may play a role in linking Prevotella reactivity with GNS and FLNA autoimmune responses, the sequence of each of the 2 self-peptides isolated from patient RA1 was used first to search for regions of similarity with any microbial protein using the microbial protein database in BLASTP (Basic Local Alignment Search Tool, protein) (https://blast.ncbi.nlm.nih.gov/Blast.cgi). For both self-peptides, Prevotella spp. peptides were among the top sequences producing significant alignment, specifically in areas predicted to be in the HLA-DR–binding groove. Therefore, we refined the search for sequence similarity by screening only microbial sequences from Prevotellaceae (NCBI Entrez Genome taxid:171552). To evaluate sequence homology, self- and microbial peptides were aligned using the program Clustal Omega (28). The peptide derived from GNS had 67% sequence homology with a peptide from the Prevotella arylsulfatase protein (WP_062433009) (Figure 7A), which was predicted by CELLO software to have a periplasmic location (29). Importantly, the major area of homology for this microbial peptide was restricted to amino acids predicted to be in the HLA-DR–binding groove (Figure 7A). For the Prevotella peptide, 5 of the 9 amino acids were identical to one of the predicted binding registers (P1 = the first F) in the GNS peptide. Moreover, the peptides shared amino acid identity at the P1, P4, and P6 sites, which are critical for peptide binding, as well as in the flanking regions at each end of the peptide, which also influence peptide binding (Figure 7A). The FLNA peptide had 80% identity with a peptide derived from an uncharacterized Prevotella protein (WP_028897633) (Figure 7A), which was predicted to have an extracellular location (a secreted protein). Moreover, the major area of homology was again found in the HLA-DR–binding groove, where 7 of the 9 amino acids were identical in the Prevotella and FLNA peptides, and the remaining 2 amino acids had conserved properties (Figure 7A). Figure 7 Sequence homology between self- and microbial peptides. (A) Sequence alignment of the self- and corresponding microbial peptides is shown (Clustal Omega), and the predicted binding frames of the self-peptides are given for the HLA-DRB1*0101 and *0401 molecules. Red residues indicate the P1 position (TEPITOPE predicted 3 binding registers for GNS [both HLA-DRB1*0101 and *0401], 2 for FLNA [HLA-DRB1*0401], and 1 for FLNA [HLA-DR*0101]), and blue residues indicate positions P2 through P9. The line through the amino acid residues indicates that the peptide-binding register contains an amino acid with an R-group that may not interact favorably with one of the MHC-binding pockets. (B) PBMCs from 24 RA patients and 10 HCs were incubated with 1 of the 2 self-peptides (GNS or FLNA) or each of the 2 corresponding microbial peptides (1 μM each). In each assay, a positive control (phytohemagglutinin) and a negative control (no peptide) were included. The amount of IFN-γ secretion is shown, as determined by ELISpot assay. A positive response was defined as greater than 3 SD above the mean value for the HCs (area above the shaded region). Horizontal lines represent the mean values for each group. *P < 0.05 and **P < 0.005, by unpaired, 2-tailed t test with Welch’s correction. (C) Correlations between the T cell reactivity to the GNS peptide and the 2 corresponding microbial peptides, 1 derived from the Prevotella arylsulfatase protein and the other from the Parabacteroides GNS protein. (D) Correlations between the T cell reactivity to the FLNA peptide and the 2 corresponding microbial peptides derived from 2 hypothetical proteins, 1 from the Prevotella sp. and the other from the Butyricimonas sp. P and r values shown in C and D were calculated using Spearman’s correlation test. For comparison, we analyzed the GNS and FLNA sequences for homology with P. gingivalis, a periodontal pathogen of interest in RA, using Porphyromonadaceae (taxid:171551) as the reference database in the BLASTP search. However, we found no homology between P. gingivalis and GNS or FLNA sequences. P. gingivalis also stimulates antibody responses in the subgroup of RA patients who have periodontal disease (27, 30), but there is little overlap between RA patients with P. gingivalis antibodies and those with P. copri antibodies (25). Instead, among the Porphyromonadaceae, the GNS epitope had partial sequence similarity with a peptide from the periplasmic protein N-acetylgalactosamine-6-sulfatase of the Parabacteroides sp. (WP_046148720) (Figure 7A). Thus, as with the homology between the GNS peptide and the peptide from the Prevotella arylsulfatase protein, the Parabacteroides protein was also a sulfatase. These enzymes are key in the adaptation and persistence of human commensal bacteria in the gut (31, 32). Moreover, the Parabacteroides peptide had 4 amino acids identical to the GNS peptide and 1 amino acid with conserved properties. These included amino acids with shared identity in the P1 through P4 and P6 sites. A similar evaluation of the FLNA peptide showed sequence homology with a predicted cytoplasmic uncharacterized protein of the Butyricimonas sp. (WP_065219401.1), another gut commensal. The Butyricimonas peptide shared identity with 6 of 9 amino acids in one of the predicted HLA-DR registers (P1 = F) of the FLNA peptide, and two of the three remaining amino acids had conserved properties (Figure 7A). Prevotella, Parabacteroides, and Butyricimonas are each members of the Bacteroidetes phylum, one of the two major phyla of gut commensal organisms. T cell responses to homologous microbial and self-peptides. To address whether patients had reactivity to these self-epitopes and the corresponding microbial epitopes, we performed ELISpot assays with each of these peptides using PBMCs from the 24 patients with NORA in whom sufficient numbers of cells remained and from 10 HCs. When cells were stimulated with the GNS peptide or each of the 2 corresponding microbial peptides (1 derived from Prevotella and the other from Parabacteroides), we found Th1 cell reactivity to all 3 peptides. Of the 24 RA patients, 8 (33%) had T cell reactivity to the GNS peptide, 9 (38%) showed responses to the Prevotella peptide, and 6 (25%) had reactivity to the Parabacteroides peptide, all of which were responses that were 3 SD or more above the mean values for HCs (Figure 7B). Of the 8 patients who had reactivity to the GNS peptide, 7 also had responses to the microbial peptides. When PBMCs were incubated with the FLNA peptide, 9 of the 24 patients with RA (38%) had T cell responses, 10 (42%) showed reactivity to the corresponding Prevotella peptide, and 7 (29%) had responses to the Butyricimonas peptide (Figure 7B). Furthermore, all 9 patients with reactivity to the FLNA peptide also had responses to the microbial peptides. Thus, except for 1 patient, the same patients who had reactivity to the GNS and/or FLNA peptides also had responses to the corresponding microbial peptides. Additionally, among the microbial peptides, we observed a trend toward a higher percentage of patients who had reactivity to the Prevotella peptides than to the other gut commensals. Moreover, when the magnitude of the T cell responses to each self-peptide was correlated with that of the corresponding microbial peptides, the responses to the GNS or FLNA peptide strongly correlated with reactivity to each of the 2 microbial peptides (in each instance, P < 0.0001) (Figure 7, C and D). Therefore, the stronger the response to the microbial peptides, the greater the response to the self-peptide. In contrast, PBMCs from 10 HC subjects did not show a correlation with any of the self- or microbial peptides (Figure 7, C and D). Of the 24 RA patients tested with the single peptides of GNS and FLNA (Figure 7), 17 were initially analyzed for T cell reactivity to pools of 4 peptides derived from these proteins (Figure 1). Only 4 of the 17 patients responded to the pool of peptides and not to the single peptide, suggesting that the majority of patients had reactivity to the single peptide epitope. Only 2 of the 17 patients responded to the single peptides, but failed to respond to the peptide pools. Using an in silico prediction method (Immune Epitope Database [IEDB] Analysis Resource tool; http://tools.immuneepitope.org/mhcii/), the GNS peptide and the corresponding microbial peptides were predicted to bind HLA-DR molecules encoded by SE alleles with significantly higher affinity than non-SE alleles (Figure 8A). In addition, there was a trend toward greater affinity of SE binding of the FLNA peptide and the corresponding microbial peptides (Figure 8B). Of the 24 patients with RA, 15 (62%) had SE alleles. Consistent with the IEDB binding predictions, 9 of 11 patients (82%) with self- and microbial T cell reactivity had SE alleles compared with 5 of 13 patients (38%) without T cell responses to these antigens (P = 0.05). Thus, patients who had reactivity to the self-peptides often responded to the corresponding microbial peptides; the magnitude of the self-responses showed a significant correlation with the microbial responses, and these were more frequent in patients with SE alleles. Figure 8 HLA-DR–binding prediction for self- and microbial peptides. Prediction analyses were performed using the IEDB Analysis Resource consensus tool. A low percentile rank indicates good peptide binders. (A) MHC class II–binding prediction of the GNS peptide and the corresponding microbial peptides. (B) MHC class II–binding prediction of the FLNA peptide and the corresponding microbial peptides. SE alleles: *0101, *0102, *0401, *0404, and *1001. Non-SE alleles: *0103, *0301, *0403, *0803, *1101, *1201, *1302, *1501, and *1601. Data represent median values with interquartile ranges. **P < 0.005, by Mann-Whitney U test. Discussion RA is an HLA class II–associated autoimmune disease in which mucosal immunity, often resulting from interaction with oral or gut microbes or from inhaled antigens in the lung, is hypothesized to cause autoimmune phenomena leading to joint inflammation and damage. However, the factors linking mucosal immunity to autoimmunity in joints have been unclear. In this study in which HLA-DR–presented peptides were identified directly from patients’ synovial tissue or PBMCs, 2 previously unidentified self-antigens, GNS and FLNA, were shown to be targets of T and B cell responses in 52% and 56% of RA patients, respectively. Importantly, the GNS and FLNA HLA-DR–presented T cell epitopes have considerable sequence homology with Prevotella epitopes and with similar epitopes from several related gut commensals belonging to the same order, particularly in areas predicted to be in the HLA-DR–binding groove. Moreover, T cell responses to the corresponding microbial and self-peptides were strongly correlated, suggesting that T cell epitope mimicry may provide a potential link between mucosal immunity and immune responses in affected joints. Moreover, GNS and FLNA autoantibodies correlated with P. copri antibody responses. This finding might also be due to cross-reactive Prevotella and host protein B cell epitopes, but we currently lack the recombinant microbial proteins to test this hypothesis directly. Alternatively, this correlation might simply be a reflection of T cell help resulting from T cell epitope mimicry. The presence of natural IgM, IgG, or IgA autoantibodies has been reported in the serum of normal control subjects and is characterized by broad reactivity to self- and microbial antigens (33, 34). However, our findings cannot be explained simply by nonspecific physiological responses. First, GNS and FLNA autoantibodies were increased specifically in a large subgroup of patients with RA, and not in patients with other rheumatic diseases or in HCs. Second, these self-autoantibodies correlated strongly with P. copri antibodies, but not with P. gingivalis antibodies. Third, patients with RA, but not healthy subjects, often had both T and B cell responses to these self-antigens. For control of the microbiota, the generation of specific, high-affinity IgA antibody responses requires T and B cell interactions (35), whereas the “natural” antibody pool consists primarily of low-affinity polyreactive IgA antibodies, whose production is independent of T cell help (36–38). Currently, the only known antibody responses that are specific for RA are directed against citrullinated proteins, in particular against enolase, vimentin, and fibronectin (39). Moreover, there is hypercitrullination of a range of proteins in the joints of many patients with RA (40). In our study, the GNS protein appeared to be citrullinated in vivo, and antibodies against it correlated with ACPA levels, whereas levels of antibodies against the FLNA protein, which did not appear to be citrullinated, did not correlate with ACPA levels. Moreover, HLA-DR molecules encoded by RA SE alleles bound the GNS peptide and, to a lesser degree, the FLNA peptide with higher affinity than did non-SE alleles, and SE alleles largely influence the generation of ACPAs (3). Both FLNA and GNS self-antigens, which are often highly expressed in RA synovial tissue, represent good autoimmune targets. GNS is an enzyme located in lysosomes and is involved in the degradation and recycling of different molecules, such as glycosaminoglycans (GAGs) (https://ghr.nlm.nih.gov/gene/GNS), a major component of joint cartilage and other soft connective tissues (41). FLNA is a ubiquitous, fundamental protein for building the cell cytoskeleton and organizing the extracellular matrix (42). In addition, FLNA is required for cell-cell contact in vascular development (43). Consistent with its function, we found that FLNA protein was especially prominent in the tunica muscularis around blood vessels in RA synovial tissue and was also faintly expressed in the extracellular matrix. However, it is not yet clear why the GNS protein was seen only in a reticular pattern around blood vessels. Nevertheless, the important point is that both host proteins would be available for HLA-DR presentation in synovial tissue and both represent potential targets for autoimmune responses. High-throughput sequencing of stool samples in 2 studies of RA patients showed gut dysbiosis (13, 14), and 1 study reported overexpansion of Prevotella spp., particularly P. copri (13). However, little is known about potential bowel pathology in RA. The major limitation of our study is the lack of specific information about pathology or immune responses in the bowel. Our study of patients with NORA was originally intended as a study of mouth flora and periodontal disease (30), and, therefore, the collection of stool samples was not a part of our protocol. Nevertheless, the finding of gut dysbiosis favoring Prevotella (13), the identification of P. copri as an immune-relevant bacterium in RA (25), and the finding here of specific T and B cell responses to Prevotella and corresponding GNS and FLNA epitopes suggest that mucosal immune responses in the gut may be a part of the disease in a sizable subgroup of RA patients. Although DMARD therapy may resolve dysbiosis (14) and P. copri overexpansion (13), immune reactivity to the organism, once triggered, appeared to persist or even increase in patients with CRA who were taking these medications. In contrast, patients with SpA or postinfectious, antibiotic-refractory LA, which may also be treated with DMARDs, did not have reactivity to this organism (25). Taken together, our studies highlight a possible mechanism linking gut and joint inflammation. We hypothesize that dysbiosis or low-grade gut inflammation may compromise the mucosal barrier and result in leakage of commensal organisms, leading to activation of lymphocytes targeting microbial antigens. Here, we provide evidence that T cell epitopes of a related order of gut microbes, particularly Prevotella spp., may cross-react with self-epitopes of highly expressed proteins in joints, especially in patients with SE alleles. T cells activated by microbial peptides at the mucosal surface may then home to inflamed joints and cross-react with homologous self-antigens. In addition, as we have previously reported (25), commensal organisms or their remnants or microbe-activated antigen-presenting cells (APCs) may occasionally home to joints, where they further amplify joint inflammation and restimulate self-reactive T cells. Thus, an initial trigger in the gut mucosa may activate cross-reactive microbial immune responses that have the potential to shift to an autoimmune phenotype at sites where the homologous self-antigens are expressed. Even though proof of cross-reactivity will require the cloning of single T cells, the prominence of homologous epitopes among gut microbes and epitopes from 2 self-proteins in synovial tissue, the greater affinity of HLA-DR molecules encoded by SE alleles in binding these epitopes, and the demonstration that RA patients often have T cell responses to corresponding microbial and self-epitopes suggest the potential for these immune responses to have a role in RA pathogenesis. We do not think that these mechanisms are the entire explanation for the marked inflammatory and proliferative responses in the RA synovial lesion. Rather, we propose that these mechanisms play a role in linking gut and joint immune responses and in amplifying synovial inflammation in a large subgroup of RA patients. Although knowledge of bowel pathology is not yet clear in patients with RA, the identification of immune responses to P. copri, GNS, and FLNA has practical implications for the diagnosis and treatment of the disease. First, these immune responses appear to be specific for RA. As shown here, the addition of GNS and FLNA to standard autoantibody determinations (ACPAs and RF) increased the percentage of seropositive patients from 69% to 86%, thereby improving the diagnostic support for some patients with seronegative RA, who currently lack specific markers. Furthermore, the inclusion of citrullinated GNS in a test for ACPAs may increase the sensitivity of that test. These determinations have increased in importance, because earlier treatment with DMARDs may improve long-term outcomes, whereas a lack of diagnostic markers for seronegative patients may delay appropriate DMARD treatment, leading to less favorable clinical outcomes (44, 45). Finally, in addition to DMARDs, the identification of patients with these antibody responses may allow the testing and development of adjunctive forms of treatment, such as brief, targeted antibiotic regimens or diet alterations. Ultimately, the identification of pathogenic T cell epitopes in synovial tissue, as was done here, may make it possible to engineer blocking peptides, which would limit autoimmune stimulation and ameliorate these presumably disadvantageous autoimmune responses. Methods Patients and control subjects. The 101 patients in this study met the American College of Rheumatology and the European League Against Rheumatism Collaborative Initiative criteria for the diagnosis of RA (46). Of these 101 patients, 49 had NORA for 12 months or less and had not yet been treated with DMARDs. The remaining 52 patients had CRA of more than 1 year’s duration (usually for many years), often treated with DMARDs. For isolation of HLA-DR–presented peptides, synovial tissue and PBMCs were obtained from patient RA1, who was undergoing arthroscopic synovectomy. To test the implicated peptides and their source proteins for immunoreactivity in additional patients, PBMCs and serum samples were collected from patients with NORA, but only serum samples were available from patients with CRA. For other comparison groups, serum samples were collected from 28 patients with CTD, including systemic lupus, mixed CTD, scleroderma, and Sjögren’s syndrome; 28 patients with SpA; and 50 patients with LA. Additionally, serum samples and PBMCs were collected from 15 healthy hospital personnel who did not have a history of RA or other autoimmune diseases, and serum samples were obtained from 40 healthy blood bank donors. HLA-DR typing was performed on blood samples from all RA or LA patients and from healthy subjects at the American Red Cross Laboratory in Dedham, Massachusetts, USA. ELISpot T cell assay. A detailed description of the methods for the isolation and identification of HLA-DR–presented peptides is given in our previous publications (19, 20). In the current study, all nonredundant HLA-DR–presented peptides identified from patient RA1 were synthesized (Mimotopes) and tested for reactivity in sets of 3 (1 μM of each peptide) using the patient’s PBMCs in IFN-γ ELISpot assays. In this initial screen, 2 self-peptides derived from GNS and FLNA were implicated; the remaining 138 peptides showed no reactivity. For testing in larger numbers of patients and control subjects, who would have a range of HLA-DR genotypes, the original peptides identified from the patient (shown in bold) and 3 additional promiscuous peptides that were predicted to bind 16 or more HLA-DR molecules were synthesized and HPLC purified at the MGH Core Facility. The GNS peptide sequences were as follows: 47PNVVLLLTDDQDE59, 222FEPFFMMIATPAPH235, 451TYACVRTMSALWNLQ465, 504NYRLMMLQSCSGPTC518. The FLNA peptide sequences were as follows: 73DGLRLIALLEVLSQKK88, 118SIKLVSIDSKAIVDG132, 416VEVVIQDPMGQKG428, 2446NPAEFVVNTSNAGAG2460. To assess microbial sequence homology with the GNS peptide 222FEPFFMMIATPAPH235, the following microbial peptides were tested: 231KKPFFMMVAMNPPH245, which was derived from the arylsulfatase protein of the Prevotella spp. (WP_062433009.1) and 247DVPFFMMWTTPLPH261, derived from the GNS of the Parabacteroides sp. (WP_046148720.1). To evaluate the microbial sequence homology for the FLNA peptide 2446NPAEFVVNTSNAGAG2460, the following microbial peptides were tested: 133QGFVVKTANAGAL146, which was derived from an uncharacterized protein of the Prevotella sp. (WP_028897633.1) and 90ANFMINVSNAGAL103, derived from an uncharacterized protein of the Butyricimonas sp. (WP_065219401.1). The RA patients’ PBMCs were stimulated with the pool of peptides or single peptides and analyzed for reactivity to a human IFN-γ/IL-17 Double-Color ELISpot Kit (Cellular Technology Ltd.). All peptides (1 μM) were tested in duplicate wells, as were positive (phytohemagglutinin) and negative (no antigen) control samples. After 5 days, cells were transferred to ELISpot plates coated with IFN-γ/IL-17 antibodies and incubated overnight. Images of wells were captured using an ImmunoSpot Series 3B Analyzer (Cellular Technology Ltd.), and spots were counted using ImmunoSpot software. A positive T cell response was defined as 3 SD above the mean value for HC subjects. ELISA for serum IgG and IgA anti-GNS and anti-FLNA autoantibodies. ELISA plates were coated with 0.5 μg/ml rhGNS (Novoprotein) or rhFLNA (Novusbio) overnight at 4°C. Subsequent incubations and washes were performed at room temperature. After washing with PBS containing 0.05% Tween-20 (PBST), the plates were blocked with blocking buffer (5% nonfat dry milk in PBST) for 1 hour. Afterwards, 100 μl of each patient’s serum sample (diluted 50-fold) was added in duplicate wells for 1.5 hours, followed by HRP-conjugated goat anti-human IgG (sc-2453; Santa Cruz Biotechnology Inc.) or HRP-conjugated goat anti-human IgA (STAR141P; Bio-Rad), and then tetramethylbenzidine (TMB) substrate (BD). For interplate standardization, 2 control samples were included with each assay. In vitro citrullination assay. rhGNS (2 μg) or rhFLNA (2 μg) was incubated with rhPAD4 (400 ng), which was provided by Maximilian Koenig from the laboratory of Felipe Andrade (Johns Hopkins School of Medicine, Baltimore, Maryland, USA) in 1 M Tris (pH 7.6) in the presence of 200 mM CaCl2. A negative control reaction was performed, substituting 200 mM CaCl2 with 200 mM EDTA. Incubation was performed at 37°C for 3 hours. Protein citrullination was determined by anti–modified citrulline immunoblotting, according to the manufacturer’s recommendations (EMD Millipore). Quantification of GNS and FLNA protein levels in serum and joint fluid. ELISA plates were coated with 5 μg/ml capture antibody (sc-161669 for GNS and sc-58764 for FLNA; Santa Cruz Biotechnology Inc.) overnight at 4°C. Plates were then washed with PBS and blocked with PBST containing 5% milk (blocking buffer) for 1 hour. Afterwards, serum or joint fluid samples (diluted 1:10 in blocking buffer) were added in duplicate and incubated for 2 hours at room temperature. Next, a detection antibody (5 μg/ml) (SAB1410557 for GNS from Sigma-Aldrich; sc-28284 for FLNA from Santa Cruz Biotechnology Inc.) was added for 2 hours. The plates were then incubated with goat anti-rabbit IgG-HRP (sc-2030; Santa Cruz Biotechnology Inc.), followed by TMB substrate. For interplate standardization, 2 control samples were included on each plate. Immunohistochemistry. Fresh-frozen synovial tissue samples were stained for GNS and FLNA proteins. After blocking, the sections were incubated with a rabbit polyclonal antibody against GNS (SAB1410557; Sigma-Aldrich) and a mouse monoclonal antibody against FLNA (sc-17749; Santa Cruz Biotechnology Inc.) at 4°C overnight. For negative controls, nonspecific rabbit or mouse IgG antibodies (Sigma-Aldrich) were used. The following day, the sections were incubated with a biotinylated anti-rabbit (HK336-5R; Biogenex) or anti-mouse (HK335-5M; Biogenex) secondary antibody, peroxidase-streptavidin, and then a diaminobenzidine substrate. The slides were counterstained with Mayer’s hematoxylin and mounted with Permount Mounting Medium (Fisher Scientific). Microscopic images were obtained with a Zeiss widefield microscope. In silico determinations of HLA-DR–binding affinity. The affinity of HLA-DR binding of the GNS, FLNA, and related microbial peptides was determined using the T cell epitope – MHC class II molecules binding prediction tool from the IEDB Analysis Resource. This tool uses different methods to predict MHC class II epitopes, including a consensus approach that combines NN-align, SMM-align, and combinatorial library methods. For the analysis, all HLA-DR alleles found in the RA cohort were analyzed, including 5 SE alleles and 9 non-SE alleles. Statistics. Categorical data were analyzed by Fisher’s exact test, and quantitative data were analyzed using an unpaired, 2-tailed t test with Welch’s correction. Correlations were determined using Spearman’s correlation test. All analyses were performed using GraphPad Prism 6 (GraphPad Software). All P values are 2-tailed. P values of 0.05 or less were considered statistically significant. Study approval. The present study was reviewed and approved by the Human Investigations Committee at MGH (2008 to 2014). All patients and control subjects provided written informed consent prior to their participation in the study. Author contributions AP designed and performed the experiments and analyzed the data. SLA and ACS enrolled and cared for patients in the study, handled clinical data collection, and performed clinical correlations. QW and CEC performed mass spectrometric analyses. EED, KS, and ACS provided advice and data analysis interpretation. All authors contributed to the preparation of the manuscript. Acknowledgments We thank Deborah Collier and Marcy Bolster (MGH, Boston, MA) for help with patient care; Maximilian Koenig and Felipe Andrade (Johns Hopkins University, Baltimore, MD) for providing the human PAD4 enzyme for citrullination assays; Gunnlaugur Petur Nielsen (MGH, Boston, MA) for help with the description of synovial immunohistology; Dennis Burke (MGH, Boston, MA) and John Aversa (Yale University, New Haven, CT) for help with obtaining synovial tissue; Mandakolathur Murali (MGH, Boston, MA) for RF and ACPA analyses; the American Red Cross laboratory for HLA-DR typing of patients; and Katherine Sulka (MGH, Boston, MA) for help with the preparation of samples for HLA-DR typing. This work was supported by grants from the American College of Rheumatology Innovative Grant Program “Within our Reach, Finding a Cure for RA;” the Ounsworth-Fitzgerald Foundation; the Mathers Foundation; the English, Bonter, Mitchell Foundation; the Littauer Foundation; the Lillian B. Davey Foundation; the Eshe Fund (to ACS); and the NIH (P41 GM104603, S10 RR020946, and S10 OD010724, to CEC). SLA received support from a Scientist Development Award from the Rheumatology Research Foundation. Footnotes EED’s present address is: Agenus Inc, Lexington, Massachusetts, USA. QW’s present address is: Waters Corporation, Milford, Massachusetts, USA. Conflict of interest: The authors have declared that no conflict of interest exists. Reference information: J Clin Invest. 2017;127(8):2946–2956.https://doi.org/10.1172/JCI93450. References Li Y, et al. Deficient activity of the nuclease MRE11A induces T cell aging and promotes arthritogenic effector functions in patients with rheumatoid arthritis. Immunity. 2016;45(4):903–916. View this article via: PubMed CrossRef Google Scholar Gregersen PK, Silver J, Winchester RJ. The shared epitope hypothesis. An approach to understanding the molecular genetics of susceptibility to rheumatoid arthritis. Arthritis Rheum. 1987;30(11):1205–1213. View this article via: PubMed CrossRef Google Scholar McInnes IB, Schett G. The pathogenesis of rheumatoid arthritis. N Engl J Med. 2011;365(23):2205–2219. View this article via: PubMed CrossRef Google Scholar Nishimura K, et al. Meta-analysis: diagnostic accuracy of anti-cyclic citrullinated peptide antibody and rheumatoid factor for rheumatoid arthritis. Ann Intern Med. 2007;146(11):797–808. View this article via: PubMed CrossRef Google Scholar Schellekens GA, de Jong BA, van den Hoogen FH, van de Putte LB, van Venrooij WJ. Citrulline is an essential constituent of antigenic determinants recognized by rheumatoid arthritis-specific autoantibodies. J Clin Invest. 1998;101(1):273–281. View this article via: JCI PubMed CrossRef Google Scholar Suzuki K, et al. High diagnostic performance of ELISA detection of antibodies to citrullinated antigens in rheumatoid arthritis. Scand J Rheumatol. 2003;32(4):197–204. View this article via: PubMed CrossRef Google Scholar del Puente A, Knowler WC, Pettitt DJ, Bennett PH. The incidence of rheumatoid arthritis is predicted by rheumatoid factor titer in a longitudinal population study. Arthritis Rheum. 1988;31(10):1239–1244. View this article via: PubMed CrossRef Google Scholar Majka DS, et al. Duration of preclinical rheumatoid arthritis-related autoantibody positivity increases in subjects with older age at time of disease diagnosis. Ann Rheum Dis. 2008;67(6):801–807. View this article via: PubMed CrossRef Google Scholar Nielen MM, et al. Specific autoantibodies precede the symptoms of rheumatoid arthritis: a study of serial measurements in blood donors. Arthritis Rheum. 2004;50(2):380–386. View this article via: PubMed CrossRef Google Scholar Bachmaier K, Neu N, de la Maza LM, Pal S, Hessel A, Penninger JM. Chlamydia infections and heart disease linked through antigenic mimicry. Science. 1999;283(5406):1335–1339. View this article via: PubMed CrossRef Google Scholar Miller SD, et al. Persistent infection with Theiler’s virus leads to CNS autoimmunity via epitope spreading. Nat Med. 1997;3(10):1133–1136. View this article via: PubMed CrossRef Google Scholar Zhao ZS, Granucci F, Yeh L, Schaffer PA, Cantor H. Molecular mimicry by herpes simplex virus-type 1: autoimmune disease after viral infection. Science. 1998;279(5355):1344–1347. View this article via: PubMed CrossRef Google Scholar Scher JU, et al. Expansion of intestinal Prevotella copri correlates with enhanced susceptibility to arthritis. Elife. 2013;2:e01202. View this article via: PubMed Google Scholar Zhang X, et al. The oral and gut microbiomes are perturbed in rheumatoid arthritis and partly normalized after treatment. Nat Med. 2015;21(8):895–905. View this article via: PubMed CrossRef Google Scholar Maeda Y, et al. Dysbiosis contributes to arthritis development via activation of autoreactive T cells in the intestine. Arthritis Rheumatol. 2016;68(11):2646–2661. View this article via: PubMed CrossRef Google Scholar Hemmer B, et al. Predictable TCR antigen recognition based on peptide scans leads to the identification of agonist ligands with no sequence homology. J Immunol. 1998;160(8):3631–3636. View this article via: PubMed Google Scholar Horwitz MS, Bradley LM, Harbertson J, Krahl T, Lee J, Sarvetnick N. Diabetes induced by Coxsackie virus: initiation by bystander damage and not molecular mimicry. Nat Med. 1998;4(7):781–785. View this article via: PubMed CrossRef Google Scholar Ehl S, et al. Viral and bacterial infections interfere with peripheral tolerance induction and activate CD8+ T cells to cause immunopathology. J Exp Med. 1998;187(5):763–774. View this article via: PubMed CrossRef Google Scholar Seward RJ, Drouin EE, Steere AC, Costello CE. Peptides presented by HLA-DR molecules in synovia of patients with rheumatoid arthritis or antibiotic-refractory Lyme arthritis. Mol Cell Proteomics. 2011;10(3):M110.002477. View this article via: PubMed CrossRef Google Scholar Wang Q, et al. Immunogenic HLA-DR-presented self-peptides identified directly from clinical samples of synovial tissue, synovial fluid, or peripheral blood in patients with rheumatoid arthritis or Lyme arthritis. J Proteome Res. 2017;16(1):122–136. View this article via: PubMed CrossRef Google Scholar Drouin EE, et al. A novel human autoantigen, endothelial cell growth factor, is a target of T and B cell responses in patients with Lyme disease. Arthritis Rheum. 2013;65(1):186–196. View this article via: PubMed CrossRef Google Scholar Crowley JT, et al. A highly expressed human protein, apolipoprotein B-100, serves as an autoantigen in a subgroup of patients with Lyme disease. J Infect Dis. 2015;212(11):1841–1850. View this article via: PubMed CrossRef Google Scholar Crowley JT, et al. Matrix metalloproteinase-10 is a target of T and B cell responses that correlate with synovial pathology in patients with antibiotic-refractory Lyme arthritis. J Autoimmun. 2016;69:24–37. View this article via: PubMed CrossRef Google Scholar Pianta A, et al. Annexin A2 is a target of autoimmune T and B cell responses associated with synovial fibroblast proliferation in patients with antibiotic-refractory Lyme arthritis. Clin Immunol. 2015;160(2):336–341. View this article via: PubMed CrossRef Google Scholar Pianta A, et al. Evidence for immune relevance of Prevotella copri, a gut microbe, in patients with rheumatoid arthritis. Arthritis Rheumatol. 2017;69(5):964–975. View this article via: PubMed CrossRef Google Scholar Sturniolo T, et al. Generation of tissue-specific and promiscuous HLA ligand databases using DNA microarrays and virtual HLA class II matrices. Nat Biotechnol. 1999;17(6):555–561. View this article via: PubMed CrossRef Google Scholar Mikuls TR, et al. Periodontitis and Porphyromonas gingivalis in patients with rheumatoid arthritis. Arthritis Rheumatol. 2014;66(5):1090–1100. View this article via: PubMed CrossRef Google Scholar Sievers F, et al. Fast, scalable generation of high-quality protein multiple sequence alignments using Clustal Omega. Mol Syst Biol. 2011;7:539. View this article via: PubMed Google Scholar Yu CS, Lin CJ, Hwang JK. Predicting subcellular localization of proteins for Gram-negative bacteria by support vector machines based on n-peptide compositions. Protein Sci. 2004;13(5):1402–1406. View this article via: PubMed CrossRef Google Scholar Arvikar SL, et al. Clinical correlations with Porphyromonas gingivalis antibody responses in patients with early rheumatoid arthritis. Arthritis Res Ther. 2013;15(5):R109. View this article via: PubMed CrossRef Google Scholar Benjdia A, Martens EC, Gordon JI, Berteau O. Sulfatases and a radical S-adenosyl-L-methionine (AdoMet) enzyme are key for mucosal foraging and fitness of the prominent human gut symbiont, Bacteroides thetaiotaomicron. J Biol Chem. 2011;286(29):25973–25982. View this article via: PubMed CrossRef Google Scholar Ulmer JE, et al. Characterization of glycosaminoglycan (GAG) sulfatases from the human gut symbiont Bacteroides thetaiotaomicron reveals the first GAG-specific bacterial endosulfatase. J Biol Chem. 2014;289(35):24289–24303. View this article via: PubMed CrossRef Google Scholar Coutinho A, Kazatchkine MD, Avrameas S. Natural autoantibodies. Curr Opin Immunol. 1995;7(6):812–818. View this article via: PubMed CrossRef Google Scholar Dighiero G. Natural autoantibodies, tolerance, and autoimmunity. Ann N Y Acad Sci. 1997;815:182–192. View this article via: PubMed CrossRef Google Scholar Kroese FG, Butcher EC, Stall AM, Lalor PA, Adams S, Herzenberg LA. Many of the IgA producing plasma cells in murine gut are derived from self-replenishing precursors in the peritoneal cavity. Int Immunol. 1989;1(1):75–84. View this article via: PubMed CrossRef Google Scholar Macpherson AJ, Gatto D, Sainsbury E,
|
|
Scooped by
Gilbert C FAURE
December 1, 2020 2:28 PM
|
The immunopathogenesis of rheumatoid arthritis (RA) spans decades, beginning with the production of autoantibodies against post-translationally modified proteins (checkpoint 1). After years of asymptomatic autoimmunity and progressive immune system remodeling, tissue tolerance erodes and joint inflammation ensues as tissue-invasive effector T cells emerge and protective joint-resident macrophages fail (checkpoint 2). The transition of synovial stromal cells into autoaggressive effector cells converts synovitis from acute to chronic destructive (checkpoint 3). The loss of T cell tolerance derives from defective DNA repair, causing abnormal cell cycle dynamics, telomere fragility and instability of mitochondrial DNA. Mitochondrial and lysosomal anomalies culminate in the generation of short-lived tissue-invasive effector T cells. This differentiation defect builds on a metabolic platform that shunts glucose away from energy generation toward the cell building and motility programs. The next frontier in RA is the development of curative interventions, for example, reprogramming T cell defects during the period of asymptomatic autoimmunity. Weyand and Goronzy discuss how the progressive loss of immune cell tolerance underlies the immunopathology associated with rheumatoid arthritis.
|
|
Scooped by
Gilbert C FAURE
December 1, 2020 6:23 AM
|
Aims The lack of disease-modifying treatments for osteoarthritis (OA) is linked to a shortage of suitable biomarkers. This study combines multi-molecule synovial fluid analysis with machine learnin...
|


 Scoop.it!