


Trends can help to visualize the big picture while looking at a 12-months sales chart or Year-to-Date chart in accounting or financial PowerPoint. This article explains how to add trendlines to a PowerPoint chart.


|
Scooped by
FPPT
onto PowerPoint Tips & Presentation Design March 7, 2014 1:24 PM
|
 Scoop.it!
Trends can help to visualize the big picture while looking at a 12-months sales chart or Year-to-Date chart in accounting or financial PowerPoint. This article explains how to add trendlines to a PowerPoint chart.


 Your new post is loading...
Scoop.it!

Agreements and contracts are held in writing to follow a set of certain rules and regulations for binding both parties in some deal. Now the world has been transformed from a materialistic approach to soft data, Free Partnership Agreement PowerPoint Template with the image of a young man is a wonderful design for the presentations on …
Scoop.it!

We have compiled a list of our pick for the Best Target Diagram templates for PowerPoint presentations, which provide easy customization and a wide range of slide layouts, very useful for business presentations.
Scoop.it!
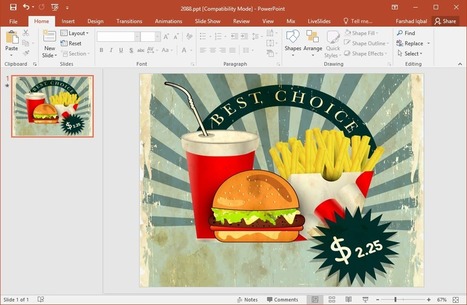
In this post we will show you how to use PowerPoint digital signage by setting up your custom slideshow loop in a few easy steps.
Scoop.it!

Download the Free Photography Camera PowerPoint Template to present your ideas, photos, collages, picture slideshows and more.
Scoop.it!
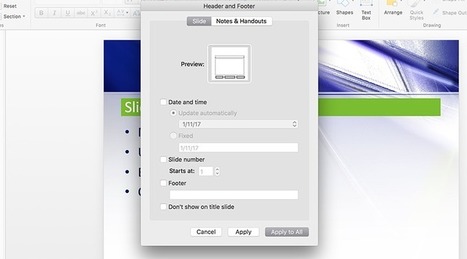
Slide number options can be configured in PowerPoint in order to add the slide numbers to your slides. Inserting a slide number in all the slides of a PowerPoint presentation is very easy, learn here how to do it
Scoop.it!
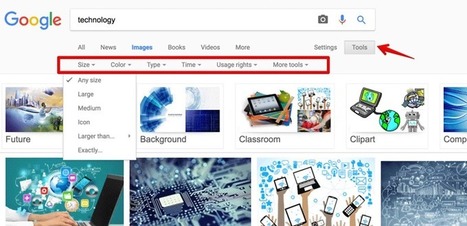
When searching for images online, there are many resources to do that. You may try to find relevant images to the presentation topic as well as other assets to use in your presentations such …
Scoop.it!

The Social Media PowerPoint Template is the perfect template for social media related presentations in PowerPoint, social media reports and project proposals.
Scoop.it!

The Animated HR PowerPoint Template can help create HR presentations using readymade layouts, diagrams, and infographic slides.
Scoop.it!

Presentation definition, with a detailed explanation of the common types, methods and apps used by presenters to effectively deliver presentations.
Scoop.it!

Things that you can do to spice up your introductory PowerPoint slides is to use animations, Animated PowerPoint Templates and application of the right
FPPT's insight:
Demo PowerPoint template to show the animated transition effects that you can create in PowerPoint
Scoop.it!

With Xcelsius you can deploy dashboards using the Adobe Flash format .swf into your application server, however if you need to embed these dashboards in your
Scoop.it!

Resume templates in PowerPoint are very useful to quickly make a professional resume using one of the most popular presentation tools. There are different ways
|
Scoop.it!

Great collection of 10+ FREE blue background designs for presentations (free download)
Scoop.it!

Saving PowerPoint presentations to image is something that we could do if we want to use the presentation slides as images. However, in some situations, we’d like to save a shape as an image and keep the 100% transparent background.
Scoop.it!
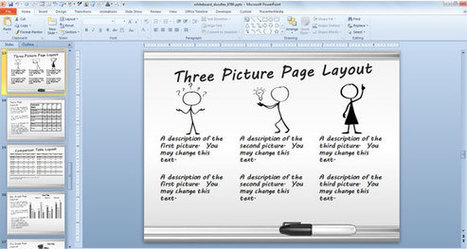
If you are looking to make professional PowerPoint presentations with whiteboard doodles then you can get this awesome whiteboard PowerPoint template from PresenterMedia.
Scoop.it!

A .ppsx file is a Microsoft PowerPoint Open XML Slide Show file format that is used as the modern version of the PPS format (the PPS format was used prior to Microsoft Office 2007 and earlier).
Scoop.it!

Learn how to draw a light bulb graphic in PowerPoint. Lightbulbs are widely used either in infographics but also in business presentations, as a metaphor of bright & new ideas, being smart, etc.
Scoop.it!
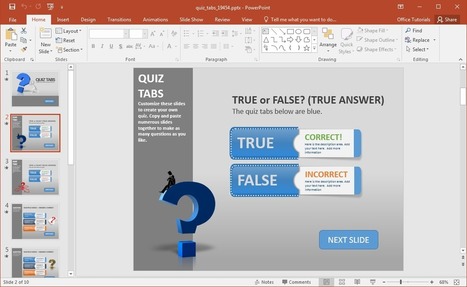
The Animated Quiz Tabs PowerPoint Template is a presentation template that can help you create a quiz in PowerPoint by revealing right answers upon mouse-click during a Live presentation.
Scoop.it!

The Animated Info Tabs PowerPoint Template can be used for making presentations with customizable, animated infographic slides.
Scoop.it!

Here is a list of 9 PowerPoint Myths Proved Wrong with handy tools and tips which can enable you to make PowerPoint more powerful.
Scoop.it!

Pear Deck is an excellent web service which can help you conduct interactive class lectures to keep things interesting during boring academic topics.
Scoop.it!

The video given below shows the process of making a hand drawn circular process diagram in Microsoft PowerPoint 2013.
Scoop.it!

If you want to create professional looking 3D battery graphics for PowerPoint presentations, then here is a simple tutorial for you.
|






