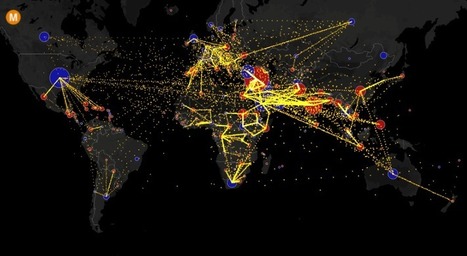

Facebook Twitter Google+ LinkedIn60.7KsharesThis map shows the estimated net immigration (inflows minus outflows) by origin and destination country between 2010 and 2015. Blue circles = positive net migration (more inflows). Red circles = negative net migration (more outflows). Each yellow dot represents 1,000 people. Hover over a circle to see that country’s total net migration between …


 Your new post is loading...