


Cartographers are mapping the coronavirus in more sophisticated ways than past epidemics. But visualizing outbreaks dates back to cholera and yellow fever.
Get Started for FREE
Sign up with Facebook Sign up with X
I don't have a Facebook or a X account


 Your new post is loading...
 Your new post is loading...
Your new post is loading...
Cartographers are mapping the coronavirus in more sophisticated ways than past epidemics. But visualizing outbreaks dates back to cholera and yellow fever.
Geography Teachers' Association of Victoria Inc. (GTAV)'s insight:
Very good article, especially used in conjunction with BBC Coronavirus website

No comment yet.
Sign up to comment

Not everyone sees color the way you do. There are a suite of tools available to help graphic designers work more inclusively.
Geography Teachers' Association of Victoria Inc. (GTAV)'s insight:
Maps to help people who are color blind.

It’s essential for both public and private organizations to make greater investment in and encourage the adoption of GIS to ensure the disasters of the future are less catastrophic.
Geography Teachers' Association of Victoria Inc. (GTAV)'s insight:
Essential understanding at all levels, especially V.C.E.
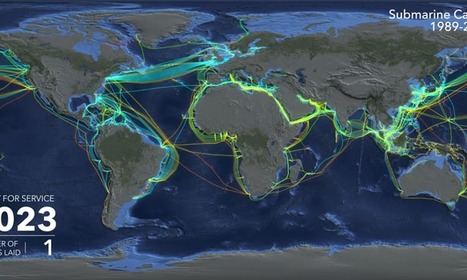
Watch the explosive growth of the global submarine cable network, and learn who's funding the next generation of cables.
Geography Teachers' Association of Victoria Inc. (GTAV)'s insight:
Our un seen connections...

When mapping deprivation, using traditional boundaries can distort the data and distract readers from important information.
Geography Teachers' Association of Victoria Inc. (GTAV)'s insight:
This article highlights the dangers of a national approach to geography, rather than a regional one.
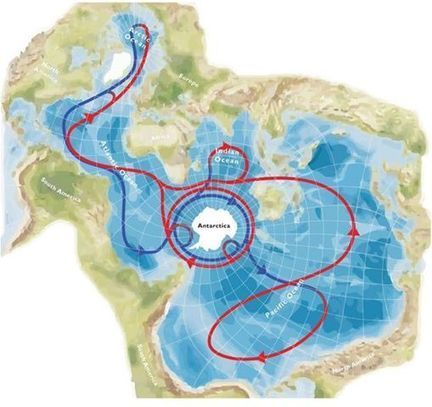
A Spilhaus map projection seems like a smart choice to display ocean circulation. For lots of other data this projection wouldn't be the best choice but here it works perfectly
Geography Teachers' Association of Victoria Inc. (GTAV)'s insight:
A Spilhaus map projection seems like a smart choice to display ocean circulation. For lots of other data this projection wouldn't be the best choice but here it works perfectly! Source: https://buff.ly/2YQXsLd

Ayanda Zamaswazi Mavuso 's curator insight,
November 7, 2019 4:27 AM
Ocean currents play a huge role in influencing temperature around the world.

This smart cane for the blind includes Google Maps, Bluetooth technology, and a hi-tech sensory device that will change the lives of the visually impaired.
Geography Teachers' Association of Victoria Inc. (GTAV)'s insight:
How very clever!

Since 2000, the world has doubled its coal-fired power capacity to around 2,000 gigawatts (GW) after explosive growth in China and India. A further 236GW is being built and 336GW is planned.
Geography Teachers' Association of Victoria Inc. (GTAV)'s insight:
Mapping coal fired energy plants.
3D Simtable - HANDS ON HAZARDS presented... - Geography Teachers' Association of Victoria | Facebook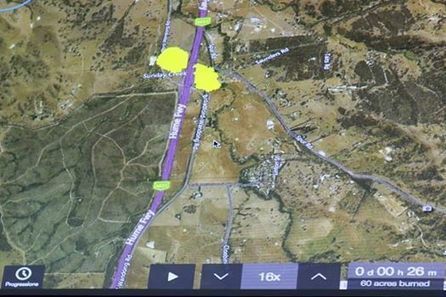
3D Simtable - HANDS ON HAZARDS presented by Mitch Emmett, CFA (Country Fire Authority)
Geography Teachers' Association of Victoria Inc. (GTAV)'s insight:
3D Simtable - using this technology for hazards (especially bushfire) management.
Geography Teachers' Association of Victoria Inc. (GTAV)'s insight:
Proportional sizes of nations compared with the United States, gives students a clearer global perspective.

This interactive map shows the real size of countries on a mercator projection map. The animation shows some countries shrinking to show their true size.
Geography Teachers' Association of Victoria Inc. (GTAV)'s insight:
Projections are rarely accurate and are confusing. They can also be a political tool! This article considers the real dimensions of countries.

Erratic motion of north magnetic pole forces experts to update model that aids global navigation.
Geography Teachers' Association of Victoria Inc. (GTAV)'s insight:
North - 3 varieties! and changing rapidly....

AUSTRALIAN history is being turned on its head by a groundbreaking project which is documenting hundreds of horrific massacres that make up our bloody past.
Geography Teachers' Association of Victoria Inc. (GTAV)'s insight:
Mapping Australia's massacre sites.

Thomas James Kurkowski's curator insight,
May 13, 2020 9:30 PM
The source talks of a map of Australian massacres of indigenous Australians. I could see myself using a resource like that to teach in accordance with AITSL standard 2.4 . extended insight: This resource would be useful in the history class because it makes the course content immediately relevant to the student's lived experience, it creates a launching point for driven students to discover their past and it is an excellent resource for showing the historical process in action. As a tool to show the relevance to the student's history education, I think that showing the students that terrible things happened within their town in the recent past will be a shock to many students. In some of the later cases it is possible that the people that committed these massacres are the ancestors of people within the classroom. Ideally, the students should be able to find drive in the idea that there was a darker side to the development of many Australian towns which they grew up in. Hopefully students will begin to think critically about how Australia became what it is today in the context of colonial violence. The best usage of the resource, however, is probably in how well it can be used to demonstrate the work and role of a historian.The resource is thorough in scope but light in detail, which means that it is a good launching point for students to fill in the gaps. in the manner that a historian would- via inquiry and the assessment of primary sources. |

No matter where you are in Australia — make sure you know that it's on Aboriginal land ... and *what* Aboriginal land.
Geography Teachers' Association of Victoria Inc. (GTAV)'s insight:
An essential site for us to start to live comfortably with first nations people...know who was here first.
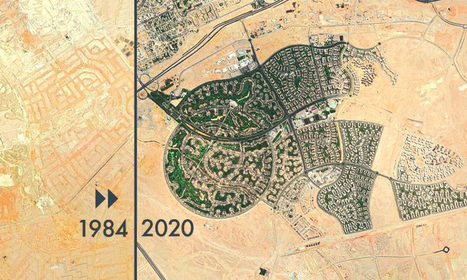
Humankind’s spatial patterns are difficult to recognize from the ground. Google Earth Timelapse captures these drastic changes from space over time.
Geography Teachers' Association of Victoria Inc. (GTAV)'s insight:
Use of timelapse satellite images to show changing environments

From explosive volcanic eruptions to rampaging wildfires and catastrophic floods, satellites, as well as astronauts aboard the International Space Station, captured all the action
Geography Teachers' Association of Victoria Inc. (GTAV)'s insight:
How good is satellite photography?

Apple Maps now shows Crimea - annexed from Ukraine in 2014 - as part of Russia, when viewed there.
Geography Teachers' Association of Victoria Inc. (GTAV)'s insight:
Ethics and technology?
Enjoy the videos and music you love, upload original content, and share it all with friends, family, and the world on YouTube.
Geography Teachers' Association of Victoria Inc. (GTAV)'s insight:
Great video on GPS and Australia from Geoscience Australia

A nonprofit called The Earth Archive wants to make a 3D map of the entire planet, before the climate crisis changes Earth's face forever.
Geography Teachers' Association of Victoria Inc. (GTAV)'s insight:
So we will know what we lost, after it is gone!

Here are 10 iconic map projections. None is inherently bad or unfair but as a consumer of information you will want to be aware in what way information might be distorted by the nature o
Geography Teachers' Association of Victoria Inc. (GTAV)'s insight:
Map Projections-good and bad points.

Social media and geospatial technology offer access to huge amounts of data, but vast ethical implications are often ignored.
Geography Teachers' Association of Victoria Inc. (GTAV)'s insight:
New technology is vital in understanding and managing our resources, however, are there ethical dillemna/

Rich visual content for the modern investor. Visual Capitalist is a new way to discover business opportunities and learn about investment trends.
Geography Teachers' Association of Victoria Inc. (GTAV)'s insight:
The graph of all nation's carbon emissions is on GTAVFacebook page on June 5th This site has excellent graphs of all types - recommend especially the energy tab. (Scroll down a little and then back up and the tabs will appear)

Augmented reality means you might never again be confused about which way you should be walking on an unfamiliar road.
Geography Teachers' Association of Victoria Inc. (GTAV)'s insight:
The smartphone is an imprtant geography tool -augmented reality is useful for livability and general use.

We’ve gathered graphs previously published in The Times that illustrate different aspects of climate change. Plus, we suggest strategies for helping students analyze what they see.
Geography Teachers' Association of Victoria Inc. (GTAV)'s insight:
These interactive graphs will help effectively teach climate change - many students know the words but do not really understand the process.

It's estimated that about 7% of males are color blind in some form (as compared with 0.4% of females). While a very small percentage don't see color at all, the most common form of
Geography Teachers' Association of Victoria Inc. (GTAV)'s insight:
Creating maps for those who find conventional maps difficult.
|


