

 Your new post is loading...

Follow, research and publish the best content
Get Started for FREE
Sign up with Facebook Sign up with X
I don't have a Facebook or a X account
Already have an account: Login

Geography SKILLS and ICT
4.5K views |
+0 today
Follow
Filter by date
Tags


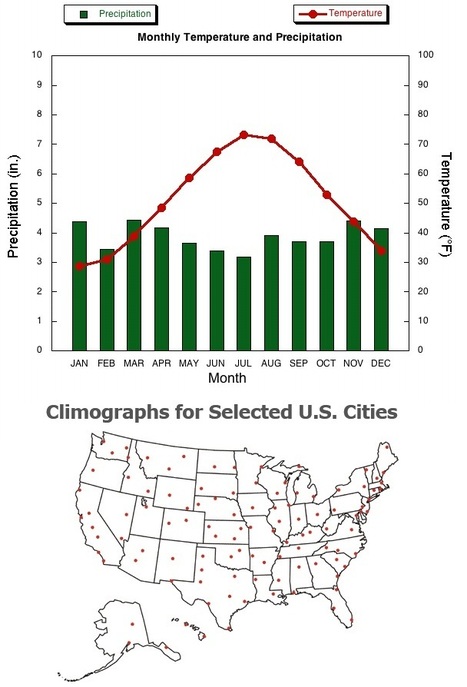
Climographs are used to show the temperature and precipitation within an area monthly. This collection of data allows us to see the climate changes that occur monthly with in an area to better understand its weather patterns.