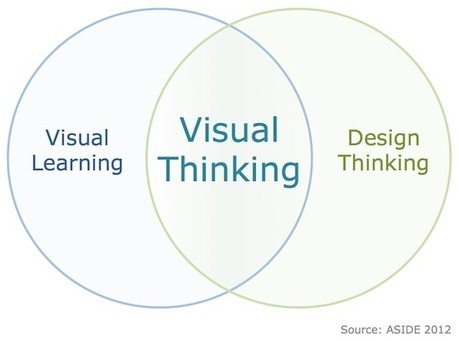
What is "the value of illustrative lessons and design-based investigations...using one's visual imagination to approach educational problems (whether historical, literary, mathamatical, or scientific) can yield tremendous dividents in student collaboration and engagement."
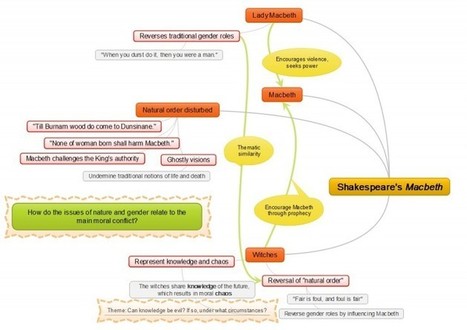
This post explores visual thinking with an excellent video by Sean Kelly called "Visual Thinking: Writing with Pictures" (which is worth the 3 minutes it will take to watch it). As always there are great resources, in this case looking at mind mapping. And to show both sides of this story you will also find a link to an article 'Data Visualization: It's Pretty, But Is It Useful?'
A great post to gather ideas about visual thinking!


 Your new post is loading...


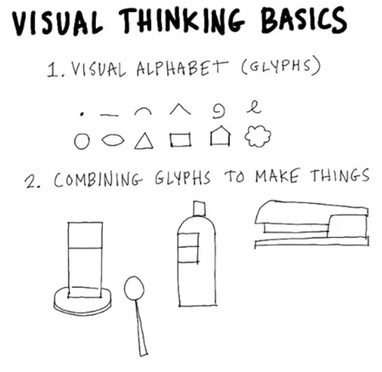


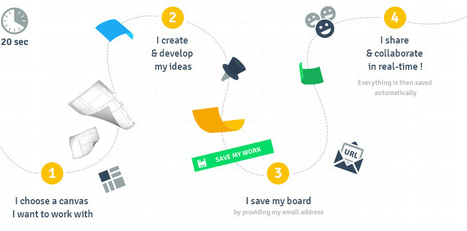


Sketch notaking is just one way!
Thx Beth Dichter