

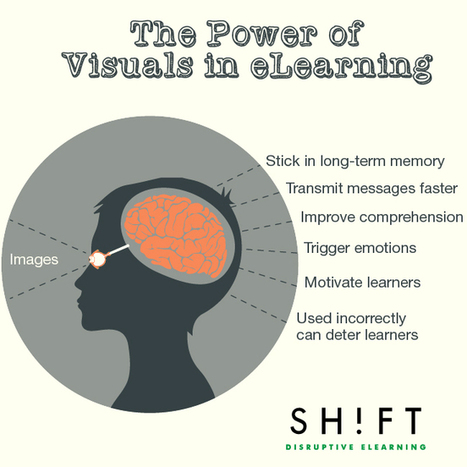

"We are now in the age of visual information where visual content plays a role in every part of life. As 65 percent of the population are visual learners, images are clearly key to engaging people in eLearning courses."
Get Started for FREE
Sign up with Facebook Sign up with X
I don't have a Facebook or a X account


 Your new post is loading...
 Your new post is loading...
Your new post is loading...
"We are now in the age of visual information where visual content plays a role in every part of life. As 65 percent of the population are visual learners, images are clearly key to engaging people in eLearning courses."
Beth Dichter's insight:
Visual learning is an important component of how our students learn today. Although this post focuses on eLearning, it is also an important tool to use effectively in a face2face environment. This post discusses six areas where visual make a difference, providing a number of statistics and facts. What are the areas? * Visuals stick in long-term memory * Visuals transmit messages faster * Visuals improve comprehension * Visual cues trigger emotions * Visuals motivate learners * Incorrect use of visuals can also deter learners Learn more about each of these areas by clicking through to the post. 
|
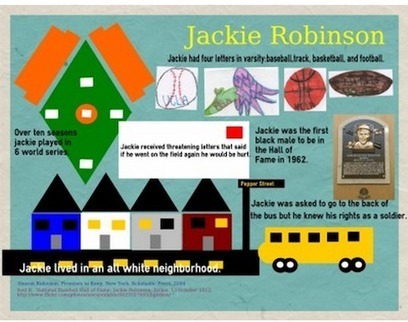
This past weekend, my step-daughter Emily, who works in the field of non-profit fundraising, asked me out of the blue, "Do you you ever teach your students about infographics?" I beamed with pride as I showed off my students' hard work.
Beth Dichter's insight:
In this post learn how a teacher took a project where students created an infographic on a non-fiction book and took it from being a "nice digital poster" and observed students whom had finished early poll their classmates and create infographics that included their new results. To quote from the post "These students had made a leap of understanding I hadn’t asked for: the images on an infographic were meant to convey data and information with the powerful impact of visual design." Read the post to learn about the process that followed and how you might have your students create infographic in your classroom for an assessment.

The Rice Process's curator insight,
January 25, 2014 11:50 AM
Infographics can be an effective assesment across the board. |


Visual learning is an important part of learning in any platform.
Now we need powerful visual creators of contents for education.
MULD