


Research and publish the best content.
Get Started for FREE
Sign up with Facebook Sign up with X
I don't have a Facebook or a X account
Already have an account: Login

Eclectic Technology
224.6K views |
+1 today
Tech tools that assist all students to be independent learners & teachers to become better teachers
Curated by
Beth Dichter
 Your new post is loading...
 Your new post is loading...
Your new post is loading...

"It’s an apps world, the web just lives in it, that’s according to the infographic, which charts the history of some of the most popular apps in the world."
Beth Dichter's insight:
Are mobile devices taking over? Will apps rule over web tools? This infographic provides lots of information about where things stand in this new mobile world. * Statistics on the mobile devices, including the number of devices worldwide, the number of SmartPhones, time spent on the Internet and much more! * The largest app stores * Messaging apps used worldwide * The most popular apps * Time spent on mobile apps * Most popular app categories * App predictions Plus they include references! 

Nuno Magalhães Ribeiro's curator insight,
July 30, 2014 5:39 AM
As apps mais populares para os 3 grandes sistemas operativos mobile: uma representação gráfica muito interessante da respetiva evolução. vale a pena analisar!

"A new global report (pdf) by the Organization for Economic Cooperation and Development finds that Americans rank well below the worldwide average in just about every measure of skill. In math, reading, and technology-driven problem-solving, the United States performed worse than nearly every other country in the group of developed nations."
Beth Dichter's insight:
The statistics in this report are eye-opening. It shows that Americans have trouble with words, numbers and technology-driven problem solving. In all areas "the United States performed worse than nearly every other country in the group of developed nations." This post provides five graphs: * Literacy Proficiency Among 16 - 65 Year Olds * Numeracy Profiency Among Adults * Profiency in Problem Solving in Technology-Rich Environments Among Adults * Profiency in Problem Solving in Technology-Rich Environments Among Young Adults * Problem Solving Profiency Among Younger and Older Adults You will also find a link to the full report from the OECD (which is 466 pages in length) so if you want more information it is readily available.
Let's talk about the power of visual communication and the age of infographics. Here's why infographics are so appealing and popular.
Beth Dichter's insight:
The statistics in this video appear to be accurate to me based on an infographic that was published earlier this year. You can find the infographic with commentary by Mark Gleeson on this Scoop.it (search infographic and look for July 2013) or you can go directly to his post for more information at http://mgleeson.edublogs.org/2013/07/14/2760/.

Ruedi Grob's curator insight,
August 2, 2013 6:22 AM
Visuelle Reize sollten vermehrt und besser genutzt werden! 
Sue Alexander's curator insight,
August 3, 2013 11:09 PM
Great information about the power of visual communication. Artists since the dawn of man have known and used this power; technology raises the bar. 
Kimberly House's curator insight,
August 11, 2013 7:30 AM
Tap into the power of visual learning! I love infographics and I'm happy that they are becoming more and more plentiful and easier to find.
Google today updated its Inside Search site, its homepage for all things search, with a handful of educational and interactive features that explain in layman's terms how Google's Search works.
Beth Dichter's insight:
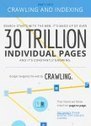
Have you wondered just how Google performs a search? If so you are in luck because Google has added a new feature on their Inside Search page which walks you through the steps taken when you type in a search term. Some of the statistics provided are amazing. "Did you know the web had over 30 trillion pages, by the way? Or that Google supports over 100 billion searches every month? Or that Google’s index is over 100 million gigabytes?" Much more information is available in this post, or you may go directly to Google Inside Search: http://www.google.com/insidesearch/tipstricks/.

Project Tomorrow is a national, education nonprofit organization. Our vision is to insure that today's students are well prepared to be tomorrow's innovators, leaders and engaged citizens of the world.
Beth Dichter's insight:
Have you wondered what students views are on digital learning? Not just the students in your school but students from across the U.S.? For Digital Learning Day a survey was conducted and some of the results have been published. This post provides a top ten list of students views on digital learning. Below are a few of the points, but additional information is available (including statistics) if you click through. 1. Use the Internet to help with homework at home? 2. Learning any time, any place, any pace. 3. What do kids think about flipped classrooms? 4. Pixel or print, what is your reading style? Take these questions into your classroom and see if your students agree or disagree with the survey findings.

's comment February 7, 2013 6:01 AM
I really like this article, because it confirms for me that the programs and support we offer on eduPLEX is based on pedagogies that reflect the K-12 student's views on digital learning.
Thanks for the web-site. It's fascinating!
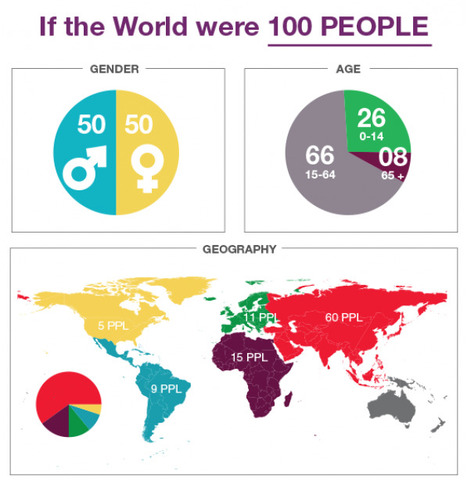
What would the world look like if there were 100 people? This infographic provides a look at gender, age, geography, religion, first lanaguage, literacy, education, and living conditions. If you want additional information visit 100 People: A World Portrait - A Global Information Toolbox at http://www.100people.org.
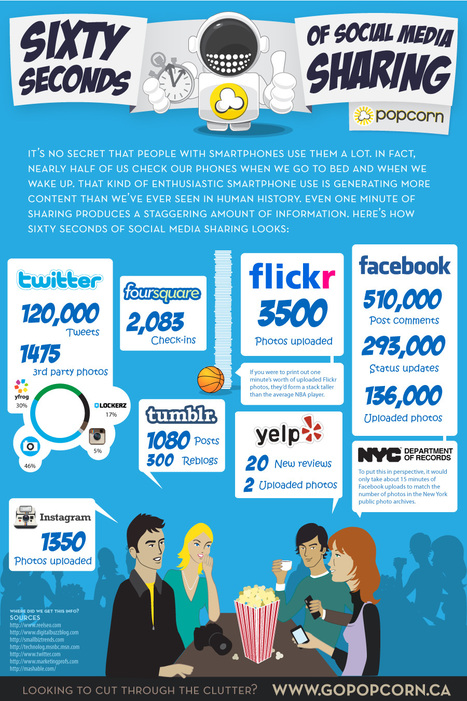
Check out the 4th version of the series "Social Media Revolution" by Eric Qualcom. The statistics included are pretty amazing, and their is a post about the video titled '10 Social Media Statistics That Will Blow Your Mind' that shares a few pieces of information in this video. You can read it at http://socialtimes.com/social-media-statistics_b109779.

Gaming in the classroom as a teaching tool is gaining popularity; however, some question whether or not it's actually effective. This infographic looks at some of the information that is known about video games. After a quick look at some statistics the infographic looks at benefits and concerns about video games and provides some resources.

Ryan McDonough's curator insight,
July 7, 2014 5:55 PM
Covering the pros and cons of gaming, at least in the minds of some educators. I've covered the pros in depth here, so I'll review the concerns here. Some feel like violence in games can be a poor influence on impressionable children. Opponents claim that kids play games at home so why should they play them at school? Difficulty monitoring online activity; funding and resource allocation are also major reasons some are apprehensive over video games in school. Do I personally agree with them? No. But I was also raised in an environment that nurtured my love for gaming. Some of these questions should merit constructive conversations at the next faculty/staff meeting. 
Pandawami29's curator insight,
October 31, 2014 11:49 AM
This little chart shows us the pros and cons of using video games for educational purposes. Also the background is from the mario games.
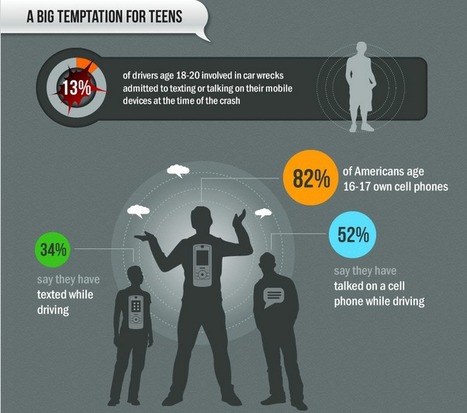
"It doesn't take a rocket scientist to know that texting and driving is dangerous. But plenty of people continue to do it. Most troubling: even with all the stories of tragic car accidents happening as a direct result of distracted driving, teens and adults are still texting at the wheel. One teen from Idaho totaled two cars in the span of about a year, texting at the time of both crashes. The infographic below is full of reasons why an OMG or LOL is never worth the risk."
![How Much Digital Clutter do you have in your Life? [INFOGRAPHIC] | Eclectic Technology | Scoop.it](https://img.scoop.it/85mhmzYIbndg9V0-xLTgiDl72eJkfbmt4t8yenImKBVvK0kTmF0xjctABnaLJIm9)
From
mashable

How much digital clutter do you have in your life? Using statistics from more than twelve sources, including Pew Research Center, ComScore, the Wall Stree Journal and more, this infographic looks at "on just how much digital space we use and whether it’s more than we need."
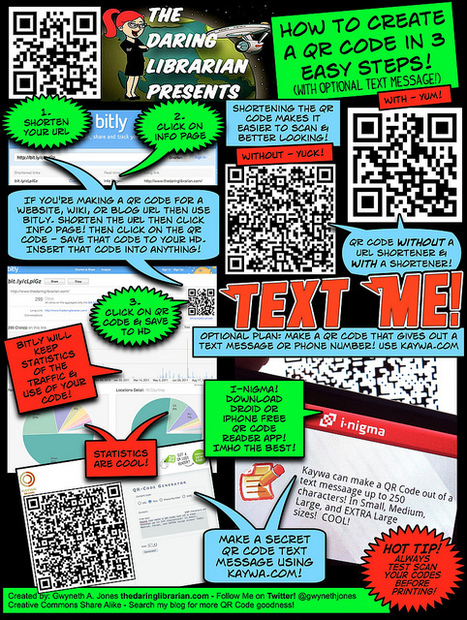
Learn how to create a QR Code...use Bitly to save the QR Code and use it...and that you may find aggredated data on the code (through Bitly)...start thinking about how you might use QR codes in your classroom.
|
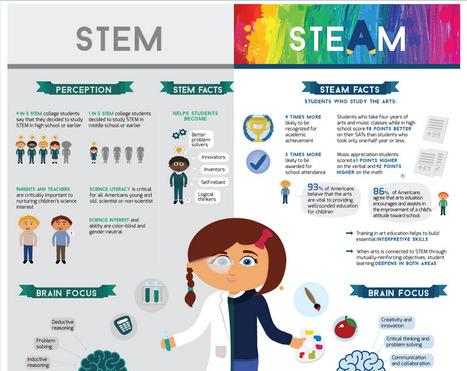
"Science, technology, engineering and mathematics are the center of attention in most US public schools today. The focus on STEM fields was initiated to increase global competitiveness and the project does have its merits. However, it has left the arts languishing far off in the periphery. This is quite unfortunate, as art education is known to improve academic performance."
Beth Dichter's insight:
Have you noticed that STEM has transformed to STEAM? The A stands for art and this infographic looks at how the introduction of art to STEM can make a difference in the academic performance of students. The infographic shares statistics on the perception of STEM and facts about both STEM and the Arts. It looks at how each impact the brain and also statistics about the number of schools with arts (US only) as well looking at US STEM rankings and global arts education. There is a reason that STEM is shifting to STEAM and this infographic provides an overview of some of the reasons this is taking place.
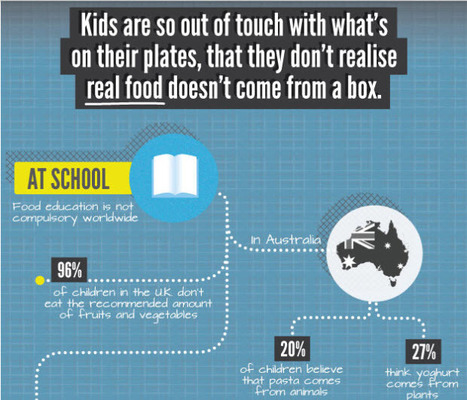
This image takes a look at how important it is to educate kids about food choices and eating healthy. So many kids don't know that real food doesn't come out of a box. Keep reading to learn more.
Beth Dichter's insight:
It is amazing how little many students know about food. This infograhic shares statistics from across the world and some may come as a surprise. How often do Americans eat fast food? Does yoghurt come from plants? These questions and many more are answered in this visual. Take some time to explore this post and see if you could create a lesson or two to help our students why and how to make better choices when choosing what to eat.

You know that bumper sticker that says, “If you can read this, thank a teacher”? It’s the literal truth. While most of us spend more time thinking about reality TV stars and pro athletes, teachers are among the few people who truly affect our ...
Beth Dichter's insight:
There are days when we ask ourselves why we teach...and this infographic shares lots of reasons for why we teach and how we impact our students...so as a visual to share, or one to look at you when you need some building up.

Tiziana Iozzi's curator insight,
September 11, 2013 1:37 AM
Un insegnante ha il ruolo di un mentore, è un modello, sa aiutare i ragazzi nelle difficoltà e li incoraggia a seguire i loro sogni... A chi di voi è capitata la fortuna di conoscerne almeno uno/a nella vita? 
Darleana McHenry's curator insight,
September 11, 2013 11:56 PM
I had the opportunity to tell my first grade teacher thank you 5 years ago. She actually had kept my first grade picture all these years. My teachers were great and school was my favorite place and I excelled there. So thanks to all the teachers that I did not get to thank. :-) 
Silvia Nascimento's curator insight,
August 6, 2015 9:22 PM
There are days when we ask ourselves why we teach...and this infographic shares lots of reasons for why we teach and how we impact our students...so as a visual to share, or one to look at you when you need some building up.
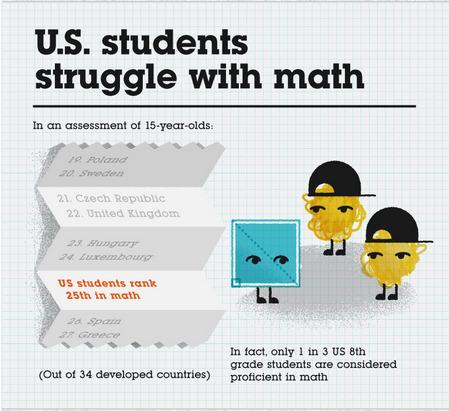
"Whether you love it or hate it, if you’ve partaken in the American school system, there’s no doubt that you’ve studied math in a wide range of forms and subjects. From algebra to geometry to the rigor of calculus, math is something that is a part of the average student’s life from kindergarten to college."
Beth Dichter's insight:
This infographic explores math in America. Did you know that 1 in 5 Americans is "functionally innumerate"? What does this mean? Sixty-two million Americans cannot do basic math such as adding fractions, working with measurement or doing whole number problems. Learn about how other countries compare to the U.S., how the U.S. compares to Singapore and South Korea in terms of "high achiever", what happens when we "hate" math, and what could be done to help the next generation succeed in math.
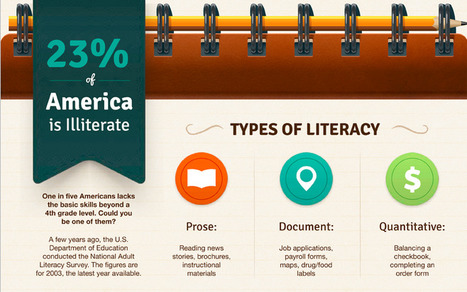
Beth Dichter's insight:
Approximately one in five Americans is illiterate, which is defined as lacking "the basic skills beyond a 4th grade level." This infographic explores this issue in some detail, beginning with definign the types of literacy as: * Prose - reading news, stories, instructional materials * Documents - forms such as job applications, maps, food labels * Quantitave - balancing a checkbook, ordering items From there it goes on to explore American's Literacy Levels (of which there are five). It probably will come as no surprise to learn that 50% of people at Level 1 (the most basic skills) live in poverty, but many other statistics are also found in this infographic. Additonal sections include a closer look at illiteracy, and the consequences of illiteracy. This infographic makes me wonder how many of the children that we see struggling with literacy at school may have other family members who have similar issues.
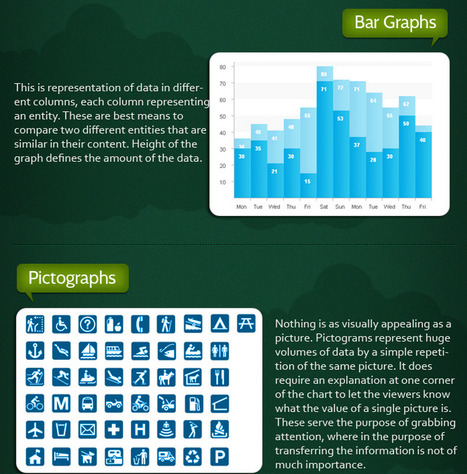
"Graphs are a visual treat, as they can present complex information in a quick and easy manner. Mostly graphs are used to reveal a trend, compare statistics or they can be even used to establish relationship between two different variables."
Beth Dichter's insight:
A great infographic that allows you to quickly compare a variety of graph types, as well as explanations about each type of graph.
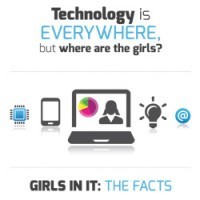
An infographic from the National Center for Women & Information Technology that provides statistics on how women/girls are represented in information technology. Some of the numbers: * The US Department of Labor estimates that by 2020 there will be more than 1.4 million computing-related job openings. At current rates, however, we can only fill about 30% of those jobs with U.S. computing bachelor's grads. Girls represent a valuable, mostly untapped talent pool. If you would like more detailed information check out the report at: http://www.ncwit.org/sites/default/files/resources/girlsinit_thefacts_fullreport2012.pdf.

Pew Research has just published a study that looks at how teens do research in the digital world. They survey was done "in collaboration with the College Board and the National Writing Project." Below are a couple of the key findings (quoted). * Virtually all (99%) AP and NWP teachers in this study agree with the notion that 'the internet enables students to access a wider range of resources than would otherwise be available,' and 65% agree that 'the internet makse today's students more self-sufficient.' * Fewer teachers, but still a majority of this sample (60%), agree with the assertion that today's technologies make it harder for students to find credible sources of information. This links to the overview. If you would like to see the full report (online or download as a pdf) click on this link: http://www.pewinternet.org/Reports/2012/Student-Research/Main-Report/Part-1.aspx.

Today the U.S. is polarized, yet this post by John Merrow states "I have found something that unites Republicans and Democrats: neither party talks about poverty, despite our current epidemic of child poverty and its consequences for the life chances of millions of children." Merrow continues to discuss poverty, and what he describes as its "evil twin, greed" stating that "we cannot solve on in isolation." He provides a number of statistics from the National Center for Children in Poverty, including: * 31% of white children - 12.1 million - live in low-income families. * 64% of black children - 6.5 million - live in low-income families. * 31% of Asian children - 1.0 million - live in low-income families. * 63% of Hispanic children - 10.7 million - live in low-income families. When you add in American Indian and children of other races, 30 million children live in poverty. For more information on this and to learn more about "deep poverty" and "normal poverty" as well as a look at salary differentials between the typical CEO and the typical worker click through to the article. Merrow suggest that "if we backed away from greed, we would be more open to recognize the scourge of poverty and the long term threat it poses to our nation."

Àqíł Štår's curator insight,
February 25, 2014 9:11 AM
Poverty is increasing all around the world. If the world leaders do not do anything about it then it won't stop increasing. Financial assistance is sometimes not enough to get their daily needs. That is why the world leaders need to get poverty undone.
![Teachers are Heroes - They Help Shape Our World [INFOGRAPHIC] | Eclectic Technology | Scoop.it](https://img.scoop.it/3TpYF4XOXJMsp2crO5nlIzl72eJkfbmt4t8yenImKBVvK0kTmF0xjctABnaLJIm9)
From
mat
It's Friday and the end of Teacher Appreciation Week...and what better way to celebrate to find an infographic that supports the work teachers do day in and day out...so welcome to 'Teachers are Heroes.' This infographic shares information and statistics about who teachers are, what they do and how they inspire us.
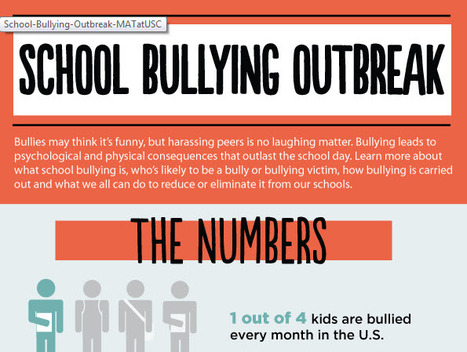
Is bullying an issue in your school? Did you know that 1 out of 4 kid are bullied everyone month in the U.S., that 1 in 10 drops out of school due to repetitive bullying? This infographic provides an eye opening look and "share facts about the methods, consequences and prentative measures related to bullies and bullied victimes in schools."

Soren Andrews's curator insight,
May 12, 2014 9:05 AM
This is a very good article because apart from having a lot of information, it has lots of pictures and statistics. Also, it uses many simple to understand pictures and charts. If you need numbers in bullying, this article is just what you need. 
Erin Ryan's curator insight,
October 24, 2015 5:53 PM
We use Olweus Bullying Prevention program in our region. It is a school and district wide effort to end bullying, promote healthy peer relationships, and to help students deal with bullying. The program teaches students through frequent class meetings. Videos and discussions are used to help students problem solve through those tough situations they encounter at school. Elementary students make pledges to their school communities in regards to not watching or letting bullying happen, treating others nicely, not talking badly about others, etc. The conversations are a bit more in depth at the middle and high school levels. The goal is to provide children of all ages with tools and strategies to help them deal with bullying, whether they are being bullied or are witnessing it. In our schools, we have yet to survey students since implementation so the impact of the program is yet to be foreseen. What is clear, is that schools must do something to proactively prevent bullying. Consequences for bullying should be clearly stated in handbooks with parents and students understanding the seriousness. 
Diamaris Rios's curator insight,
April 10, 2017 7:10 PM
although this is not a "traditional" article, it does touch base on an important topic; bullying. one in four kids are bullied every month in the US. this article contains various statistics about bullying such as prevention, consequences, methods of bullying, and so on. this gives insight on how to notice bullying and how to tackle it. statistics show that "35.5% of students believe schools can help prevent bullying". The author stood true to its title and gave tips on how to battle bullying as a teacher, Things to remind students to do when they are around bullies… Speak up against bullying. Say something like, “stop it.” Walk away. Act like you do not care, even if you really do. Tell an adult you trust. They may have ideas about what you can do. Stick together. Staying with a group might help." Sometimes it is hard to speak to someone about bullying with an adult but if teachers made themselves "friendlier" and more open, I'm sure more and more kids would open up about their struggles in school.

Unveiling the beauty of statistics for a fact based world view.

Marcelle Searles's curator insight,
August 29, 2013 5:25 PM
Students are loving this, especially those students interested in numbers, but visual learners are also more engaged. |


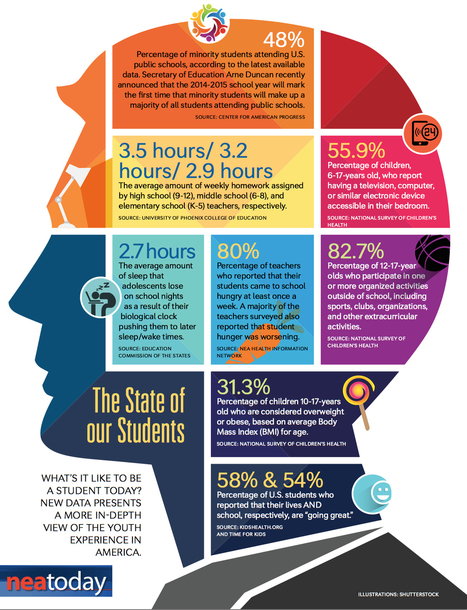
This is a fairly recent (~2 months old) view of a student today.
* Did you know that Secretary of State Arne Duncan has said that the majority of students will be minority students this school year?
* Did you know that the amount of homework assigned weekly be teachers varies from 2.9 hours in grades K-5 to 3.2 in grades 6-8 and 3.9 in grades 9 - 12?
Additional information in this infographic looks at the percentage of students engaged in after school activities; the percentage of students with a television, computer or other electronic device in their bedroom; the average hours of sleep lost by adolescents (based on their biological clock; percentage of overweight students (ages 10 - 17) and more.