

Asking the right question is more of an art form than you might imagine.
Get Started for FREE
Sign up with Facebook Sign up with X
I don't have a Facebook or a X account


 Your new post is loading...
 Your new post is loading...
Your new post is loading...
Asking the right question is more of an art form than you might imagine. 
No comment yet.
Sign up to comment
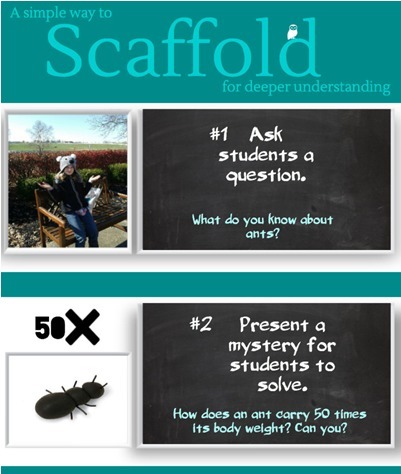
I am teaching a class where I allow the students a set amount of time to draw out what they know about a subject. Today, the students did their pre-class work, then came to class, and we began to d...
Beth Dichter's insight:
Check out this infographic which focuses on scaffolding for deeper understanding. Mia MacMeekin has provided a nine step process. 1. Ask a question. 2. Present a mystery for students to solve. 3. Ask students to draw what they know. 4. Give students ample time to research the mystery. 5. Ask students to draw the mystery and the solution again. 6. Ask students to share their drawings with other students. 7. Ask students to pull their ideas together in one drawing. 8. Teacher patiently asks what if questions. 9. If students needs more information, send them back to step #4, and start over again until the outcome or objective is reached. MacMeekin notes that her students were engaged in the drawing/scaffolding phase of this and reached a deeper understanding than other classes had. It is also important to note that the ant is actually an analogy. To learn more click through to the post.

Spice Wang's curator insight,
November 15, 2013 6:52 PM
How much time teachers would need this kind of problem-solving based scaffolding activity? When to use Thisbe kind of approach?

Here is an idea of one way to use infographics in your classroom. The specific infographic shown looks at Gross Domestic Product (GDP) and levels of English speaking citizens in a country. It appears that the higher levels of English speaking citizens, the better the GDP. Using infographics is a great way to helpe students raise questions that lead to deeper understandings. To see questions that might be raised with this specific infographic click through to the post.
|

Get kids to engage with what they’re reading on a deeper level: to ask questions about what they notice, and to answer those questions based on what’s in the text.
Beth Dichter's insight:
The Common Core require that we get students engaged with reading on a deeper level. This infographic on Close Reading is designed for students and provides suggestions for students to follow: Look for Clues, Ask Questions, Make Your Case, and Prove It. . There is also a version available for teachers that has additional details. Both may be downloaded. To find the one for teachers go to http://www.weareteachers.com/hot-topics/topics-in-education/understanding-close-reading-download-our-infographic-now

From
visual

Children can learn problem-solving skills using methods similar to the ones scientists employ to prepare them for opportunities in their professional
Beth Dichter's insight:
This infographic looks at science,specifically the value of teaching students science from a young age because of the many skills that are developed. These skills include developing questions, collecting evidence, forming decisions, constructing information and communicating. It also discusses the FERA cycle, as in: * Focus * Explore * Reflect * Apply The infographic then explores how STEM has the ability to impact her choices throughout her lifetime. This infographic was created by the Smithsonian and provides great information throughout (including a more detailed explanation of the FERA cycle).

Ruth Virginia Barton's curator insight,
February 13, 2015 11:30 AM
Excellent infographic about learning science through critical-thinking and student-directed inquiry |


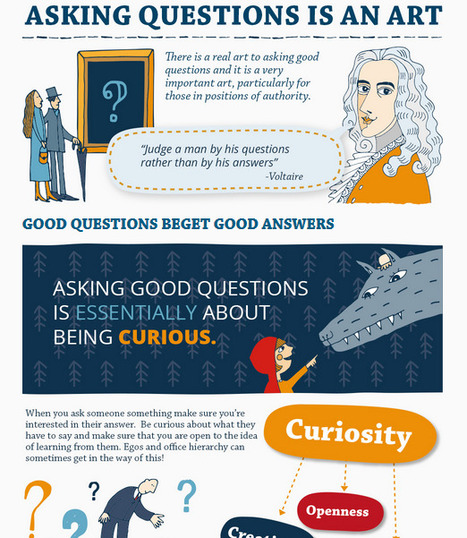
This lengthy infographic explores the The Art of Asking Questions. Areas of the infographic include:
* Wrong Question, Right Answer
* Good Questions Beget Good Answers
* The Golden Rule = No Closed Questions
* Rules were made to be Broken
- Probe
- Funneling
- Specific to Broad OR Broad to Specific
* Leading Questions
There are also four images of "Thinkers on Asking Questions." You roll over the image and see what they have to say about asking questions
This is an infographic that could lead to a great classroom discussion on questioning.