Eclectic Technology
224.6K views | +0 today
Follow
Eclectic Technology
Tech tools that assist all students to be independent learners & teachers to become better teachers
Curated by Beth Dichter
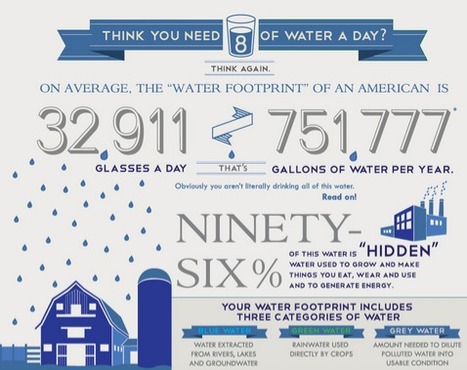
Your new post is loading...
Scooped by Beth Dichter
Scoop.it!

Ten Questions for 'Fake' News Detection

Ten Questions for 'Fake' News Detection | Eclectic Technology | Scoop.it

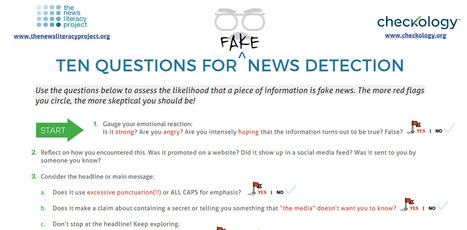
"Fake" news has been in the news quite a bit, and this infographic provides 10 questions that will help students determine if the information is 'real' or 'fake'.

And if this is of interest to you, also check out the executive summary from Stanford Evaluating Information: The Cornerstone of Civic Online Information. The summary provides examples of assessments for middle school, high school, and college students.

Scooped by Beth Dichter
Scoop.it!

Ed tech can change the world (infographic)

Ed tech can change the world (infographic) | Eclectic Technology | Scoop.it
Educational technology is making a huge impact on how students learn, how teachers teach and how education is done.
Beth Dichter's insight:

ISTE has released this new infographic that shares data on how technology in impacting our learners. It is divided into the following categories:

* Technology is changing how how students learn.

* Technology is changing how teachers teach.

* Together we're changing education - one classroom at a time.

Before clicking through to the infographic take a moment to think about how technology is used in your school or classroom. Then check out the infographic and see if these statistics surprise you. There may be some new avenues you would like to explore.

Ellen Dougherty's curator insight, August 1, 2015 11:50 AM

ISTE has released this new infographic that shares data on how technology in impacting our learners. It is divided into the following categories:

* Technology is changing how how students learn.

* Technology is changing how teachers teach.

* Together we're changing education - one classroom at a time.

Before clicking through to the infographic take a moment to think about how technology is used in your school or classroom. Then check out the infographic and see if these statistics surprise you. There may be some new avenues you would like to explore.

Scooped by Beth Dichter
Scoop.it!

Summer Learning Loss Statistics + Tips To Promote Learning All Summer Long

Summer Learning Loss Statistics + Tips To Promote Learning All Summer Long | Eclectic Technology | Scoop.it
Did you know most students lose two months of knowledge in the summer? Find more statistics and how to promote summer learning in our guide.
Beth Dichter's insight:

The summer reading slump...as teachers we know that learners will lose skills if they do not use them during the summer. This article (which includes a lengthy infographic) shares statistics about what may happen over one summer (and also shares long- term consequences).

Did you know that a learner at the end of Grade 6 whom has experienced summer learning loss over the years may be 2 years behind their peers?

Or that 2.6 months of math skills are lost over the summer?

Many schools are starting to prepare summer packets with the hope that learners will complete them over the summer. You may find that information in this infographic is worth sharing with parents. They may not be aware of the consequences of how much summer learning loss may impact their child.

No comment yet.
Scooped by Beth Dichter
Scoop.it!

Blended and Online Assessment Taxonomy Design

Blended and Online Assessment Taxonomy Design | Eclectic Technology | Scoop.it
Are you planning and communicating your feedback criteria? Here is our Blended and Online Assessment Taxonomy Design, an infographic to help you plan better assessments.
Beth Dichter's insight:

What two components are necessary for good assessments? This post states:

1. Activity or Performance

2. Feedback Criteria

Using Bloom's Revised Taxonomy the infographic looks at each level of Bloom's and provides a short explanation of the focus as well as possible assessment activities AND grading and feedback criteria.
The image (above) show the ''higher levels of active active thinking." Click through to the post to see the full infographic and more information.

Matt Vernon's curator insight, May 5, 2015 2:32 PM

Nice info graphic for Blended Model Design and think through. Just add toolsets , curated content and PD

davidgibson's curator insight, March 8, 2016 11:10 AM
Cool!
Scooped by Beth Dichter
Scoop.it!

Your Brain on Books: 10 Ways Reading Affects Psyche

Your Brain on Books: 10 Ways Reading Affects Psyche | Eclectic Technology | Scoop.it
Diving into a great novel can be an immersive experience that makes your mind come alive. Want to give your brain a workout? Open a foreign language novel.
Beth Dichter's insight:

Do your learners know what happens when the read, or when stories are read to them. This post, from the Open Education Database, provides a visual (that you may want to print out and share with learners and their families) as well as 10 ways that reading helps your brain workout. The list is below.

* We make photos in our mind, even without being prompted.

* Spoken word can put your brain to work.

* Reading about experiences is almost the same as living it.

* Different styles of reading create different patterns in the brain.

* New languages can grow your brain.

* Your brain adapts to reading e-books in seven days.

* E-books lack in spatial navigability.

* Story structure encourages our brain to think in sequence, expanding our attention spans.

* Reading changes your brain structure (in a good way)).

* Deep reading makes us more empathetic.

To learn more about each of these points click through to the post.

Kiflom Gebreyes's comment, July 28, 2018 4:41 AM
I love it
Scooped by Beth Dichter
Scoop.it!

Emotional IQ and You (Infographic)

Emotional IQ and You (Infographic) | Eclectic Technology | Scoop.it
You may be surprised by how much your emotional intelligence affects your career. If you’re getting your online MBA degree to develop your managerial and
Beth Dichter's insight:

Emotional IQ is a skill that is often mentioned as a key skill for the 21st century. This infographic shares information on emotional intelligence and is divided into a number of sections.

* What is emotional intelligence (EI)?

* Does higher EI mean improved job performance?

* Why do employers value EI over IQ?

* How EI affects your image?

* Take stock of your EI.

* Improve your emotional intelligence to improve your life

Although this infographic is geared to students in college there is information that you may find to share with students across many grade levels. Emotional intelligence plays a role in our classrooms and providing learners with more skills in this area may improve their ability to more actively participate and be engaged.

No comment yet.
Scooped by Beth Dichter
Scoop.it!

Why Handwriting Helps You Learn | Visual.ly

Why Handwriting Helps You Learn | Visual.ly | Eclectic Technology | Scoop.it

" Nowadays, it's less about putting pen to paper and more about turning on your laptop. But are we losing about by letting the art of penmanship die?"

Beth Dichter's insight:

Cursive writing? Should we teach it or not? Many states are still requiring cursive writing be taught, but it is not part of the Common Core. This infographic provides information about why it is important that students learn cursive.

Bart van Maanen's curator insight, February 21, 2015 10:17 AM

Uit onderzoek is gebleken dat leerlingen lesstof beter opnemen als ze handgeschreven notities maken. Gewoon leren schrijven en het ontwikkelen van je handschrift blijft dus van groot belang.

Kathy Lynch's curator insight, February 21, 2015 5:48 PM

Thanks Beth Dichter

Scooped by Beth Dichter
Scoop.it!

15 Ways to Beat Procrastination [Infographic]

15 Ways to Beat Procrastination [Infographic] | Eclectic Technology | Scoop.it

"Procrastination is definitely not our friend. It makes us randomly search the web, watch funny youtube videos or constantly check twitter stream instead of doing things that matter. It kills our time and leads to failure. Now it's time to beat it! Here are 15 efficient techniques to get rid of procrastination and be more productive!"

Beth Dichter's insight:

Do you procrastinate? Do some of your students procrastinate? If so, this infographic may be one you want to share. It provides 15 techniques to help you beat procrastination. Two of the techniques are listed below. Each technique includes a short description plus a how and a why. To view the other 13 click through to the post.

* Know Yourself

     How - Understand how procrastination affects your life

                Think about the habits that often cause it

     Why - Insight prevents you from feeling inadequate

                Helps you understand the causes of procrastination

* Commit to assignments

     How - List tasks that you're confident you will complete

                Make a point of crossing each task off

     Why - Rebuilds faith in your own abilities

                Commits to making good on promises

This post is geared to students in high school and college, yet you will find that many of the techniques could be shared with students in elementary and middle school.

No comment yet.
Scooped by Beth Dichter
Scoop.it!

34 Reasons Why Play Matters - Infographic

34 Reasons Why Play Matters -  Infographic | Eclectic Technology | Scoop.it

"To fly a kite you need a hearty breeze and lots of space. In a whimsical sense, humans are a lot like kites! Play gives both kids and adults the freedom and momentum to truly soar. For kids, play is a natural state that sparks learning, nurtures confidence, and builds communication skills. For adults, play provides a haven from the daily grind, inviting fresh ideas and spontaneity. For everyone, play is an ideal way to find ourselves and be ourselves! This infographic is a celebration of why play matters, gathering quotes and facts from advocates who believe in the power of play."

Beth Dichter's insight:

Do you know that when children engage in play they are also problem solving, testing out ideas, asking questions, building muscle and bone strength and much more? This infographic provides 34 reasons why play is important and includes the resources used.

As many schools continue to decrease play time and focus on teaching core subjects this may remind us that time to play is critical.

No comment yet.
Scooped by Beth Dichter
Scoop.it!

The Profile of a Modern Teacher | Wayfaring Path

The Profile of a Modern Teacher | Wayfaring Path | Eclectic Technology | Scoop.it

"One of the greatest misconceptions in education today is that certain teachers have a higher natural aptitude in technology than others.

This inspirationalgraphic sets out to disprove that notion and remind the audience that external skills are only a function of the internal dispositions that allowed them to grow."

Beth Dichter's insight:

Habits of mind are not only for students but also for teachers. This infographic provides 16 habits of mind that teachers may want to cultivate. What are your thoughts on this?

SMARTERTEACHER's curator insight, February 1, 2015 11:23 AM

The simplicity of these statements make this seem so easy, but for many teachers these concepts are difficult and scary. The transition to student focus is a difficult one for many who still believe they are the keeper of the knowledge.

Marisol Araya Fonseca's curator insight, February 8, 2015 12:35 PM

Awsome guide!

Scooped by Beth Dichter
Scoop.it!

What's It Like to Be a Student Today? (Infographic) - NEA Today

What's It Like to Be a Student Today? (Infographic) - NEA Today | Eclectic Technology | Scoop.it
Beth Dichter's insight:

This is a fairly recent (~2 months old) view of a student today.

* Did you know that Secretary of State Arne Duncan has said that the majority of students will be minority students this school year?

* Did you know that the amount of homework assigned weekly be teachers varies from 2.9 hours in grades  K-5 to 3.2 in grades 6-8 and 3.9 in grades 9 - 12?

Additional information in this infographic looks at the percentage of students engaged in after school activities; the percentage of students with a television, computer or other electronic device in their bedroom; the average hours of sleep lost by adolescents (based on their biological clock; percentage of overweight students (ages 10 - 17) and more.

No comment yet.
Scooped by Beth Dichter
Scoop.it!

Things You Never Knew About McDonald's [infographic]

Things You Never Knew About McDonald's [infographic] | Eclectic Technology | Scoop.it
Beth Dichter's insight:

Last year I used fast foods as a way to teach students graphing (and nutrition). When surveying students as to their favorite fast food restaurants McDonald's was often at the top.

This infographic provides a great deal of information that may be new to students. This infographic shows:

* Just how big McDonald's is (and the number may surprise you)

* The one location where the Golden Arches are not golden

* Where McDonald's are located (a world map with percentages of McDonald's based on area)

* The one fast food restaurant that has more locations that McDonald's

* The number of employees worldwide (as well as the number of hamburgers and customers served)

And much more.

You can have fun with maps that look at fast food locations across the US as a tool for students to learn how to interpret visualizations as well as do some calculations. One source you might check out is listed below.

* A map of all the McDonald's in the U.S. (published in 2009 and updated in 2010 at http://www.datapointed.net/2010/09/distance-to-nearest-mcdonalds-sept-2010/

No comment yet.
Scooped by Beth Dichter
Scoop.it!

The Power of the Educational Infographic

The Power of the Educational Infographic | Eclectic Technology | Scoop.it
Beth Dichter's insight:

If you have not used infographics with your class this infographic may be what moves you try them with your students. Research tells us that many of our students are visual learners, and great infographics provide information that is accessible. Mia MacMeekin provides an infographic that looks at four areas.

* What is an infographic?

* Why an infographic?

* What are the benefits?

* Can it change education
* What is the reach?

The joy of infographics is that students can also create them. Take some time to explore this post, and consider using them in your classroom.

Scooped by Beth Dichter
Scoop.it!

True Facts About Teens and Media, Now & Then (Infographic)

True Facts About Teens and Media, Now & Then (Infographic) | Eclectic Technology | Scoop.it
The meteoric rise in technology over the past three decades has completely changed the relationship between teens and media. Teens are often the first group to adopt a new technology.
Beth Dichter's insight:

How has teenagers use of social media changed over the past 20 years? Learn more from this infographic which looks at the years 1995, 2005 and 2015. Teens are often the first to adopt new technology, but their patterns have changed over the years. The infographic shares information on social life and social media over the three decades and also looks at how teens are using social media today, specifically discussing Facebook, Instagram, Twitter, Snapchat, tumblr, and YikYak.

This post may be one to share with other faculty as well as parents, and could lead to an interesting discussion with teens in your classroom.

No comment yet.
Scooped by Beth Dichter
Scoop.it!

3 Reasons Education Programs Benefit from Experiential Education

3 Reasons Education Programs Benefit from Experiential Education | Eclectic Technology | Scoop.it
Beth Dichter's insight:

Career and Technical Education programs (often called vocational schools) have their students learn by doing. Learning by doing is known as experiential learning. Why is experiential learning beneficial? Below are the three reasons described in this post.

Reason 1: Experiential education promotes positive attitudes towards learning.

Reason 2: Experiential education provides true-to-life experience that enhances career exploration.

Reason 3: Experiential education helps create more engaged members of the workforce.

Each of these reasons is discussed in the post. There is also an excellent infographic, Experiential Learning in the Classroom: Learn by Doing.

No comment yet.
Scooped by Beth Dichter
Scoop.it!

7 Brainy Ways to Boost Knowledge Retention in eLearning

7 Brainy Ways to Boost Knowledge Retention in eLearning | Eclectic Technology | Scoop.it
As instructional designers, you have to create courses that are easy to remember and difficult to forget. Here's how:
Beth Dichter's insight:

When we think of ways to boost knowledge retention in our learners, what works for students that are online also works for students in face2face classes. This post from SH!FT provides seven ways to help student retain knowledge. The visual above illustrates the concepts. The post provides additional information as well as links to

#1 - When possible, use diagrams. Many people are visual learners. Consider using graphic organizers to provide "holistic views, expressing relationships, and identifying contrasting data."

#2 - Incorporate unique and out-of-the ordinary images. Why? Images stay with us longer, and the more unique, the longer they tend to stay with us.

#3 - Dish out sensory details. The more details that engage the learner the better.

#4 - Use color therapy. Color works on many levels. Color can be used to organize, to grab our attention, and it can impact our mood.

The last 3 suggestions are below...but you will need to click through to the post to learn more about each.

#5 - Exaggerate.

#6 - Small bites, at one's own pace.

#7 - Spaced repetition.

No comment yet.
Scooped by Beth Dichter
Scoop.it!

Water Footprint of an American | The Nature Conservancy

Water Footprint of an American | The Nature Conservancy | Eclectic Technology | Scoop.it
Beth Dichter's insight:

Today is Earth Day and this inforgraphic shares information about water. Why choose water for Earth Day? Think about the drought in California and how it is impacting people, and crops. Water is seen as a finite resource (although there are scientists at work figuring out how we might be able to make water).

This infographic focuses on the US and how much water we (we being Americans) use, specifically in the following areas:

* The amount daily, not just for drinking but to "grow and make the things we eat, wear and use to generate energy."

* The top eight crops that use water

* The top eight river basins, plus what happens when the water level drops below critical levels

Additional resources are provided under the infographic. Students are fascinated by  nature, and this infographic could be used to have students think about how they use water in their household, and how your school uses water.

No comment yet.
Scooped by Beth Dichter
Scoop.it!

Flipped Learning: The Big Picture

Flipped Learning: The Big Picture | Eclectic Technology | Scoop.it
As we progress rapidly into the middle of the second decade of the 21st century, questions continue to be raised about how education addresses the ever ..
Beth Dichter's insight:

This post includes the inforgraphic (shown above) as well as additional information on pros and cons of flipping a class.

The sections in the post are:

* Flipped Learning for a Flipped World

* Flipping the Numbers

* Flipping to Engage Active Learning

* Flipping from Passive to Active

* In a Nutshell

You may find new ideas in this post that will allow your learners to be be more engaged

Elizabeth Roman's curator insight, April 29, 2015 8:44 PM

Infografía sobre el aprendizaje invertido: ¿Qué apoyo se necesita? ¿Qué se hace dentro y qué se hace fuera del aula?

Willem Kuypers's curator insight, April 30, 2015 2:45 AM

Un de plus sur la classe inversée.

Scooped by Beth Dichter
Scoop.it!

4-Components of the Theory of Action Infographic

4-Components of the Theory of Action Infographic | Eclectic Technology | Scoop.it
The Theory of Action Infographic by Carol Ehrlich …
Beth Dichter's insight:

This infographic is one resource found at this site, which also provides a detailed planning guide for Deeper Learning. Click through to the site and you will find a section on:

* The DL Learning Guide which provides a series of exercises and a set of resources that demonstrate how you can create conditions necessary for Deeper Learning.

* The User Guide an overview and framework. You will also find a Table of Contents.

* You can access each phase from this section or you can move to the  section called DL Phases.

   Phase 1 helps you Establish a Vision for Students.

   Phase 2 focuses on Understanding and Assessing the Conditions for Deeper Learning.

   Phase 3 guides you on Planning for Deeper Learning.

   Phase 4 is on Monitoring Your Plan for Deeper Learning.

If your district or school is considering Deeper Learning this is a great resource to share, or to create a focus group to explore the concept and decide if it is the right time for your building.

No comment yet.
Scooped by Beth Dichter
Scoop.it!

Nurturing the Middle School Mathematical Mind Infographic

Nurturing the Middle School Mathematical Mind Infographic | Eclectic Technology | Scoop.it

The middle school mind is…different.

As 13-year-old Logan LaPlante described in his Ted Talk Hack Schooling Makes Me Happy, “Neuroscientists say that the teenage brain is pretty weird: our prefrontal cortex is underdeveloped, but we actually have more neurons than adults, which is why we can be so creative, and impulsive, and get bummed out.” Truer words were never spoken around this subject.

Beth Dichter's insight:

How different is the mind of a middle school learner? This infographic is divided into the following sections:

* Who are middle school students?

* How do they learn?

* How can you teach to reach them?

* How can we change that statistic?

There is also a white paper that you can receive a copy of (although you will need to provide your contact information). The white paper, Nurturing the Middle School Mathematical Mind, will provide additional information.

No comment yet.
Scooped by Beth Dichter
Scoop.it!

Words, Pictures, Numbers, WOW! – 2nd Grade Infographics Attract Attention

Words, Pictures, Numbers, WOW! – 2nd Grade Infographics Attract Attention | Eclectic Technology | Scoop.it

"For the past four years, we’ve been using infographics with our students at different grade levels. This year, our second graders were studying New York City to make comparisons between its historical past at the turn of the last century with today. Instead of the typical presentation poster, they made infographics using the Easelly app."

Beth Dichter's insight:

Can 2nd graders create infographics? Based on this post from ASIDE the answer would be yes! The students were able to Easel.ly and create 8 infographics that show their understanding of New York City at the turn of the century and today. Consider trying a similar project with students in your classroom (and make sure to learn to use Easel.ly before you introduce it to your students!).

No comment yet.
Scooped by Beth Dichter
Scoop.it!

5 Tips for Helping a Student Find the Right Book

5 Tips for Helping a Student Find the Right Book | Eclectic Technology | Scoop.it
Research shows that children want assistance with finding a reading book. While your students search the stacks, here's some helpful tips for teachers.
Beth Dichter's insight:

Here are five great tips for helping students find books - a great find for librarians and for teachers in elementary school. The short hand version of the tips is below and additional information is located in the post..

1. Get to know the student

2. Experiment

3. Exposure

4. Permission to abandon the book

5. Time to look.

The visual above is not found on the site, but is found on Edutopia's Facebook page and also on Flickr.

No comment yet.
Scooped by Beth Dichter
Scoop.it!

Growth vs Fixed Mindset For Elementary Students

Growth vs Fixed Mindset For Elementary Students | Eclectic Technology | Scoop.it
Beth Dichter's insight:

The infographic above is geared to elementary students. Research shows that if we teach students about their brain, and about growth mindset and fixed mindset it makes a difference. Consider sharing this with your students and have them answer the questions. Some may find that they are holding themselves back based on their mindset. Students could share strategies that they use when they find themselves falling into areas of a fixed mindset.

Jason Smith's curator insight, July 20, 2015 8:00 PM

Great article for elementary educators

Jennifer McGuff's curator insight, August 1, 2015 4:28 PM

Good article for all educators. 

Scooped by Beth Dichter
Scoop.it!

INFOGRAPHIC: Here's Why Exercise Really Makes You Happier

INFOGRAPHIC: Here's Why Exercise Really Makes You Happier | Eclectic Technology | Scoop.it
There's a science behind why your workouts boost your happiness. Learn how to optimize your fitness routine for even more joy.
Beth Dichter's insight:

This infographic shares the science behind exercise. Learn how to optimize your workout for maximum happiness, how to have more fun with less work, motivational tips and more.

As teachers we often work long days and find it tough to get in our exercise, but if we can find the time we may find ourselves in a better place in the classroom.

No comment yet.
Scooped by Beth Dichter
Scoop.it!

Keep eLearning Readable or Don’t Bother Using Text at All

Keep eLearning Readable or Don’t Bother Using Text at All | Eclectic Technology | Scoop.it
To ensure learners get the most of your written eLearning content make your text as easy as possible to consume. These readability guidelines will help you out.
Beth Dichter's insight:

Do you know the best ways to design an eLearning course? SH!FT provides excellent resources and this post discusses readability. Learn more about:

* What makes people want to read

* The best fonts to use (think easy to read)

* How to design eLearning for readability, which includes

   - Strategies to  improve readability which includes five recommendations

You will also find an infographic that shares this information.

Mike Clare's curator insight, January 6, 2015 10:08 AM

This may be simple but do we always follow the advice given?  I know I am gulity.