


Research and publish the best content.
Get Started for FREE
Sign up with Facebook Sign up with X
I don't have a Facebook or a X account
Already have an account: Login

Eclectic Technology
224.6K views |
+0 today
Tech tools that assist all students to be independent learners & teachers to become better teachers
Curated by
Beth Dichter
 Your new post is loading...
 Your new post is loading...
Your new post is loading...
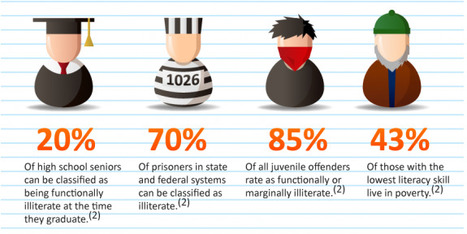
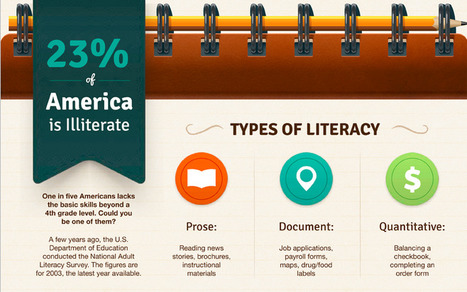
Exactly how big is America’s illiteracy problem? The Understanding Illiteracy infographic will help you actually see the scope of the problem. 
|
Beth Dichter's insight:
Approximately one in five Americans is illiterate, which is defined as lacking "the basic skills beyond a 4th grade level." This infographic explores this issue in some detail, beginning with definign the types of literacy as: * Prose - reading news, stories, instructional materials * Documents - forms such as job applications, maps, food labels * Quantitave - balancing a checkbook, ordering items From there it goes on to explore American's Literacy Levels (of which there are five). It probably will come as no surprise to learn that 50% of people at Level 1 (the most basic skills) live in poverty, but many other statistics are also found in this infographic. Additonal sections include a closer look at illiteracy, and the consequences of illiteracy. This infographic makes me wonder how many of the children that we see struggling with literacy at school may have other family members who have similar issues.

Ensuring a high level of reading literacy has become a priority of many governments around the world. However, what is often forgotten is that there is more than one type of illiteracy, and not all are addressed during formal education. This post explores 20 types of illiteracy...technological, statistical, numerical, mental health, agriculture...with an image and brief descriptions of 20 types...how many of these do we address in our current education structure?
|


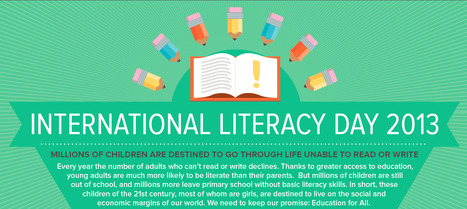
September 8th is International Literacy Day and a number of infographics are available (simply by searching). This infographic was published by UNESCO (United Nations Educational, Scientific and Cultural Organization) and it looks at the rate of literacy across the globe by gender and age (adult being defined as >15), where they live, who will be illiterate in the future, what the future holds for them and raises the question "How can we change their destiny?"
Why share this infographic? Would it help our students to know that there are many people in the world who do not have access to school, to the ability to become literate, and to know that due to that their lives will have limitations simply due to this fact? Part of being a citizen today is raising awareness in our students of what happens beyond their school, their home town, the US and what is happening across the world. We celebrate literacy with our children. Perhaps we can also make them aware that others do not share this opportunity and consider what we might do to help them.