Eclectic Technology
224.6K views | +0 today
Follow
Eclectic Technology
Tech tools that assist all students to be independent learners & teachers to become better teachers
Curated by Beth Dichter
Your new post is loading...
Scooped by Beth Dichter
Scoop.it!

How To Teach Visual Thinking – 5 Strategies From Around The Web

How To Teach Visual Thinking – 5 Strategies From Around The Web | Eclectic Technology | Scoop.it

"The misconceptions about visual thinking are alarming. On one hand, this critical skill seems integral for contemporary learning, since almost every modern input is visual in nature. Yet this key proficiency seems almost entirely absent from state standards and daily classroom lessons."

Beth Dichter's insight:

What is visual thinking? How can we teach visual thinking to our learners? ASIDE has an excellent post that provides five presentations that explore visual thinking from different perspectives. All of them share information on the "the power of visuals to craft a layered approach toward teaching with creative design." The five presentations (all from slideshare) are:

* Visual Thinking Presentation

* Visual Thinking and the Writing Process

* Visual Thinking for Brainstorming, Planning, Learning, Collaborating, Harvesting

* An Introduction to Visual Thinking

* Visual Thinking Help us to...

Each of these presentations provides a different viewpoint. Many of our learners are visual learners today. This post will provide you with great resources to help them hone the skill of visual thinking (and will also help you).

Michael Patrick Dunn's curator insight, April 7, 2015 4:24 PM

Sketch notaking is just one way!

Kathy Lynch's curator insight, April 9, 2015 7:01 PM

Thx Beth Dichter

Scooped by Beth Dichter
Scoop.it!

ASIDE: Data Visualized: Simple, Quick, And A Range Of Topics

ASIDE: Data Visualized: Simple, Quick, And A Range Of Topics | Eclectic Technology | Scoop.it

"We continually look for resources to use for “mini” lessons or “do nows” to help learners interpret data and draw conclusions through visual analysis.
The Statshot column in the weekend edition of The Wall Street Journal provides just that. David Goldenberg compiles the data, and the graphics are designed by Carl de Torres. The topics run the gamut, including pop culture, finance, technology, and science."

Beth Dichter's insight:

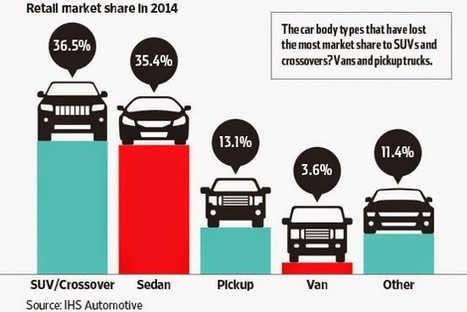
Finding great graphs to use with students is sometimes difficult. The Wall Street Journal may be the place to turn. This post shares examples of 3 graphs published in their  Statshat column.  This appears to be a new feature since the first publication is dated May 9, 2014.

These graphs will be useful for elementary and middle school. If you teach high school you may want to check out "the Numbers blog (which) examines the way numbers are used and abused,” and the topics are equally as diverse as those on Statshot."

Melissa Marshall's curator insight, August 7, 2014 11:58 PM

Here are some great graphical resources found in the WSJ! Obviously some are quite Americanised but there are some great ones you could use for a discussion on statistics, skewed data or how data is used in the media to reinforce a bias. 

Indy Home Vault, LLC's comment, October 1, 2018 10:08 PM
this is so useful article
Scooped by Beth Dichter
Scoop.it!

A Visual History - Graphic Novels In The Humanities

A Visual History - Graphic Novels In The Humanities | Eclectic Technology | Scoop.it

"Most English and social studies teachers no longer view graphic novels as simply "long comic books." The educational benefits of blending illustrations with narratives have been well established. But rarely do books come along that masterfully capture the dynamic, eye-popping power of art and history."

Beth Dichter's insight:

If our students are visual learners are there resources we can use to help make learning more interesting? How about graphic novels? This post explores 'The Gettysburg Address: A Graphic Adaptation stating:
The stunning paperback uses "Lincoln's words to tell the whole story of America's Civil War, 1776 to the present." The book is thrilling in its account of regional rifts and in its pictorial precision on each page.

An additional history book is discussed and there are links to additional resources on the value of using visuals in subjects areas. If using graphic novels is new concept for you, or if you are interested in learning more about reasons why to bring them to your classroom, this post will be helpful.

Peter Sampson's curator insight, October 24, 2013 5:35 PM

Love what well made graphic novels make possible for more visual learners.

Scooped by Beth Dichter
Scoop.it!

"What Is Graphicacy?" - An Essential Literacy Explained

"What Is Graphicacy?" - An Essential Literacy Explained | Eclectic Technology | Scoop.it

"We live in a visual world. Smartphones, television, Internet, and social media all push information in real-time, all the time. Visual media bombard us in constant streams. Learners of every age, therefore, need to understand how to analyze pictorial information. This skill of parsing images, interpreting pictures, and decoding diagrams is known as graphicacy."

Beth Dichter's insight:

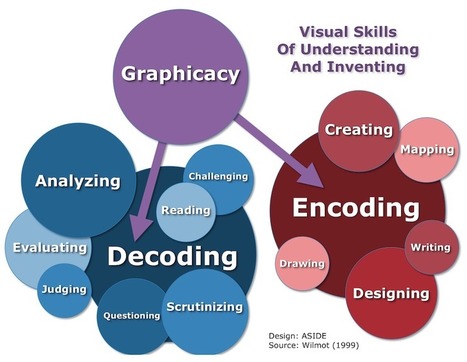
Learn more about graphicacy in this post by ASIDE. There is a short motion graphic (explainer video) that provides an overview what visual literacy is...a way to encode/decode images and the ability to analyze visual information are two components.

Research makes it clear that we have many visual learners in our classrooms (~65%). In addition "the brain processes optic inputs 60,000 times faster than text."

This post provides links to a number of articles that ASIDE has published that discuss graphicacy and provide great resources. You will also find information in ASIDE on creating infographics with students as young as Grade 2.

Nancy Jones's curator insight, March 25, 2015 12:17 PM

The whole field of visual literacy and interpretation has exploded in the last 25 years. It is time to recognize its value and teach our students not only the ability to decipher and interpret them, but to create them as well.

Kathy Lynch's curator insight, March 25, 2015 9:43 PM

Thx Beth Dichter

PitchWorx's comment, June 15, 2015 2:40 AM
amazing design
Scooped by Beth Dichter
Scoop.it!

Graphicacy - The Key To Visual Thinking In A Differentiated Classroom

Graphicacy - The Key To Visual Thinking In A Differentiated Classroom | Eclectic Technology | Scoop.it

"In the scholastic world's quest to pinpoint new "literacies," one of the most essential skills in a student's toolkit isn't new at all. "Graphicacy" is the vital proficiency with visual inputs that all learners must master in the modern classroom. Graphicacy refers to the encoding and decoding of images, particularly in the close examination of details that construct visual meaning. It stands with literacy, oracy, and numeracy as one of the four indispensable corners of education."

Beth Dichter's insight:

In education we talk about a variety of literacies, and one that comes up more often today is visual literacy, which may also be referred to as graphicacy. This post explores this concept providing a historical perspective as well as links to a number of excellent resources.

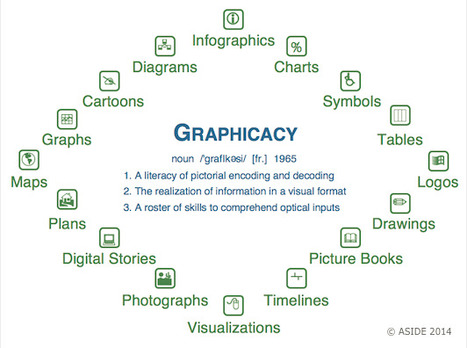
There are also many visuals with the post, including the one above that looks at the many forms of graphicacy that we see in our classrooms (and provides a number of definitions). Many of these forms may be created by students using technology.

There is also a short video, To Understand is to Perceive Patterns, that looks at how patterns in nature are repeated.

No comment yet.