Eclectic Technology
224.6K views | +0 today
Follow
Eclectic Technology
Tech tools that assist all students to be independent learners & teachers to become better teachers
Curated by Beth Dichter
Your new post is loading...
Scooped by Beth Dichter
Scoop.it!

Three Ways To Look At The World As A Village

Three Ways To Look At The World As A Village | Eclectic Technology | Scoop.it

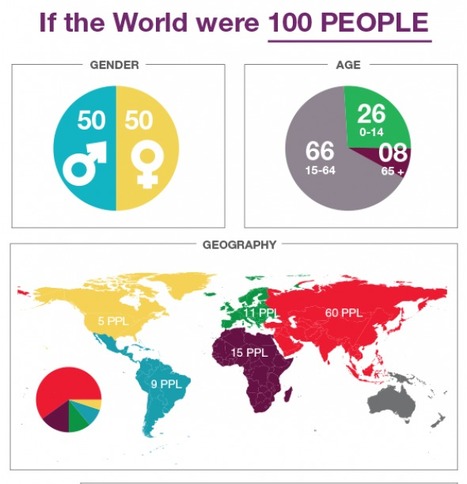
"A couple of days ago I read an article by Ryann Warlickabout an infographic displaying the world as 100 people. I've seen infographics like this before and you probably have too. Ryann used the infographic as the basis for helping students think about identifying people that they can help. I encourage you to read the short article."

Beth Dichter's insight:

Richard Byrne provides three infographics that look at how one might view the world as 100 people. Why choose three infographics? We have many different learners in our classrooms and what works for one may not work for another...thus three infographics. You might use them to launch a discussion on how we perceive information or use them when teaching students about infographics and have them consider which they find best illustrates the information and discuss why it does. 

No comment yet.
Scooped by Beth Dichter
Scoop.it!

5 Great, Easy to Use Tools for Infographics

5 Great, Easy to Use Tools for Infographics | Eclectic Technology | Scoop.it

"Tools for Data Visualization
One of the most frequent questions I get is “How can I start creating infographics? Where to start?”. Well, this article is exactly about “Where to start”, as as well as how to get inspired and how to start experimenting with visual-based data.
If you are worried that creating an infographic will be too hard, you should be pleasantly surprised by these tools. All of them pretty much do the work for you, and yet the end result is professional looking."

No comment yet.
Scooped by Beth Dichter
Scoop.it!

10 Fun Tools To Easily Make Your Own Infographics | Edudemic

10 Fun Tools To Easily Make Your Own Infographics | Edudemic | Eclectic Technology | Scoop.it

There are so many tools now available to help you make your own infographic, and this post shares information on ten tools that will help you visually represent data. For each tool a short description is provided as well as a visual. The tools discussed are: Visual.ly, Dipity, Easel.ly, Venngage, Infogr.am, Tableau Public, Photo Stats (for iPhone), What About Me? (create an infographic about your digital life), Gliffy, and Piktochart.

Ten great tools that will allow you to create (or have your students create) infographics for this school year!

No comment yet.
Scooped by Beth Dichter
Scoop.it!

Infographics & Data Visualizations | Visual.ly

Infographics & Data Visualizations | Visual.ly | Eclectic Technology | Scoop.it
Like infographics and data visualizations? Visual.ly is the world's largest community of dataviz and infographics. Come explore, share and create.
No comment yet.