


Professional infographic designers rely primarily on a core vector graphics software program to cr...
Get Started for FREE
Sign up with Facebook Sign up with X
I don't have a Facebook or a X account


 Your new post is loading...
 Your new post is loading...
Your new post is loading...
Professional infographic designers rely primarily on a core vector graphics software program to cr...
Beth Dichter's insight:
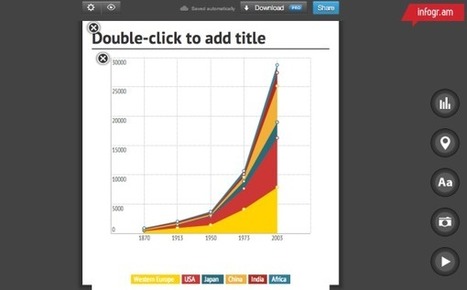
Here is an up-to-date review of five tools that allow you to create infographics. Each tool is described. There is a list of pros and cons for each tool. All have free versions available, and some have more robust versions that cost additional money. The five tools that are discussed are: * Visme * Canva * Easel.ly * Piktochart * Infogr.am Providing opportunities for students to create infographics allows them to create graphs, use a different style of writing, and have some fun while showing that they understand key concepts and ideas. 

Hello, World! Lots of my friends have been asking me how I make the infographics. I find it very simple. But, I admit that that simple mindset is after hundreds of hours playing with Piktochart. I ...
Beth Dichter's insight:
If you are thinking of creating an infographic using Piktochart you might want to check out this infographic that walks you through the steps by phases which include: * The Research Phase * The Design Phase, where you have to select either a Pikto theme or to do it from scratch (and your choice will determine some of the options available) * Other Exciting Information This is a great overview/guide that you may want to share with students if they are doing a project that involves creating an infographic.

Marteana Davidson's comment,
September 8, 2013 9:41 PM
I'm going to try this with my production report on hour my facility is used each year!

Piktochart's comment,
September 26, 2013 2:15 AM
Hi Kimberly! Thanks for thumbs up!
Also we ask teachers to fill a survey that could help us to improve. Maybe you could find a few minutes to fill it yourself and pass to other teachers who use it? Thanks! ow.ly/oJahy

CREATE ENGAGING PRESENTATIONS Piktochart easily creates WOW presentations out of your data.
|
"This past week I taught a few classes on infographics and decided to update the page by adding a section called "Teaching With Infographics". It is important for your students to make sure that they evaluate any infographics they are using, by making sure the author/creator has cited their references. Misinformation on the web exists. Have students read these tips to make a better infographic."
Beth Dichter's insight:
The Media Specialist has recently updated her information on teaching with infographics. This post provides many great resources including a post on tips to make better infographics, an in-depth video on teaching with infographics, a series of videos that detail how to use Piktochart to create infographics, and many other resources. If you are considering having students create infographics check out this post for resources.

The Rice Process's curator insight,
February 9, 2014 10:35 AM
Very helpful and great tips to follow. 
Claudia Estrada's curator insight,
February 23, 2014 2:56 PM
Working with info graphics has become an important skill now a days because new generation reads better images with less text. Helping students to become good users of it is developing 21st. century learners.

There are so many tools now available to help you make your own infographic, and this post shares information on ten tools that will help you visually represent data. For each tool a short description is provided as well as a visual. The tools discussed are: Visual.ly, Dipity, Easel.ly, Venngage, Infogr.am, Tableau Public, Photo Stats (for iPhone), What About Me? (create an infographic about your digital life), Gliffy, and Piktochart. Ten great tools that will allow you to create (or have your students create) infographics for this school year!
|


Who doesn't need these tools?