
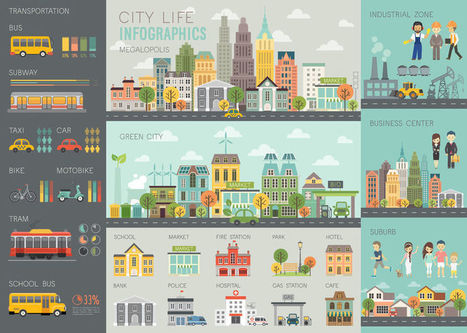

Over the last 5 years, the popularity of infographics in marketing has continued to climb. Thinking of creating one? Read these helpful tips
Via janlgordon, massimo facchinetti
Get Started for FREE
Sign up with Facebook Sign up with X
I don't have a Facebook or a X account


|
digital marketing strategy
Think | Visualize strategic marketing planning Curated by malek |
 Your new post is loading...

|
Rescooped by
malek
from Content Creation, Curation, Management
April 7, 2017 7:05 AM
|
Over the last 5 years, the popularity of infographics in marketing has continued to climb. Thinking of creating one? Read these helpful tips
If a picture paints a thousand words, these tools will turn yours into masterpieces and quickly boost your results in social media...
|
|
Rescooped by
malek
from Digital Brand Marketing
May 3, 2015 6:01 AM
|
30 Ecom Strategies & Tactics To Master
No wonder most ecommerce teams feel overwhelmed. Off the top of our heads we came up with 30 complex "mini-systems" that must be mastered to create greatness in online commerce.
Gone are the days when a little of this and that could win the day in online retail. Today all 30 of these tactics and strategies dance together requiring sophisticated understanding of individual trends, tools and ideas to win.
Things change too fast to really KNOW anything. Instead teams must surf waves, learn and fail fast and then wax up their boards for another wild ride.
Did we miss any BIG IDEAS your ecommerce team is managing. Soon we will support this infographic with a http://www.Curagami.com post to further explain each strategy and tactic. In the meantime let us know what we missed in comments or email martin(at)Curagami.com.
Thanks and remember DEEP SLOW BREATHES and if you aren't having FUN your visitors will know. They will feel it.

Do you have what it takes to be a master of online commerce?
|
|
Rescooped by
malek
from LinkedIn Marketing Strategy
March 4, 2014 9:22 AM
|
![10 Ways Real Brands Spiced Up Their LinkedIn Banner Images [SlideShare] | digital marketing strategy | Scoop.it](https://img.scoop.it/jHelJCecn3BruO6iHhHnNzl72eJkfbmt4t8yenImKBVvK0kTmF0xjctABnaLJIm9)
Want your LinkedIn Company Page to stand out from the crowd? Check out these ideas for creating a better banner image.

Good discussion of how to improve Linkedin company banners. See an example of the banner, above. Also check the embedded Slideshare with more examples.
If you like this scoop, would you consider a thumbs up or share?

You *ARE* using a LinkedIn banner image, right??? Wait, you haven't even bothered to put anything up, let alone something 'spicy??
|
|
Scooped by
malek
February 25, 2014 2:25 PM
|
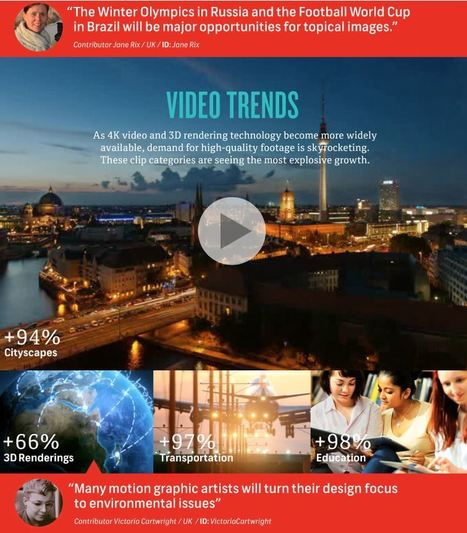
For our third annual infographic, we use data from our 350 million all-time
downloads to explore recent and emerging trends from around the globe.
@Martin (Marty) Smith (a no-designer) had a great summary here.
So inspiring, I had to go for the full infographic, a real gem.
Check popular search, learn about Gatsby, appetizing and adorable in a completely different mind frame.
|
|
Rescooped by
malek
from Curation Revolution
February 21, 2014 6:47 PM
|
![Piktochart Infographic & Graphic Design Tool for Non-Designers [Scenttrail Review] | digital marketing strategy | Scoop.it](https://img.scoop.it/YDxe5RnD3E3XjwnXCuUTMDl72eJkfbmt4t8yenImKBVvK0kTmF0xjctABnaLJIm9)
Piktochart is an easy infographic design app that requires very little effort to produce simple and high quality graphics. Create free infographics here.
Marty (@Scenttrail) Review
I used Piktochart yesterday to create an infographic to support my 5 Easy Email Marketing Tips (http://sco.lt/7T6pTF ). I am NOT a graphic designer, but I found Piktochart helped me think like one.
Creation of my first "infographic", and I put infographic in quotes not to offend any true infographic pro, took about two hours. Piktochart's User Interface is excellent, intuitive and drag and drop friendly.
At first I tried to do everything IN Piktochart. Then I noticed they have a robust import tool so I created a draft in the tool, took a screen shot, sized the screen shot up to their 600 x 400 and worked on it in photoshop.
Piktochart, if you are reading this, you may want to make an export tool that is as easy to use as your import tool. If I could export a block at a time it would be ideal. Even when I was finished and published I manipulated some spacing of the infographic by selecting and moving blocks in Photoshop.
The tool comes complete with icons like the bulls eye and pad. I couldn't understand how to color my fonts (their styling options seem to not come up the way they are supposed too) so I added the text color in Photoshop and important the resulting block overlaying what was there.
My process made the graphic HEAVY since I had 2 copies of everything, so it would be great to export, work on a block in Photoshop, import it back in and then overlay on a blank canvas. The only way I can see to do that now is start over.
Creating visual support for our blog posts is so important Piktochart is a great new tool for any content marketer / blogger. Interesting to note my infographic of 5 Easy Email Tips got 3x the views and shares of my written Scoop. We know the visual marketing revolution is upon us, so getting as good as someone like Mark Smiciklas (http://www.intersectionconsulting.com/ ).
Piktochart is a great and timely tool! Highly recommended. Marty
A guided tour into Piktochart by a no-designer. You can't help but like the story behind the infographic.

|
|
Rescooped by
malek
from Content Creation, Curation, Management
June 15, 2013 7:33 AM
|

If you're looking for more ways to attract and engage learners, here are 10 tool to enhance your eLearning courses using data visualization.


I selected this article from Curatti written by Susan Gilbert because it helps you improve your visual marketing with shareable infographics.
Visual graphics can be both fun and informative for your niche audience.
Create Infographics That Grow Your Following Online
People are drawn to appealing content that grabs their attention right away. I agree that infographics can help attract more subscribers and followers.
Gilbert shows you how to create graphics that audiences are more willing to share.
Here's what caught my attention:
Selected by Jan Gordon for Curatti covering Curation, Social Business and Beyond
Featured image: 123rf.
Read full article here: http://ow.ly/x9eO30aBqyw
Stay informed on trends, insights, what's happening in the digital world become a Curatti Insider today