

Infographics have become more popular with the rise of social media, fuelling the need for instant results by providing content in bite-size chunks.
Via janlgordon
Get Started for FREE
Sign up with Facebook Sign up with X
I don't have a Facebook or a X account


 Your new post is loading...
 Your new post is loading...
Your new post is loading...
Infographics have become more popular with the rise of social media, fuelling the need for instant results by providing content in bite-size chunks. Via janlgordon
icoexist2's insight:
add your insight... 
|


This article is from Mashable and infographic created by Nowsourcing. I chose this piece because it's a continuation of the last scoops I've posted recently about turn data into something businesses can understand and utilize.
Here are some highlights:.
We are all experiencing too much information and unable to process it in a way that is useful for our business needs
**"The use of infographics helps to break down data visually, helping viewers make sense of complex information"
**What's behind the science behind an infograpic's success? Allow an infographic to explain
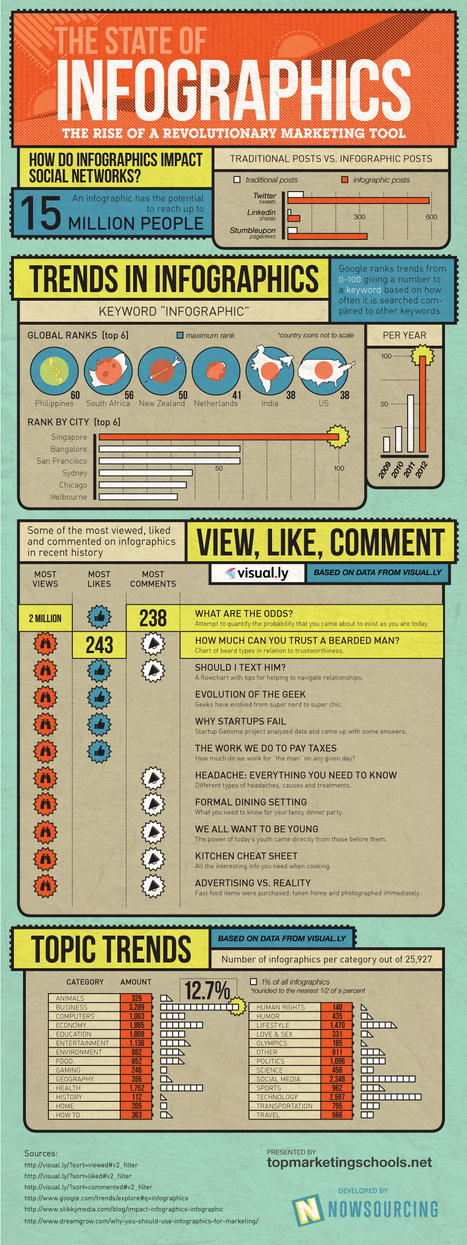
**An infographic has the potential to reach up to 15 million people
The infographic in this piece shows you
**How infographics impact social networks
**The difference between traditional posts vs. infographic posts and much more.......
Selected by Jan Gordon covering "Curation, Social Business and Beyond"
See article and infographic here: [http://on.mash.to/XKAKcQ]
An infographic on infographics and trends on visual communication. Very relevant to learning quickly and memorably. ~ Deb