


Do you want to kick your social media marketing up a notch, but you don’t know where to start? Visual content could be the answer.
Via janlgordon
Get Started for FREE
Sign up with Facebook Sign up with X
I don't have a Facebook or a X account


 Your new post is loading...
 Your new post is loading...
Your new post is loading...
Do you want to kick your social media marketing up a notch, but you don’t know where to start? Visual content could be the answer. Via janlgordon 

janlgordon's comment,
November 3, 2016 10:47 AM
Thank you @Stan Smith @Ricard Lloria @Jenne & @Mehdi BH :-)
janlgordon's comment,
November 4, 2016 10:36 AM
Thank you @Antonios Bouris :-)
janlgordon's comment,
November 8, 2016 10:44 AM
Thank you @Negotei Elena :-)
Sign up to comment
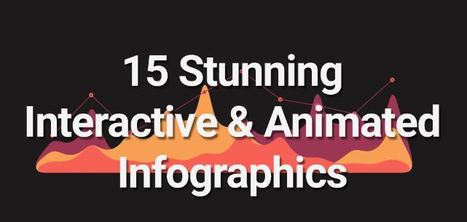
A hand-picked list of animated and interactive infographics that incorporate innovative and impressive design elements, motion graphics and effects. Via Baiba Svenca

Baiba Svenca's curator insight,
February 14, 2016 7:39 AM
If you want to make your presentations more attractive, include infographics. Or present infographics alone.
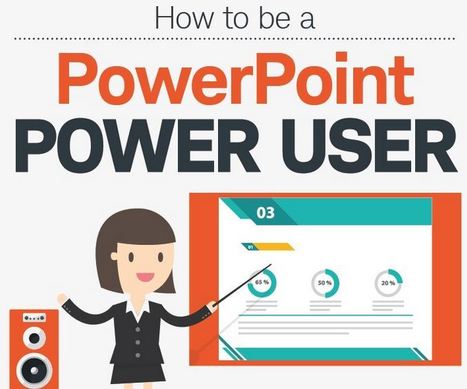
Got a presentation to prepare for? Want to avoid 'Death by PowerPoint'? Then read on, we've polled some PowerPoint experts for their tried and tested PowerPoint tips. You'll even discover how to partner PowerPoint with best of breed presentation productivity apps to ensure you are prepared for any occasion. Via Baiba Svenca
icoexist2's insight:
A great infographic - 7 tricks to help you become an expert user of PowerPoint.
Baiba Svenca's curator insight,
November 22, 2015 4:36 AM
A great infographic - 7 tricks to help you become an expert user of PowerPoint. 
Wendy Zaruba's curator insight,
February 2, 2016 10:27 AM
More great tips for using PowerPoint, check them out!
Baiba Svenca's curator insight,
December 14, 2014 2:17 AM
9 steps how to create infographics, well-presented and concise. Thanks for the suggestion to Payman Taei.
![Piktochart Infographic & Graphic Design Tool for Non-Designers [Scenttrail Review] | Communicate...and how! | Scoop.it](https://img.scoop.it/YDxe5RnD3E3XjwnXCuUTMDl72eJkfbmt4t8yenImKBVvK0kTmF0xjctABnaLJIm9)
Piktochart is an easy infographic design app that requires very little effort to produce simple and high quality graphics. Create free infographics here. Via Martin (Marty) Smith

malek's curator insight,
February 21, 2014 6:47 PM
A guided tour into Piktochart by a no-designer. You can't help but like the story behind the infographic. 
's comment February 22, 2014 5:35 AM
I had built my visual online CV on this and I'm a no-tech no designer guy, was very easy to create still, thank you for sharing
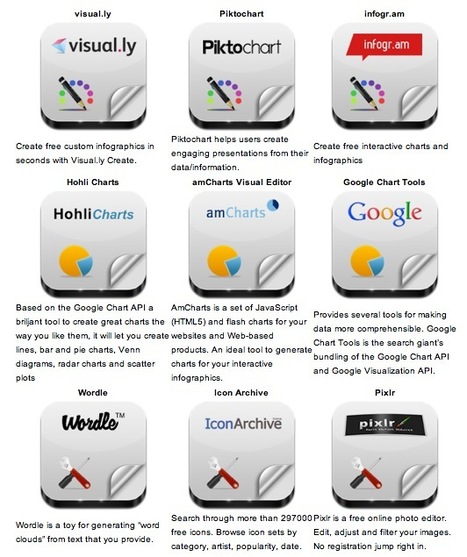
Robin Good: Here is a handy short guide to nine free infographic creation tools that can be utilized to create enticing visuals, word charts and data-based infographics without having special technical skills.
Useful. 8/10
Check them all out: http://www.infographicsarchive.com/create-infographics-and-data-visualization/ ;
(Unearted by Andres Taborga) Via Robin Good, Karen Johnson

Sahana Chattopadhyay's curator insight,
May 4, 2015 11:59 PM
Infographics are great tools to present curated and focused content from a specific perspective. |

A list of visual content types you probably haven't tried yet, from cinemagraphs and progress GIFs to interactive sliders and mixed-media infographics. Via Baiba Svenca
Baiba Svenca's curator insight,
October 27, 2016 3:43 PM
Fantastic visuals + tips how to create them.
Got a presentation to prepare for? Want to avoid 'Death by PowerPoint'? Then read on, we've polled some PowerPoint experts for their tried and tested PowerPoint tips. You'll even discover how to partner PowerPoint with best of breed presentation productivity apps to ensure you are prepared for any occasion. Via Baiba Svenca
Wendy Zaruba's curator insight,
February 2, 2016 10:27 AM
More great tips for using PowerPoint, check them out!
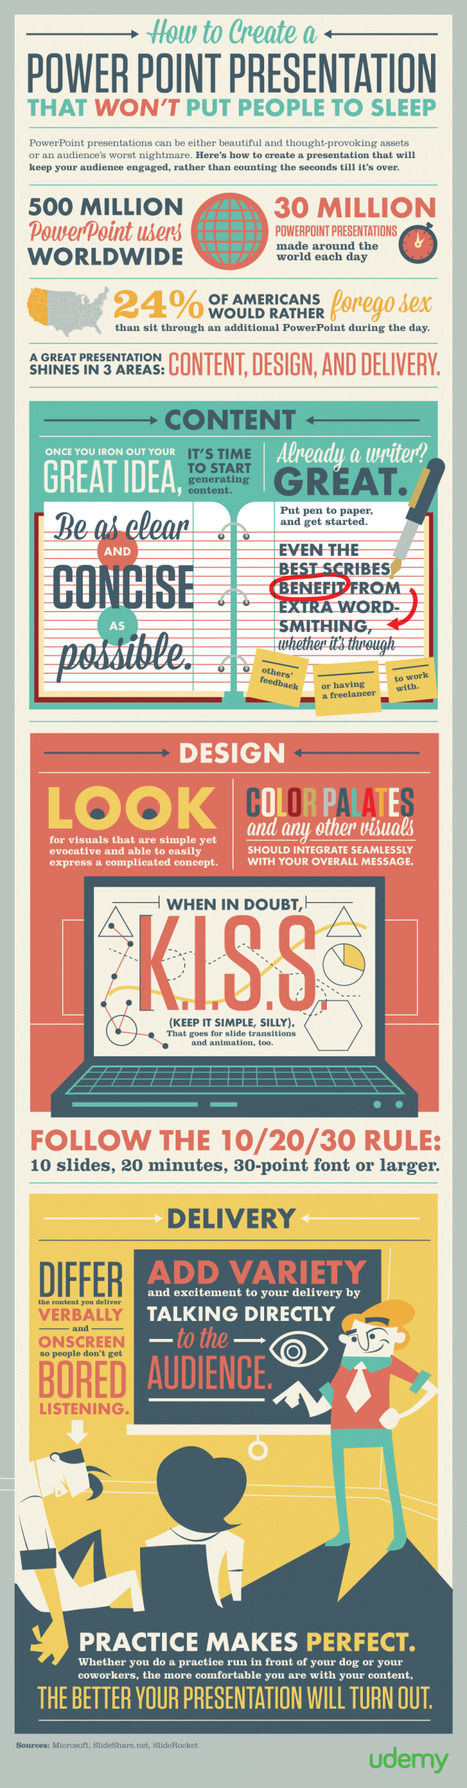
Before a presentation your nerves become fired up and your heart starts to pound. While the audience may be sizing you up, they are only hoping for an engaging presentation. They want you to succeed and quite frankly they need you to succeed. The infographic provided by Udemy walks us through the three critical points to creating a great presentation. Via Baiba Svenca
Baiba Svenca's curator insight,
March 23, 2015 12:42 PM
Attractive and informative infographic on PowerPoint presentations. Thanks for the suggestion to Ivo Novy. 
Fenia's curator insight,
March 24, 2015 2:37 PM
Useful guide to good presentations - not only for ppt but also for other presentation tools
We all know that when it comes to consuming content, text alone no longer makes the cut. We are multi-sensory beings and the more we can plug into our senses to Via Beth Dichter

Beth Dichter's curator insight,
April 24, 2014 11:10 PM
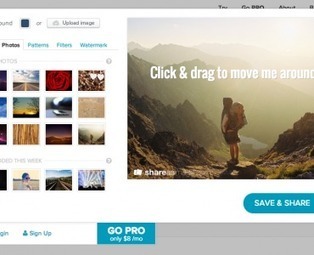
Who better than Visual.ly to share 7 online tools that will help you create visual, be they simple images, infographics or a mind map. This post shares the following tools: * Canva - a free tool * Pixlr - a free tool * PicMonkey - a free tool, but you may pay for additional tools * Quozio - free tool * Share As Image - a free tool, but will show a watermark; pay for no watermark * Skitch - free through Evernote * Coggle - free tool that allows you to create mind maps Visuals are a key part of learning. These seven tools provide a range of options that you may want to use when designing materials for your classes (or perhaps students would find use for them in your class).
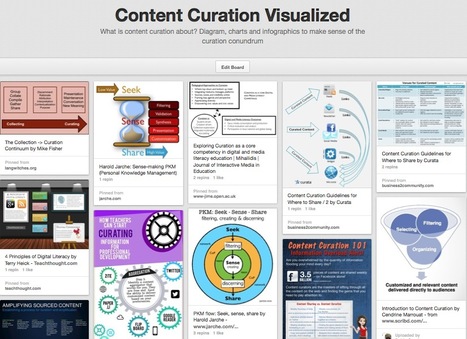
What is content curation about? Diagram, charts and infographics to make sense of the curation conundrum Via Robin Good
icoexist2's insight:
add your insight...

Monica S Mcfeeters's curator insight,
March 30, 2014 9:18 AM
This will be helpful to share to those wondering about content curation. 
Jeff Domansky's curator insight,
September 1, 2014 11:53 PM
Valuable collection of the art of curation from Robin Good.
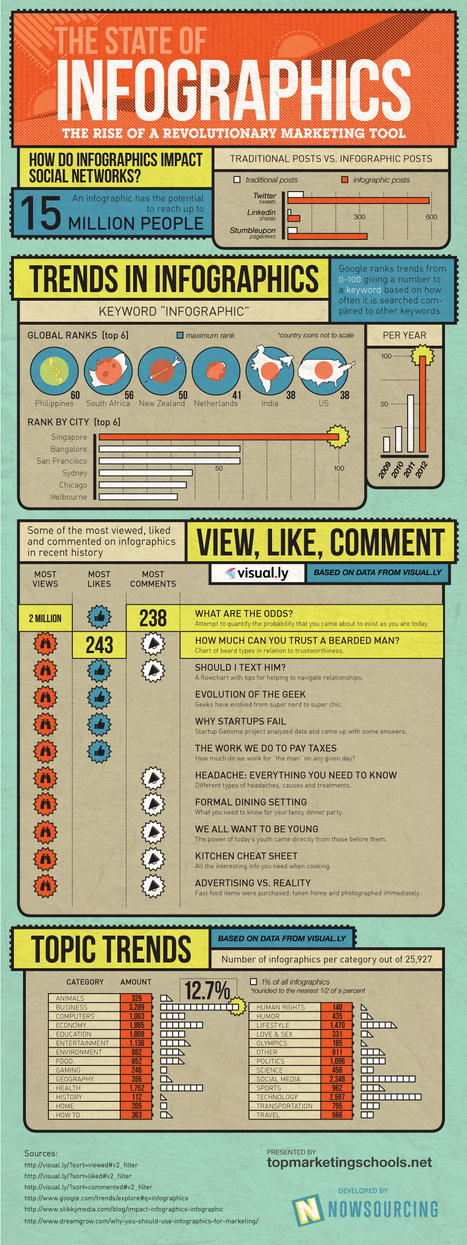
Infographics have become more popular with the rise of social media, fuelling the need for instant results by providing content in bite-size chunks. Via janlgordon
icoexist2's insight:
add your insight...
janlgordon's curator insight,
January 27, 2013 4:38 PM
This article is from Mashable and infographic created by Nowsourcing. I chose this piece because it's a continuation of the last scoops I've posted recently about turn data into something businesses can understand and utilize. Here are some highlights:.
We are all experiencing too much information and unable to process it in a way that is useful for our business needs **"The use of infographics helps to break down data visually, helping viewers make sense of complex information" **What's behind the science behind an infograpic's success? Allow an infographic to explain **An infographic has the potential to reach up to 15 million people The infographic in this piece shows you **How infographics impact social networks **The difference between traditional posts vs. infographic posts and much more....... Selected by Jan Gordon covering "Curation, Social Business and Beyond" See article and infographic here: [http://on.mash.to/XKAKcQ] 
Deb Nystrom, REVELN's curator insight,
January 27, 2013 6:05 PM
An infographic on infographics and trends on visual communication. Very relevant to learning quickly and memorably. ~ Deb |


