 Your new post is loading...
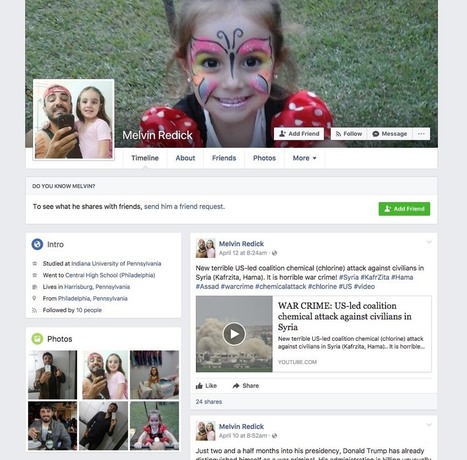
Sometimes an international offensive begins with a few shots that draw little notice. So it was last year when Melvin Redick of Harrisburg, Pa., a friendly-looking American with a backward baseball cap and a young daughter, posted on Facebook a link to a brand-new website.
“These guys show hidden truth about Hillary Clinton, George Soros and other leaders of the US,” he wrote on June 8, 2016. “Visit #DCLeaks website. It’s really interesting!”
Mr. Redick turned out to be a remarkably elusive character. No Melvin Redick appears in Pennsylvania records, and his photos seem to be borrowed from an unsuspecting Brazilian. But this fictional concoction has earned a small spot in history: The Redick posts that morning were among the first public signs of an unprecedented foreign intervention in American democracy.
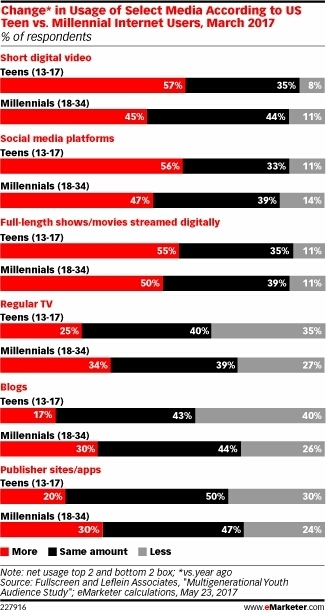
Millennials say they are spending more time with video and social, but they are not necessarily cutting back their time with other media. But according to a recent study, younger internet users, those ages 13 to 17, are shifting away from text-based online content—and a bit from TV—while spending more time with video and social. Both the younger and older groups were considerably more likely to say they were spending more time streaming full-length TV shows and movies, and similar percentages said they were spending more time with short online video. But the amplified video viewing didn’t necessarily mean they were watching less TV. Among the younger group, 40% said they were watching the same amount of TV as last year, while 35% said they were watching at least a bit less and 25% were watching at least a bit more. The older users (ages 18 to 34) were more likely to say they were....
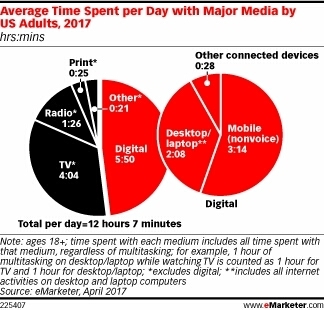
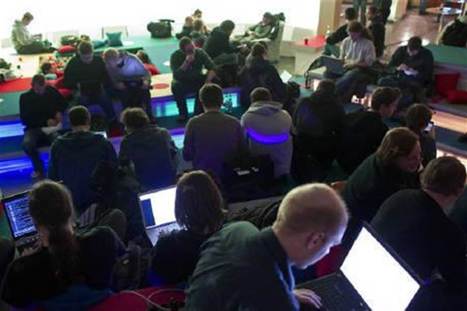
Thanks to multitasking (and our method of accounting for it, explained in a moment), US adults’ average daily time spent with major media will slightly exceed 12 hours this year, according to eMarketer’s latest report, “US Time Spent with Media: eMarketer’s Updated Estimates and Forecast for 2014-2019” (available only to eMarketer PRO subscribers). But while our reports early in the decade told a story of robust gains—with increases in digital usage more than compensating for declines in time spent with non-digital media—growth has been petering out. Of course, media multitasking is what has made so much usage possible. Like a Coney Island contestant stuffing hot dogs into his mouth with both hands, people are often using multiple media at the same time....
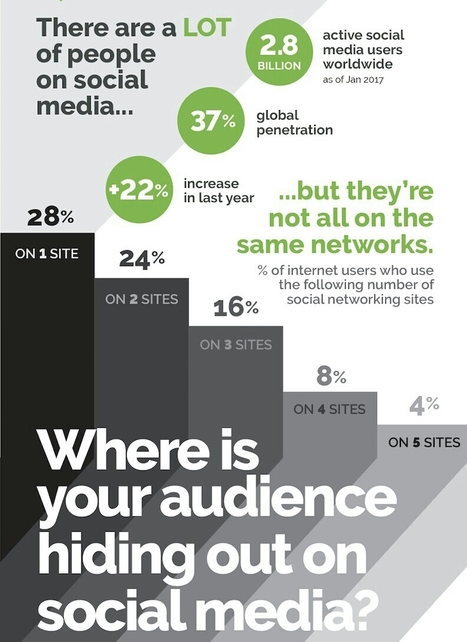
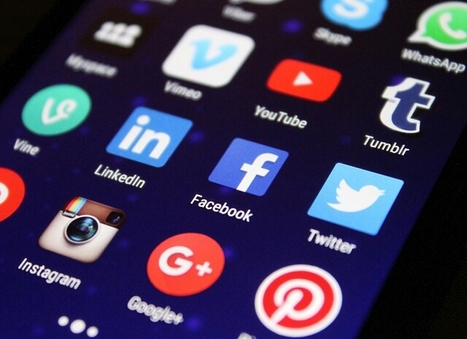
When marketers develop their social and mobile strategies -- which we strongly encourage you to do, if you haven't already -- these are important questions to ask. After all, you want to reach the right audience. So in addition to determining your buyer personas, you have to know where to find them. Not all of them are going to be using Instagram, for example. Luckily, our friends at Tracx compiled all of that information into a handy infographic that breaks down the state of social media demographics -- who's using which social network, and for what. With this information, figuring out how to best reach your personas on social media doesn't have to be such a daunting task. So read on, and start distributing your content in the right places....
Each year brings huge changes in social media, and 2016 was no exception. Here are five social stats from 2016 that will take you by surprise.
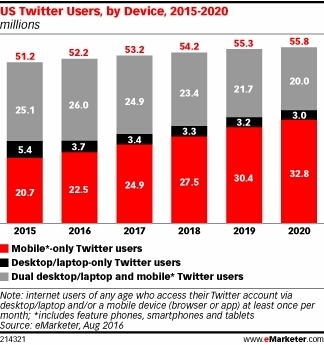
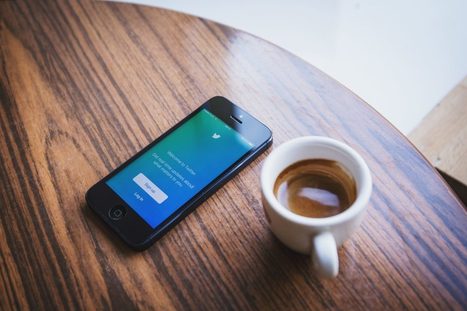
Twitter, which has struggled to grow its user base to the size of some of its social networking rivals, is reporting earnings this week not long after news that companies including Disney would not be moving to acquire the service. This year, eMarketer estimates, more than 52 million people in the US will use Twitter on a monthly basis, and just shy of half will use the service on both PCs and mobile devices. Mobile-only Twitter use is becoming more common in the US as desktop- based usage shrinks, and will account for a majority of US users in 2018 for the first time. Currently, just 19.5% of internet users and 16.1% of the population of the US uses Twitter, compared with 51.5% of the population using Facebook. On a worldwide basis, Twitter penetration is even lower: Only 3.9% of people around the world use Twitter this year, and by 2020 the figure is only expected to rise to 4.8%....
The current state of the media universe presents a bounty of boundless choice to today’s consumer. Like the cosmos, which is contemplated much in current times, the proliferation of devices and the abundance of media choices is presenting endless options for the consumer and endless challenges and opportunities for the marketer. Nielsen is reaching new frontiers by totaling up audiences across devices and burgeoning viewing platforms. Consumer engagement is reaching new heights.
The data used in this graphic is inclusive of multicultural audiences. Hispanic consumer audiences are composed of both English and Spanish speaking representative populations....
Here’s an interesting stat – according to a Pinterest survey of 2,500 Pinners (conducted in May this year), 45% of users are active on the app while watching TV.
That’s surprising – normally it’s Twitter that’s identified as the ultimate TV viewing companion in social, given its position as the home of real-time conversation, particularly around live events.
As it turns out, Pinnners, too, love to multi-screen:
“64% of our users tell us they pay more attention to what they’re doing on Pinterest than what they’re watching on TV—and 44% of them will engage with Pinterest for the show’s entirety, regardless of whether it’s on a commercial break or not.”...
This spring, we discovered that U.S. moms check Instagram as often as six times per day. But Dads áre just as active on social as Moms - the same study revealed that almost half of dads on Instagram follow businesses, and of those fathers, 69% take action from the content they see.
A new infographic from Social Media Link provides further insights and context surrounding how dads use social. The full infographic is below but here a few quick highlights. - 91% of fathers use Facebook weekly; 60% use Twitter weekly; 49% use Instagram weekly.
- When fathers do use social, they’re frequently posting about their kids - 70% of fathers share about their children at least a couple times a month.
- 61% at least somewhat agree that they use social media more now than they did before having children....
This is the gospel according to Mary Meeker, a living legend amongst venture capitalists. Instead of just blindly clicking through her 200+ page 2016..
A survey by Gartner has shown that the most successful digital marketers spend six times more on resources to help understand their data (such as tools and people) than those who don’t. Reacting to this trend, CMOs are set to increase spending on social media analytics by 440% between 2014 and 2019. But what can you do with the data that you extract?
We recently released a visual guide looking at how to use Twitter insights for your content marketing strategy, but Twitter data can also be utilised to deliver more long term benefits to your brand’s wider marketing strategy. We spoke to Johary Radifison, Global Insights Director at Grayling to discover more....
.Are you struggling to connect with your customers on social networks?
Do you know where they hang out online?
To optimize your social media marketing efforts, it’s important to know who your customers are and which social networks they spend their time on.
In this article you’ll discover how to connect with your target audience on social media....
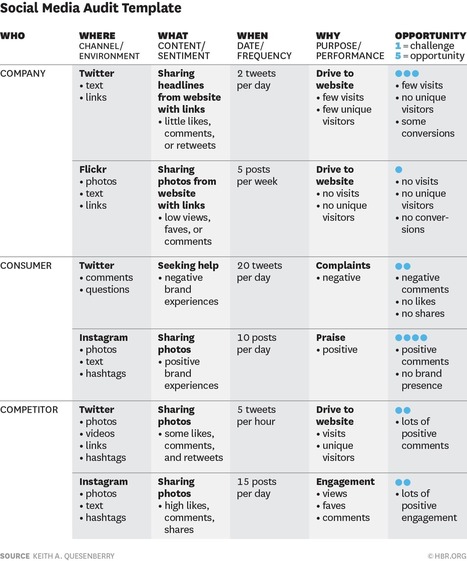
Whether marketers like it or not, consumers are now generating over 25% of content that appears in web searches for specific brand names, and consumers often trust those social media messages more than advertising or news articles about the brand. Research has shown that this “electronic word-of-mouth” is seen as reliable by consumers and significantly affects a firm’s perceived value.
But with such a panoply of channels out there, how can social media marketers keep track of what people are saying? And what strategies can be implemented to engage those consumers to influence the conversation? That’s where a careful social media audit can help. It’s a systematic examination of social data to help marketers discover, categorize, and evaluate all the social talk about a brand. This approach captures what consumers are saying about a brand, what competitors are doing on social media, and what the brand itself is doing.
I developed a social media audit template for the book Social Media Strategy: Marketing and Advertising in the Consumer Revolution from the principle of the Five Ws that is taught to journalists: who, where, what, when, and why...
|
I’ll admit I was a slow-follower when the iPhone launched ten years ago. I was suspicious of Apple’s intent — I was not fan of its closed, vertically integrated model — and the market’s infatuation with apps felt like a fad that would ultimately fade. When I finally did get an iPhone, I felt complicit in the what amounted to internet climate change: slowly but surely, our new addictions were bound to swamp all that we had worked so hard to build on the open web. As Tristan Harris and many others have pointed out, the economic incentives driving our mobile landscape (in short: advertising) are based fundamentally on the science of addiction, and addicted we certainly are. And as we’ve learned from tobacco and processed foods, an industry based on addiction preys on the young. In what I hope will be a landmark piece in the Atlantic, social scientist Jean M. Twenge, who has studied generational differences for decades, concludes that the first generation of teenagers to grow up with a smartphone in their hands is demonstrating wildly different patterns from any group she’s previously researched. And those patterns are not good....
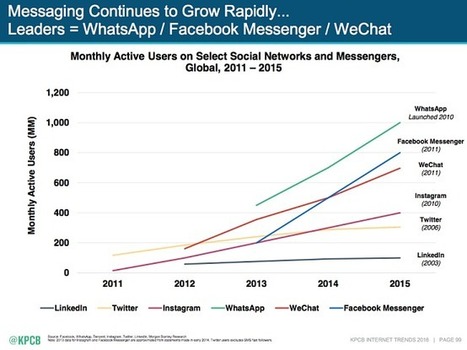
Mary Meeker's annual Internet Trends report is one of the most closely watched reports in the tech industry, and this year's presentation underscores the growth of mobile, particularly on social platforms that now control the bulk of ad spending and time spent by users.
Here's a look at seven of the most interesting stats in Meeker's more than 200-slide deck presented at Re/code's Code Conference today.
Overall, our results showed that, while real-world social networks were positively associated with overall well-being, the use of Facebook was negatively associated with overall well-being. These results were particularly strong for mental health; most measures of Facebook use in one year predicted a decrease in mental health in a later year. We found consistently that both liking others’ content and clicking links significantly predicted a subsequent reduction in self-reported physical health, mental health, and life satisfaction. Our models included measures of real-world networks and adjusted for baseline Facebook use. When we accounted for a person’s level of initial well-being, initial real-world networks, and initial level of Facebook use, increased use of Facebook was still associated with a likelihood of diminished future well-being. This provides some evidence that the association between Facebook use and compromised well-being is a dynamic process. Although we can show that Facebook use seems to lead to diminished well-being, we cannot definitively say how that occurs. We did not see much difference between the three types of activity we measured — liking, posting, and clicking links, (although liking and clicking were more consistently significant) — and the impact on the user. This was interesting, because while we expected that “liking” other people’s content would be more likely to lead to negative self-comparisons and thus decreases in well-being, updating one’s own status and clicking links seemed to have a similar effect (although the nature of status updates can ostensibly be the result of social comparison-tailoring your own Facebook image based on how others will perceive it). Overall our results suggests that well-being declines are also matter of quantity of use rather than only quality of use. If this is the case, our results contrast with previous research arguing that the quantity of social media interaction is irrelevant, and that only the quality of those interactions matter....
It's been a white-hot week so far for digital marketing statistics. We've seen numbers roll in about Reddit viewers, digital-media growth, bad ads, web bots, Amazon Echo, ecommerce and the hit film La La Land.
Check out these dozen data points that grabbed our attention:
1. Big Game versus going big on Snapchat
On Thursday, we looked at how many types of digital ads equaled the cost of a 30-second Super Bowl TV spot, which comes in at $5.6 million this year. For Snapchat sponsored lenses, 17 of them add up to one Big Game commercial. A branded lens on the mobile app, according to digital agency Essence, costs roughly $329,400.
2. Redditors love mobile reading
Reddit didn't have a mobile app one year ago today, but on Wednesday it revealed that more than 40 percent of its content views occur via its app....
Trying to find the optimal times and days for your social media posts can be a difficult challenge. You have to make it an effort to post at different times each day for each social media account, while tediously recording your results.
Via Brian Yanish - MarketingHits.com
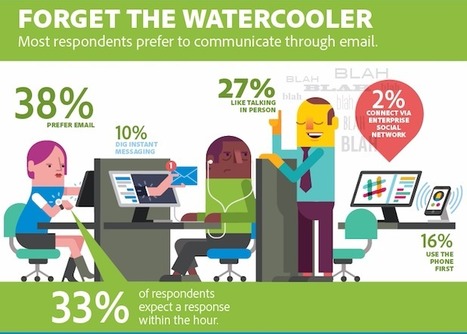
Social media may be a mainstream communication platform, driving news coverage and consumption and awareness of social movements. But when it comes to office spaces, email and face-to-face conversations are still the preferred method of communication, according to an Adobe survey of white-collar workers with smartphones in the U.S. and the U.K.
In fact, nearly 40 percent of participants preferred communicating by email, while 10 percent preferred instant messages. The enterprise social platforms don’t really seem to be catching on, with only 2 percent of respondents choosing to communicate with their colleagues via social networks.
Even when it comes to being contacted by brands, almost one-half of the survey participants still preferred email. Interestingly, 22 percent of the participants preferred direct mail. None of the other methods of communication–texts, social media messages, phone calls and company mobile apps–broke 10 percent....
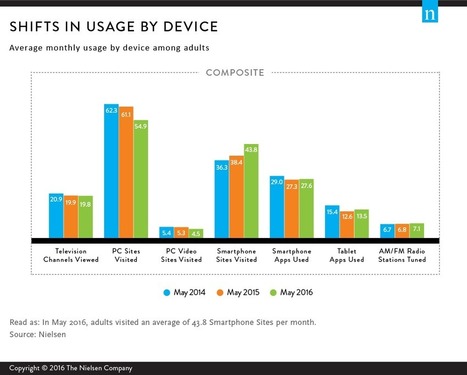
For consumers, having content options is no longer a luxury, but an imperative. And so, too, are the multitude of devices that they use to engage with that content—be it a TV, tablet or soon-to-be emerging technologies.
But having a plethora of content options at our collective fingertips doesn’t necessarily mean consumers are connecting with ALL choices ALL of the time. In fact, according to the second quarter Nielsen Total Audience Report, which focuses on what options consumers have in addition to how they use them, behaviors and usage are unique to the device being used. Consumers still spend most of their time on traditional platforms, but they also look to explore the wide range of content channels made available by new media.
Adults still spend the most time watching TV, as the average adult spends more than four hours each day watching live TV. The average monthly channels available on TV (206) is only a fraction of what’s available on digital apps or websites, so consumers are using more of them. In the second quarter of 2016, consumers visited 55 PC sites and used 28 smartphone apps, compared to 20 TV channels viewed. Even though Americans have fewer channels to choose from than they did last year, the percentage of channels they actually view has remained consistent at 9.6% year over year from 2015-2016....
Americans are spending more and more time on social media, but are increasingly dissatisfied with the experience, a new survey shows. Although people are generally pleased with their overall online experience, social sites such as Twitter and Facebook saw a marked decrease in satisfaction year on year, according to the annual e-business report from the American Customer Satisfaction Index released on Tuesday. Big drops for Facebook (68, down nine percent) and Twitter (65, down eight percent) dragged down the social media category, which scored a 73. That's a drop of 1.4 percent from last year....
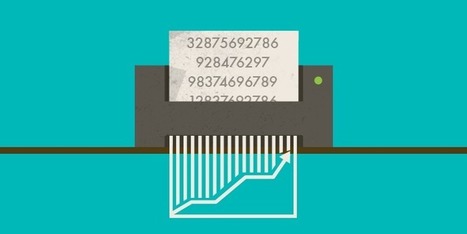
The Washington Post recently published an article about social media metrics with an alarmist headline: 6 in 10 of you will share this link without reading it, a new, depressing study says This story then predictably made the rounds in the blogosphere, from Gizmodo to Marketing Dive. The headline reads like self-referential clickbait, daring readers to click on the provocative statement so as not to contribute to what the article calls “the oft-demoralizing cesspool that is Internet culture.” The article cites a new study from Columbia University and French National Institute computer scientists that “59 percent of links shared on social media have never actually been clicked: In other words, most people appear to retweet news without ever reading it.” Whoa, if true. A Few Problems With The Story Except there are a few problems with extrapolating these findings to all links on social media. In fact, we probably shouldn’t even consider the findings to be all that bad....
Stop. Wait a minute. Put down whatever you’re doing and pay attention. We spend a lot of time reading about the trends sweeping the marketing world, and the growing influence of social media on customers purchase decisions....
Facebook just released financial results for Q4 of 2015, and one number starts out in particular: 934 million mobile daily active users (DAUs).
Sure, 0.9 billion might not sound quite as impressive as the 1.04 billion total daily users, but we already knew the company had passed the billion milestone in early November.
There were 894 million mobile DAUs at the time, which means the company has added 40 million more mobile users per day since November, and it will very likely cross 1 billion mobile DAUs sometime this year.
Meanwhile, the company is also slowly encroaching on the 2 billion monthly active users (MAUs) mark – three were 1.59 billion MAUs in December, or 14 percent more than the same time in 2014. Of those, 1.44 came from mobile, an increase of 21 percent, once again showing the quicker growth in the mobile sector....
A new Xerox ‘State of Customer Service in 2015’ survey reveals that almost half (49%) of consumers believe that they will not have to pay for their media services by 2025 – regardless if they prefer traditional media (48%) such as film, TV, music, radio, news and sports outlets established in the pre-Internet age or new digital media (47%), such as social media, which exists exclusively online.
Today, 43% of consumers pay to access their favorite media outlets. Two thirds (66%) of these high-value, paid subscription media consumers disagree that the quality media they have become accustomed to will be available for free in the coming 10 years.
The report asked 6,000 media consumers in France, Germany, the Netherlands, the United Kingdom and the United States to reveal the status of media in their lives, finding that dependency on the channel through which most of today’s media is consumed, the Internet, is not set to waver in the next decade. In fact, over two thirds (69%) of consumers predict that access to the Internet will become a basic human right in a decade’s time....
|


![Pinterest and TV Go Hand-in-Hand [Infographic] | Public Relations & Social Marketing Insight | Scoop.it](https://img.scoop.it/zVT15sOZItW9agst1e5yQzl72eJkfbmt4t8yenImKBVvK0kTmF0xjctABnaLJIm9)
![Men Use Social More After Becoming Dads [Infographic] | Public Relations & Social Marketing Insight | Scoop.it](https://img.scoop.it/qj5sCqocZWnvj1q7TIJg7jl72eJkfbmt4t8yenImKBVvK0kTmF0xjctABnaLJIm9)


Fascinating NY Times investigative reporting on fake Americans influencing the election.