


In my last post, “Common Assessments” vs “Common Understandings”, I was reminded of how powerful comments are on a blog, and why blogging is a hugely powerful tool for not only sharing your learnin…
Via Linda Foote
Get Started for FREE
Sign up with Facebook Sign up with X
I don't have a Facebook or a X account


 Your new post is loading...
 Your new post is loading...
Your new post is loading...
In my last post, “Common Assessments” vs “Common Understandings”, I was reminded of how powerful comments are on a blog, and why blogging is a hugely powerful tool for not only sharing your learnin… Via Linda Foote 
No comment yet.
Sign up to comment
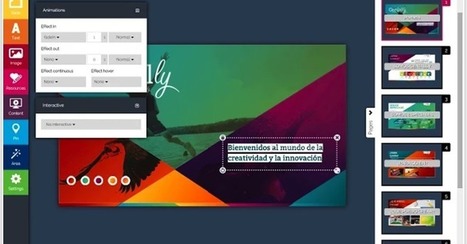
Free resource of educational web tools, 21st century skills, tips and tutorials on how teachers and students integrate technology into education Via paul rayner

Recycle Bin recovery seems quite difficult to us if the Recycle Bin is emptied or the files are further deleted from it; however, it is not the case,. This tutorial shows how to restore deleted files from Recycle Bin in Windows and Mac.
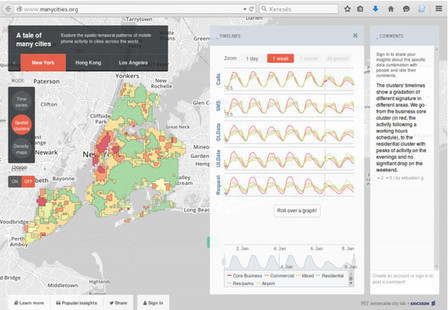
The SENSEable City Laboratory at MIT has developed a new tool with Ericsson to better understand human behavior. "ManyCities" is a new website that "explores the spatio-temporal patterns of mobile phone activity in cities across the world," including London, New York, Los Angeles and Hong Kong. Taking complex data and organizing it in a intuitive way, the application allows users to quickly visualize patterns of human movement within the urban context down to the neighborhood scale. You can imagine how useful a tool like this can be for urban planners or even daily commuters, especially once real time analytics come into play. Via Lauren Moss
Here's How To Find and Delete the Personal Data Google Has on You. Via Tom D'Amico (@TDOttawa) , Dean J. Fusto

donhornsby's curator insight,
December 20, 2014 6:40 AM
Today we’ll take a look at all the ways Google collects your personal data and the ways you can delete it. 
PrivacyWise's curator insight,
January 2, 2015 8:39 AM
Helpful guide for data deletion for all Google users 
Chris Carter's comment,
January 5, 2015 7:38 PM
Thank you for this scoop. Anyone who wants an iota of privacy has to work for it.
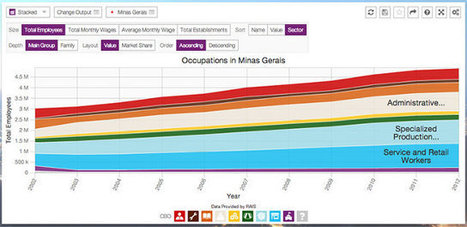
DataViva, a project developed in part by Media Lab professor Csar Hidalgo, aims to make a wide swath of government economic data usable with a series of visualization apps. In the four years since the U.S. government created data.gov, the first national repository for open data, more than 400,000 datasets are available online from 175 agencies. Governments all over the world have taken steps to make data more transparent and available. But in practice, much of that data--accessible as spreadsheets through sites like data.gov--is incomprehensible to the average person. DataViva offers web apps that turn those spreadsheets into something more comprehensible for the average user. The site, which officially launched last week, has lofty goals: to visualize data encompassing the entire Brazilian economy over the last decade, with more than 100 million interactive visualizations that can be created at the touch of a button in a series of apps. The future of open government isn't just dumping raw datasets onto a server: It's also about making those datasets digestible for a less data-savvy public. Via Lauren Moss
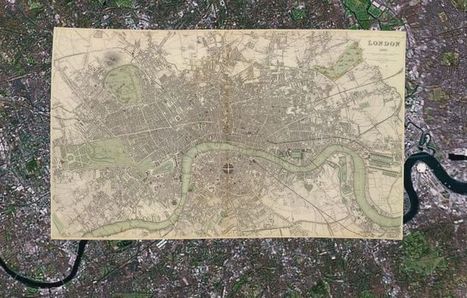
With 150,000 or so old print maps to his name, David Rumsey has earned his reputed place among the world's "finest private collectors." He continues to expand his personal trove as well as the digitized sub-collection he makes open to the public online — some 38,000 strong, and growing. He's created a series of interactive maps that layer old prints onto the Google Earth and Google Maps platforms, and this summer he plans to launch a geo-referencing tool (similar to one recently introduced by the British Library) that lets users get involved in the digital mapping process themselves. While preparing for this next expansion of his online map empire, Rumsey remains fascinated by "the power of putting these images up and letting them go," he says. "Maps have a way of speaking to people very straightforward," he says. "You don't have to have a lot of knowledge of map history or history in general. To me they're perfect tools for teaching history to the public." Via Lauren Moss
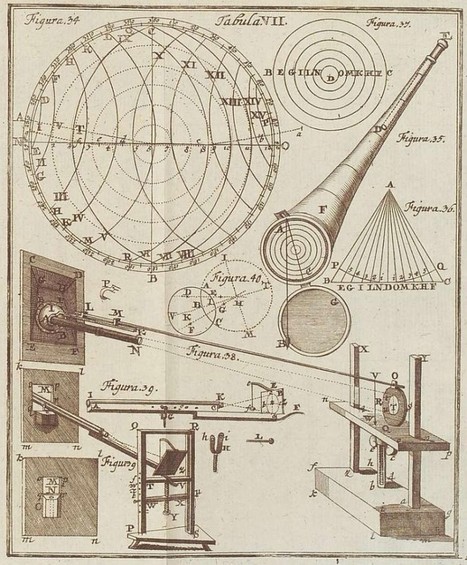
Graphics, charts, diagrams and visual data representations have been published on books, newspapers and magazines since they've existed, not to mention old maps and scientific illustrations...
Despite the lack of tools such as the ones we have at our disposal nowadays, they are as inspiring and important as the best contemporary visualizations. Visit the article link for a gallery of vintage visualizations... Via Lauren Moss

Charlley Luz's curator insight,
July 20, 2013 10:26 AM
muito legal, os Infográficos antes de existir a internet. 35 exemplos de infográficos no papel :) Achei falta do Marcha para Moscou do Minard http://www.datavis.ca/gallery/re-minard.php ; 
Leoncio Lopez-Ocon's curator insight,
July 20, 2013 2:57 PM
El brasileño Tiago Veloso, fundador de Visual Loop, nos ofrece 35 interesantísimas representaciones visuales de distintos fenómenos y eventos que permiten hacer un paseo por la historia de la ilustración científica.
Humankind has been telling complex stories through simple visuals long before you saw your first infographic at Mashable. History is humbling, let's go back in
|
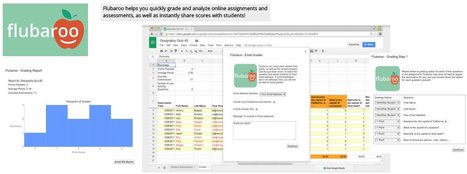
Flubaroo helps you quickly grade and analyze online assignments and assessments, as well as instantly share scores with students! Via John Dalziel, massimo facchinetti

Recycle Bin recovery seems quite difficult to us if the Recycle Bin is emptied or the files are further deleted from it; however, it is not the case.

We all have our own presentation style, but have you ever thought about how your particular style compares to others? And the strengths and weaknesses of your presentation style? After years of research, my team and I have found there are four primary presentation styles: the Closer, the Data Scientist, the Director and the Storyteller. You can discover your own style with the quiz What’s Your Presentation Style? One style isn’t better than other; but picking the wrong style for a particular audience can cause trouble for even the best presenter. Via The Learning Factor

Dr. Deborah Brennan's curator insight,
January 30, 2016 9:33 AM
good insight into the strengths and weaknesses of each style. Good for self-awareness 
Tony Guzman's curator insight,
February 8, 2016 11:42 AM
This article shares four type of presenter styles. Which one fits you? 
Sudhir Hira's curator insight,
February 24, 2016 3:01 AM
Presentation is critical! We often find this in the conferences we run for our clients!
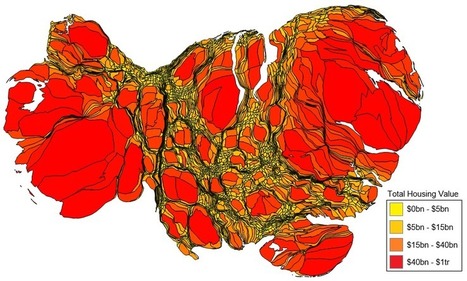
Cartograms are fun tools for swapping out land area for some other variable. For certain figures, especially data that swing wildly at one of the end of the spectrum or another, cartograms are ideal. This cartogram, which compares property values between counties across the continental United States, looks like bad news from a gastroenterologist. What this in fact shows is that just a handful of counties account for the vast majority of property values in the U.S. The distortion is so severe that it doesn’t look like a map of the U.S. at all... Via Lauren Moss
Hello, Ello! Get to know the Un-Facebook, a new minimal and ad-free social network. Via THE OFFICIAL ANDREASCY

Dawid Bielski's curator insight,
December 26, 2014 8:20 PM
Może i to nie zaden gadżet ale zawsze jakaś nowość, która może sie przydać w przyszłości:)
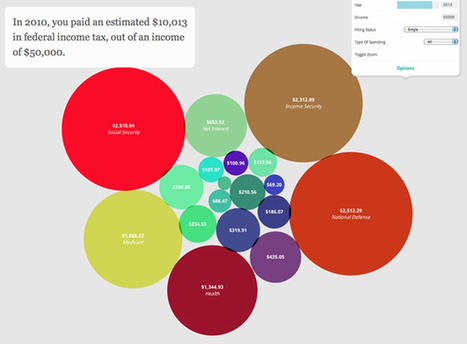
During the past few years the demand regarding Data Info-graphics has increased in volume and demand as well as in clarity. The range of technologies available by which to collect and examine data is constantly on the rise- both in web and desktop applications, which provide several great interfaces. Within this scope, such new tools are continually emerging whose main purpose is to- simplify the process within being able to harness data in lending impact and insight generation... Via ghbrett, Lauren Moss
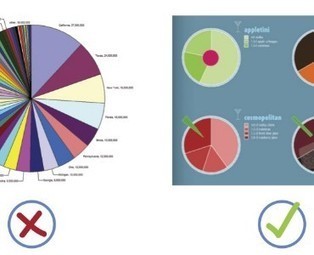
When it comes to visualizing data, it’s important to pick the right graph and the right kind of data range. Make it too detailed, and information gets lost and the reader leaves confused. Too simplified, and your data’s integrity is weakened.
Choosing the right infographic element shouldn’t be an art but common sense. After all, it’s an infographic – readers should get the gist of things at first glance and not have to get crossed-eyed in making sense of things... Via Lauren Moss

Lauren Moss's curator insight,
April 10, 2013 6:55 AM
General reference for basic visualization design elements, applications, and best practices...
By Robert Korsara
"Presentation and communication of data have so far played a minor role in visualization research, with most work focused on exploration and analysis. We propose that presentation, in particular using elements from storytelling, is the next logical step and should be a research focus of at least equal importance as each of the other two. Stories package information into a structure that is easily remembered, which is important in many collaborative scenarios when an analyst is not the same person as the one who makes decisions, or simply needs to share information with peers. Data visualization lends itself well to being a communication medium for storytelling, in particular when the story also contains a lot of data. We review the literature on storytelling and presentation and outline the research area. "
|


