
Free resource of educational web tools, 21st century skills, tips and tutorials on how teachers and students integrate technology into education
Via Tom D'Amico (@TDOttawa)
Get Started for FREE
Sign up with Facebook Sign up with X
I don't have a Facebook or a X account


 Your new post is loading...
 Your new post is loading...
Your new post is loading...
Free resource of educational web tools, 21st century skills, tips and tutorials on how teachers and students integrate technology into education Via Tom D'Amico (@TDOttawa) 
No comment yet.
Sign up to comment
![50 Features Every Small Business Website Must Have [Infographic] | information analyst | Scoop.it](https://img.scoop.it/JZiLTdMYUgpNnpDDNeSgnzl72eJkfbmt4t8yenImKBVvK0kTmF0xjctABnaLJIm9)
Having a strong web presence is mandatory, even for small businesses just starting out. Via Daniel Watson
michel verstrepen's insight:
Few will dispute that a modern website is essential to any business hoping to remain at the forefront of their industry. For those whose business website is no longer newish, or for those business owners just starting the process of building a website, knowing what features are a must have is important information. This excellent infographic should prove very useful for anyone reviewing an existing website, or currently planning to build one from scratch.

Norman Demers's curator insight,
March 20, 2016 8:42 AM
Few will dispute that a modern website is essential to any business hoping to remain at the forefront of their industry. For those whose business website is no longer newish, or for those business owners just starting the process of building a website, knowing what features are a must have is important information. This excellent infographic should prove very useful for anyone reviewing an existing website, or currently planning to build one from scratch. 
Alex Dolhescu's curator insight,
March 22, 2016 4:40 PM
Few will dispute that a modern website is essential to any business hoping to remain at the forefront of their industry. For those whose business website is no longer newish, or for those business owners just starting the process of building a website, knowing what features are a must have is important information. This excellent infographic should prove very useful for anyone reviewing an existing website, or currently planning to build one from scratch. 
Martin-Elmore's curator insight,
August 25, 2017 7:12 PM
Creating a Website that promotes your business is key to success. The features mentioned in this article ... should help anyone want to brand themselves as experts in the business. #essentialoilsbusiness #doTERRA #oillov.com #oilliv.com

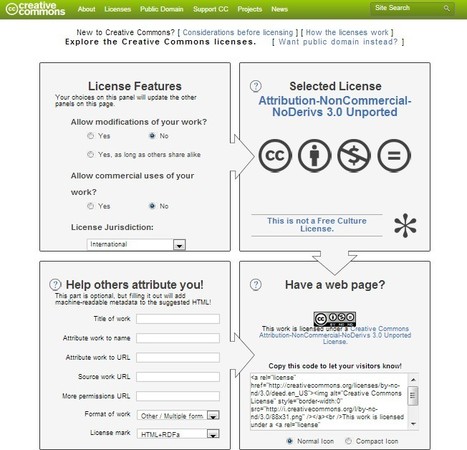
Maria Persson's curator insight,
August 25, 2013 11:52 PM
Must have if you are a developing digitally literate student or pedagogue! Let's be honest, fair and true to the work done by others and even ourselves! Thanks for this very useful and urgently needed resource! 
becool's curator insight,
September 19, 2013 5:37 AM
Creative Commons: Voor een sommige al gekend, door niet velen toegepast. Deze link om je hier wat meer informatie over te geven en de cultuur van het delen verder te promoten. Docenten, trainers, instructeurs en coaches hebben baat bij dit model. Controleer de mogelijkheden van creative commons en gebruik het ook werkelijk!
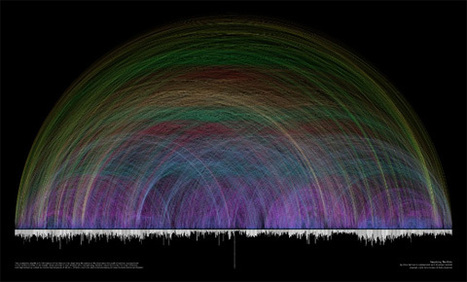
Data visualizations and infographics can make complex datasets easier to understand and comprehend. By creating a graphical represenatation of data and statistics, complicated concepts and information can make more sense in less time. Many visualizations focus on representing a specific set of data or statistical information. Others focus on less-concrete topics, providing a visual representation of abstract concepts. Generally speaking, the first type appear more like graphs or charts and the latter are often more creative and imaginative. Via Lauren Moss
Information graphics or “infographics” are graphic visual representations of information, data, or knowledge. Infographics help us absorb facts and figures in the most effective way possible. They come in extremely handy when you need to explain complex information, numbers or data rather quickly and effectively. One cool way to get inspired is to look at some of the best infographics out there. Infographics are an excellent way to add humor or irreverence to tell a great story in short possible way. However, infographics can be pretty hard to design since you have to gather together a lot of information and make it look good. Today we're to sharing the top places to see some great visual graphics and also find inspiration to create your own... Via Lauren Moss
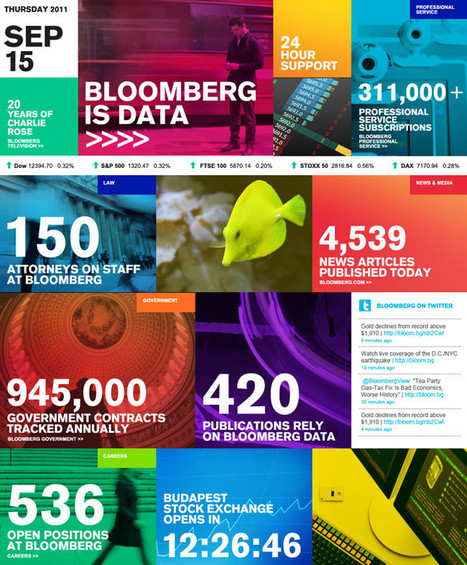
Tasked with creating a corporate page for Bloomberg, frog had to figure out the central theme of all its myriad businesses: Data, which they then used as a clever bit of branding. The idea is that Bloomberg, in all of its businesses, provides data and information. So why not use that data as the actual branding itself..? Via Lauren Moss
|
Free resource of educational web tools, 21st century skills, tips and tutorials on how teachers and students integrate technology into education Via Tom D'Amico (@TDOttawa)
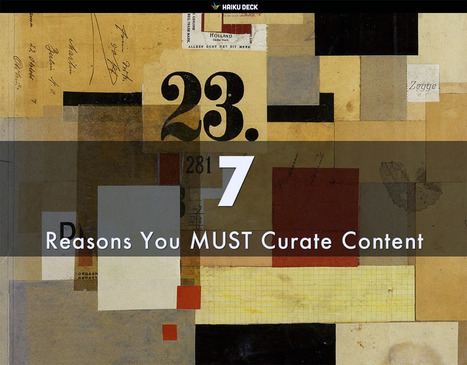
We shocked a SEO Meetup suggesting 90% curation to 10% content creation. This deck explains why you MUST curate content. Content curation is a CSF (Crtical Success Factor) for online marketing. Via Martin (Marty) Smith

"From annoying pop-up ads to often completely irrelevant video pre-rolls, the clutter is causing consumers’ “BS meters,” as digital rock star Gary Vaynerchuk has called them, to become more sensitive and accurate than ever before."
"So while the speed of technology is increasing, it’s interesting to note that one of the hottest trends in online marketing might just be the age-old art of story-telling."
"What does this mean? To cut through the clutter, businesses need to stop annoying, and start telling stories." - Lisa Ostrikoff Via Ken Jondahl

Ken Jondahl's curator insight,
February 14, 2013 8:46 AM
The article focuses mostly on the visual marketing via web/ads/etc and is dead on in the conclusions. However, think about your sales people.
Are they really prepared to go out and have conversations with customers which include great stories around your company, the people and how you help customers?
If not, the next time an annoying pop up ad hits you in the face. Think about how your customers feel when your sales person visits and goes on and on about the product features and benefits.
It is not about it, it is all about how it is used. In sales we need to get to the point and tell a great story around the product usage.
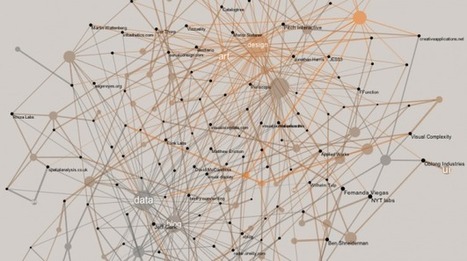
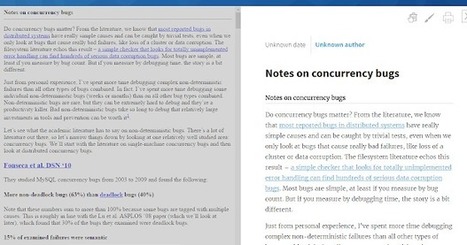
Developer Santiago Ortiz explores visualization references through Delicious tags and puts them in a discovery context. There are two views. The first is a network with tags and resources as nodes. At first it looks like a giant hairball, but mouseover and you get a fisheye effect to zoom in on nodes, which makes them more readable. Mouse over a tag, and the labels for related resources get bigger, and likewise, mouse over a resource, and the related tags get bigger. The second view lets you compare resources. In the network, select two ore more resources, and then click on the bottom button to compare the selected. Via Lauren Moss
Data Visualization made Fast, Fun and Easy! We are making it ridiculously easy to visualize data and share your insights on the web. Eavesdrop on our Twitter stream @plot_io for updates. Or drop us an email at help@plot.io. Via Lauren Moss
|