


Want to know how to Beta Test An Online Course? Check some best practices of beta testing your online course before launching it.
Get Started for FREE
Sign up with Facebook Sign up with X
I don't have a Facebook or a X account


 Your new post is loading... Your new post is loading...
Want to know how to Beta Test An Online Course? Check some best practices of beta testing your online course before launching it. 
No comment yet.
Sign up to comment
The 10 most egregious UX offenses against users. Web design disasters and HTML horrors are legion, though many usability atrocities are less common than they used to be.
Via Martin (Marty) Smith
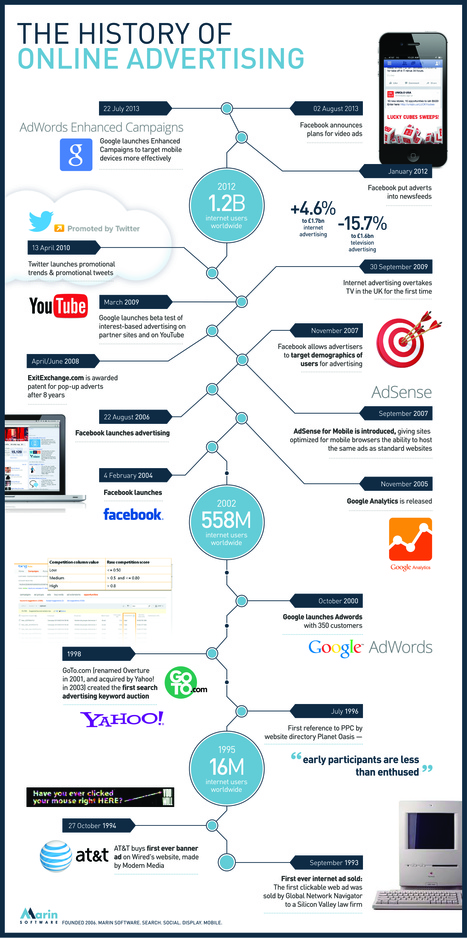
Advertising has come a long way since the first ever online ad was sold in 1993. This new infographic from Marin Software plots the industry's biggest moments, from the launch of Facebook to Twitter's promotional tweets and the more recent introduction of Google Adwords. Via Lauren Moss

9Dotstrategies's curator insight,
October 3, 2013 4:24 AM
History of Online Advertising: An Infographic 
Lee Werrell's curator insight,
October 6, 2013 6:47 AM
Just shows the phenomenal growth of online activity - and it is set to grow exponentially as more peoiple access the internet.
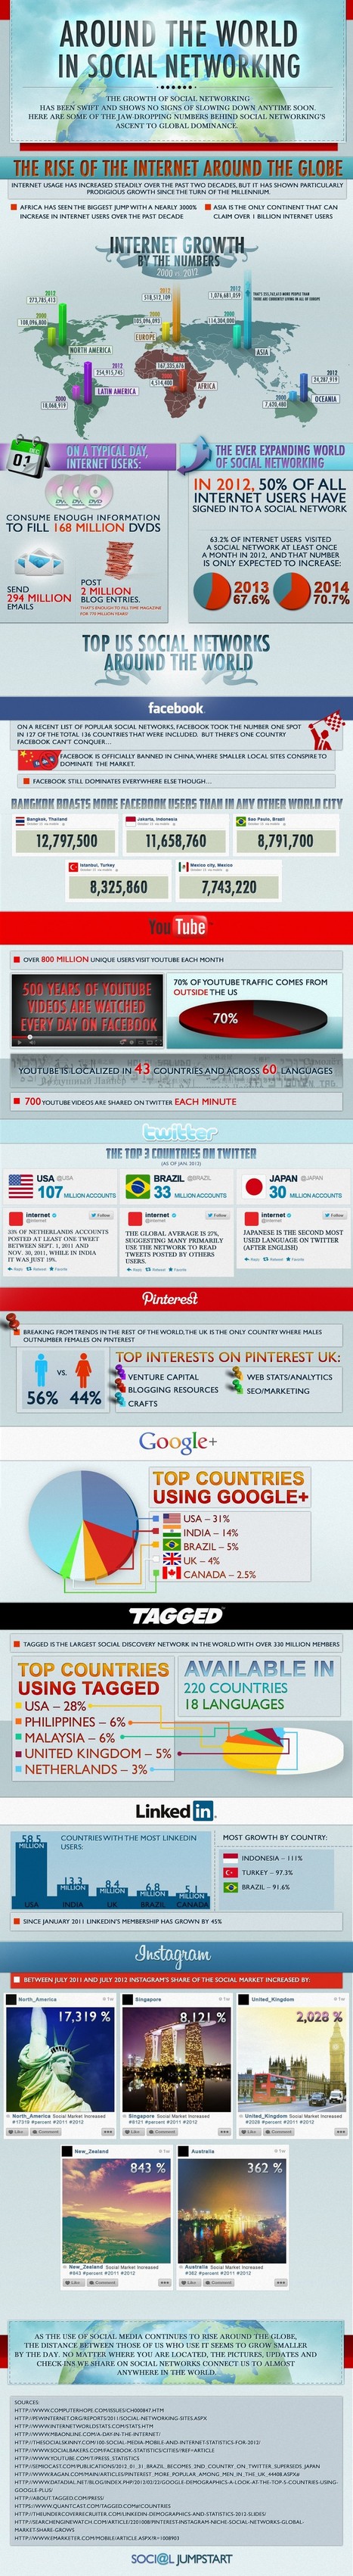
The world of social media is increasing and has a powerful role to play in the future. In 2012, more than 63% of online users visited more number of social media websites than any other types, and that number is expected to continue going up through 2013. View this infographic to find more statistics about online behavior and the use of Facebook, Twitter, LinkedIn, YouTube, Pinterest and Instagram across the globe... Via Lauren Moss

Angie Mc's curator insight,
January 26, 2014 10:13 AM
Making friends worldwide is one of the best parts of participating in social media. I especially love how Twitter makes it easy to connect across time zones. 
Lydia Gracia's curator insight,
February 14, 2014 5:20 AM
La Guia completa del Social Media en el Mundo
![How People Use the Internet [INFOGRAPHIC] | Design, Science and Technology | Scoop.it](https://img.scoop.it/HxayS8uDxOfZb1g4NfEF4jl72eJkfbmt4t8yenImKBVvK0kTmF0xjctABnaLJIm9)
Today, around the world more people have mobile phone subscriptions than have access to electricity and safe drinkable water. Today, almost a third of the world's population uses the internet (a 528.1% growth since 2000! So what are we doing with all the time we spend online, and how do we know all that time is being spent in useful ways? For many of us, the internet is among the first things we experience after we wake; in fact, 75% of users are online before 9 a.m. Over 75% of people in the US own a laptop, 53% a smart phone, and 31% a tablet. Email is the most common action performed by people on their laptops, while search is the top action for mobile phone and tablet users. 72% of people like to play games on their tablets while 70% use their mobile phones for social media. Where do we use these devices? 72% of people use their mobile phones while traveling, and 64% use them in restaurants and coffee shops. As for tablets, 88% of people use their devices in the living room, 79% in the bedroom.
Find more statistics and data at the infographic or article link. Via Lauren Moss

Paco Arcoleo's curator insight,
July 26, 2013 3:12 AM
Una semplice e chiara infografica sullo stato dei fatti degli utilizzatori di internet al giorno d'oggi, meno del 10% degli account umani/reali utilizza facebook, beh allora ci stiamo evolvendo sul serio ;)
![The Digital Marketing Trio Of 2013 [Infographic] | Design, Science and Technology | Scoop.it](https://img.scoop.it/EtLJxAuiaky8HblTjaAYozl72eJkfbmt4t8yenImKBVvK0kTmF0xjctABnaLJIm9)
Digital marketing has become one of the most focused on streams of marketing in the last few years. Three of the biggest digital marketing issues include social network marketing, mobile, SMS marketing, and content marketing. Here’s a brief look at each: Social Network MarketingAs a marketing, you can rely on social media to connect, engage, and build relationships with current and potential customers. Mobile / SMS MarketingMobile marketing is a term that covers several different methods of marketing through mobile devices. Mobile marketing can take several different shapes but one of the most popular is SMS marketing. Content MarketingContent marketing is the development of interesting and helpful materials to engage customers and clients. Examples of content can be blogs, infographics, online tools, YouTube videos etc.
This infographic displays some eye-opening statistics about these 3 digital marketing streams and might get you thinking more about including these streams into your marketing mix. Via Lauren Moss

Ennio Martignago's curator insight,
August 29, 2013 3:01 AM
Sociale, Mobile e… Contenuti (!!!). Il terzetto di punta dell'anno in corso (e ml'olio solo di questo) 
Ubleam's curator insight,
August 29, 2013 3:47 AM
So do you use the smart logo : http://pinterest.com/ubleam/
Infographics have become extremely popular online tools to create a compelling visualization by conveying a message much more effectively than a stand alone written article or photo. They must be well-designed and appealing to the eye; these 10 online tools below will aid you in creating infographics to champion your cause and convey a visual message... Via Lauren Moss
![The Many Faces of Influence [infographic] | Design, Science and Technology | Scoop.it](https://img.scoop.it/kHYuB2jwVS1pbQl6VgBLizl72eJkfbmt4t8yenImKBVvK0kTmF0xjctABnaLJIm9)
From
traackr

Inspired by the rich variety of influencer types our customers discover, we looked for patterns and identified 10 key archetypes. Among these influencer profiles are: the Authority, the influencer who is expert in connecting topic areas and can package insights into a meaningful bundle for his audience;the Insider, who finds alliances to build the market story he needs to tell and pushes the industry forward; andthe Agitator, who always looks for ways to stir the pot and push conversations to new heights.Filled with fun facts and tips about what motivates the different types of online influencers,The Many Faces of Influence infographic is a simple guide to understanding how to be a part of their community and knowing the best ways to engage them. Explore this inforgraphic to learn more about The Many Faces of Influence... Via Lauren Moss
|
The Museum of Modern Art launches Seeing Through Photographs, its first massive open online course for a general audience, available on Coursera starting February 10, 2016. Using works from MoMA’s expansive collection as a point of departure, the course encourages participants to look critically at photographs through the diverse ideas, approaches, and technologies that inform their making. Seeing Through Photographs can be found at coursera.org/learn/photography.
![How to Disappear from the Internet [INFOGRAPHIC] | Design, Science and Technology | Scoop.it](https://img.scoop.it/7Y9rC3ugylCOUYu3n49W_Dl72eJkfbmt4t8yenImKBVvK0kTmF0xjctABnaLJIm9)
The amount of information available online has gotten out of hand. Everything about our lives, from where where we went to high school and what we ate for breakfast this morning, can be found on the internet. If you think that's bad, think about children growing up today – their entire lives, from infancy through middle school, are being documented by their parents on Facebook! Privacy just doesn't exist online anymore; it can take drastic measures to delete ourselves from the internet, but here's a step-by-step guide for those who want to do so... Via Lauren Moss
![45 Amazing Social Media Facts of 2013 [Infographic] | Design, Science and Technology | Scoop.it](https://img.scoop.it/-80FLjnbZ8zgaLTCTqO1Djl72eJkfbmt4t8yenImKBVvK0kTmF0xjctABnaLJIm9)
Everyday Social Media numbers are growing, and here are 45 facts in an infographic by Digital Insights. A few of the statistics: 40% of marketers use Google+, 70% desire to learn more and 67% plan to increase Google+ activities 42% update their profile information regularly on LinkedIn Every second 8000 users like some or other photo on Instagram 80% of total Pinterest’s pins are re-pins 4.2 billion people use mobile device to access social media sitesVia Lauren Moss
Lee Werrell's curator insight,
September 20, 2013 9:33 AM
Even more amazing facts; and these can be useful for marketers! 
Bruce McDuffee's curator insight,
September 25, 2013 11:30 PM
Interesting stats, but for the business marketer, does it convert to revenue?
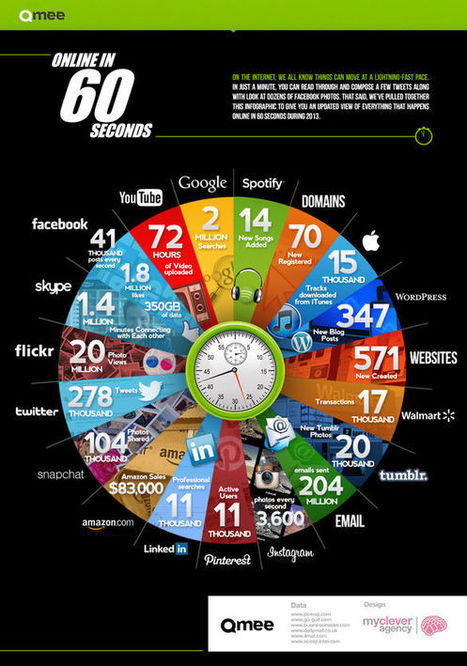
Early last year we learned that one hour of YouTube is uploaded every second. It was a bracing reminder of just how many people are spending their time online simultaneously.
Created by rewards site Qmee, the infographic "Online In 60 Seconds" is a pie chart that shows off the sheer amount of online activity that takes place every single minute. The amount of YouTube videos uploaded has already increased from January 2012's 60 hours per minute to 72. Additionally, over 1.8 million things are liked on Facebook, and 278 thousand bon mots tweeted. Not depicted in the chart: the amount of work that is going undone while all of these items are being viewed. Via Lauren Moss

Angie Thao's curator insight,
May 15, 2016 7:06 PM
Single Chart Infograph: Like: Good visual, good data. Dislike: Can be a little overwhelming to look at.
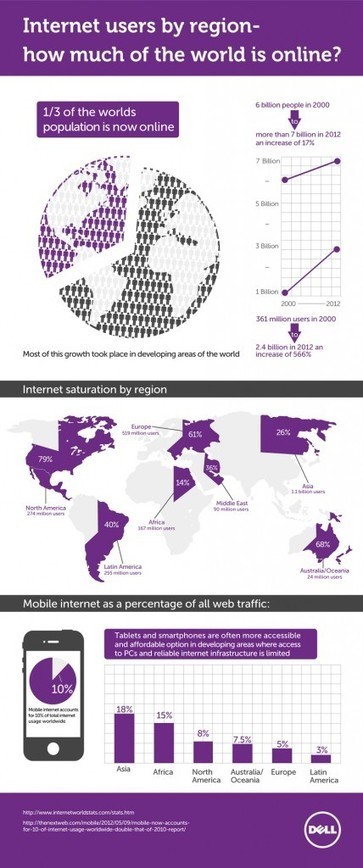
A showcase of the best infographics from around the web (Internet Users By Region – How Much Of The World Is Online? A look at the current statistics of worldwide internet usage. Via Lauren Moss

's comment July 11, 2013 5:05 PM
Interesting facts. Thanks for sharing them with us...
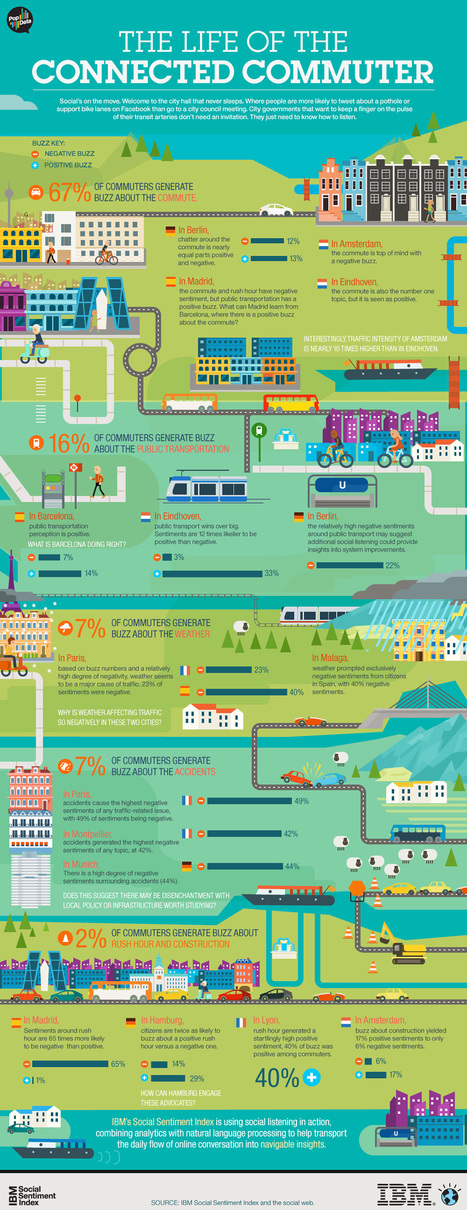
Social’s on the move. Welcome to the city hall that never sleeps—where people are more likely to tweet about a pothole or support bike lanes on Facebook than go to a city council meeting. City governments that want to keep a finger on the pulse of their transit arteries don’t need an invitation. They just need to know how to listen, which will help them figure out the life of the connected commuter, as depicted in our graphic with IBM. Via Lauren Moss

Help Traduzioni 's curator insight,
May 29, 2013 1:02 PM
Social's on the move. Welcome to the city hall that never sleeps...
Infographics have become extremely popular online tools to create a compelling visualization by conveying a message much more effectively than a stand alone written article or photo. They must be well-designed and appealing to the eye; these 10 online tools below will aid you in creating infographics to champion your cause and convey a visual message... Via Lauren Moss

We are living in a new age of austerity. Environmentalism is no longer just a crunchy cause, but also a corporate mandate. Simple is good.
As exhibit A, check out Hewlett Packard's new computers released yesterday. In fact, it's practically impossible not to check them out: HP has coughed up a number of machines at the same time, and they're filling the homepages of many a gadget site... Via Martin Gysler
|


