


Do you want to kick your social media marketing up a notch, but you don’t know where to start? Visual content could be the answer.
Via janlgordon
Get Started for FREE
Sign up with Facebook Sign up with X
I don't have a Facebook or a X account


 Your new post is loading... Your new post is loading...
Do you want to kick your social media marketing up a notch, but you don’t know where to start? Visual content could be the answer. Via janlgordon 

janlgordon's comment,
November 3, 2016 10:47 AM
Thank you @Stan Smith @Ricard Lloria @Jenne & @Mehdi BH :-)
janlgordon's comment,
November 4, 2016 10:36 AM
Thank you @Antonios Bouris :-)
janlgordon's comment,
November 8, 2016 10:44 AM
Thank you @Negotei Elena :-)
Sign up to comment
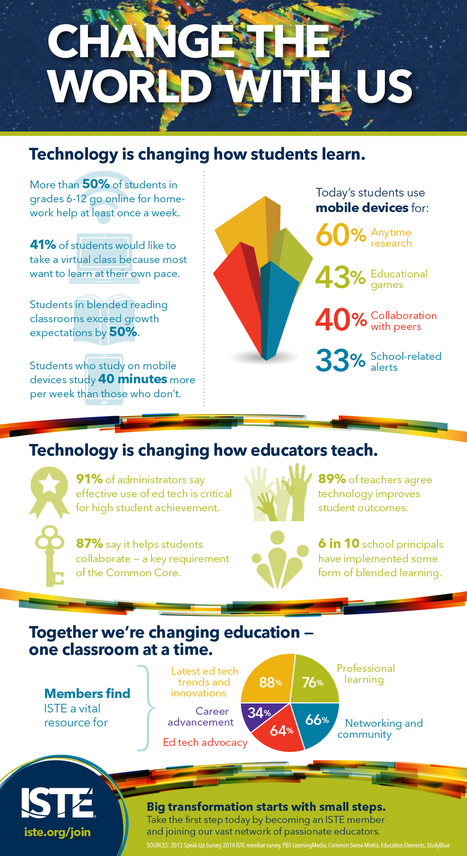
Educational technology is making a huge impact on how students learn, how teachers teach and how education is done.

SA Fia Z's curator insight,
September 29, 2015 4:15 AM
Technology is and will continue to revolutionize education. I 
Tom Georgiev's curator insight,
September 29, 2015 5:18 PM
Lets Change The World Together , I'll Show You How to Make Things Right Again, Gain Trust and Fix any Problems We Face! Give Me Your Hand and Trust Me!

The Blended and Online Assessment Taxonomy Infographic presents types of activities and grading and feedback criteria to help you plan better assessments.

Viljenka Savli (http://www2.arnes.si/~sopvsavl/)'s curator insight,
February 25, 2015 3:09 AM
A clear and useful list of activities for assessment. 
Karen Molineaux's curator insight,
February 25, 2015 8:06 PM
This is a pretty good infographic that serves as a guide when trying to decide what type of activity and grading to do when addressing Bloom's... 
Tom Stream's curator insight,
March 1, 2015 12:44 PM
As we move to more online learning opportunities, we are going to have to evaluate our evaluation tools.
A promo piece (2:26) for my ISTE11 Presentation "A Picture is Worth 1000 Words: Infographics as a Creative Assessment". Royalty free music from Soundzabound.com…

flea palmer's curator insight,
December 12, 2014 4:44 AM
I love the idea of students creating infographics for presenting work and this short video illustrates the many contexts where this method could be really effective. 
Antonio H. Martín's curator insight,
December 12, 2014 7:21 AM
Vídeo-resumen de la ponencia de Kathy Schorck "A Picture is Worth 1000 Words: Infographics as a Creative Assessment" (Una imagen vale más que 1000 palabras: Infografía como una evaluación creativa).
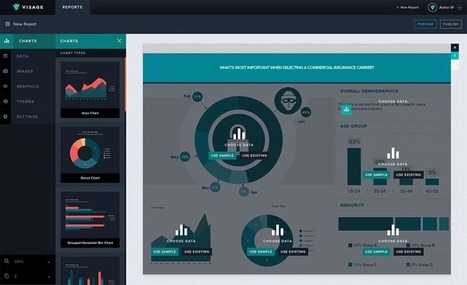
Visage makes infographics easy, and they customize palettes for free. If you’re an art director at a media outlet, odds are you have to assign and commission each data visualization you publish. That gets time-consuming, even when the graphic in question is nothing but a small pie chart running alongside a feature story. Visage, a newly launched platform, provides custom templates for graphics. There are myriad tools on the market that do this (for a gander at 30 of them, check out this list), but Visage is the latest, and it's gaining traction with designers at Mashable, MSNBC, and A&E... Via Lauren Moss
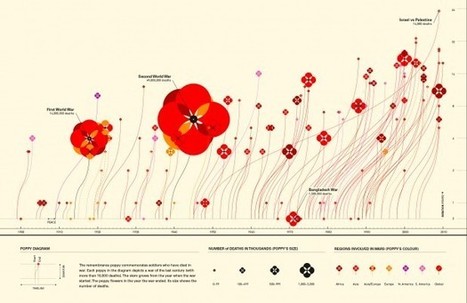
Often, complex stories are more easily communicated, understood and, ultimately, remembered, when they take visual form. Aside from data and words, infographics use images and graphical representations. Those key elements – images, words and numbers – operate as a system for simplifying information, revealing new patterns, and producing new knowledge in various fields. In fact, they might not have always been called “infographics,” but info/data-based visualizations have always been around. Via Lauren Moss
Whether you own a large online business or a small booming startup, we’re sure you are actively using social media to give your brand the right dose of exposure and get the message across to your targeted audience. This is a great list of useful cheatsheets for people who want to benefit more from social media marketing.
These 35 cheatsheets cover tips for Facebook, Twitter, Google+ and Pinterest, so you can better understand how to market via social media and how to design pages and content for optimum exposure. Via Lauren Moss

Mark Palmer's curator insight,
July 18, 2013 8:47 AM
A really good collection of social media infographics. 
Kika Lensvelt's curator insight,
July 19, 2013 7:35 AM
cheatsheets Facebook, Twitter, Google+ & Pinterest 
Stephen Dale's curator insight,
July 20, 2013 8:20 AM
Heavily biased towards brands and marketing, but some useful data nevertheless. Personally, I'd like to see more examples of how social media is being used for personal development, collaboration and knowledge sharing.

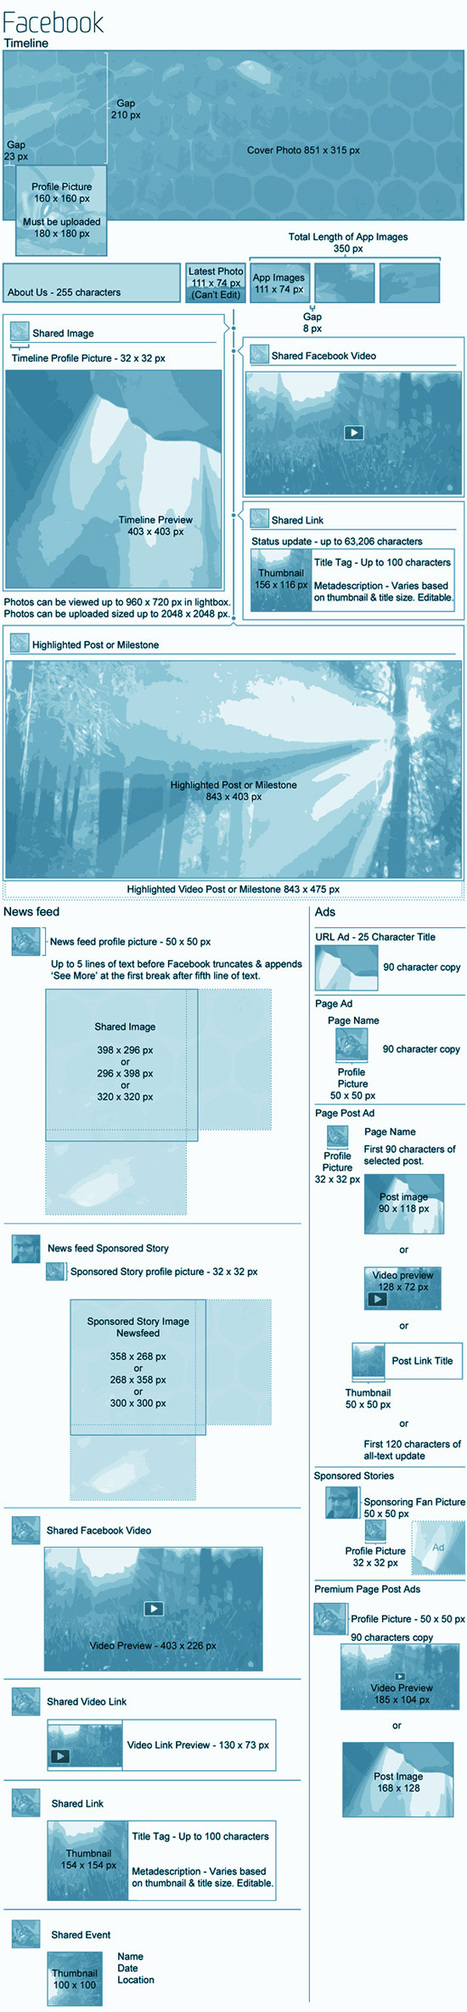
Like all new technology, social media changes fast. Just trying to keep your head around all of the different platforms, how to approach them and, of course, how to design for them can be a full time job. Social media has proven itself as a crucial component of a brand’s marketing mix, but with the many different platforms, it can be very difficult to put forth a consistent brand image online. The [Ridiculously Exhausitive] Social Media Design Blueprint features all of the major design dimensions for all of the major platforms, including Facebook, Twitter, Google+, LinkedIN, YouTube, Pinterest and the most recent entry, Instagram. Via Lauren Moss

Two Pens's curator insight,
May 30, 2013 1:31 PM
How to keep up with all those pesky design requirements on FB,LI, Twitter, etc. Thank you, somebody! 
MESODEV's curator insight,
May 31, 2013 4:01 AM
Voilà une infographie utile plutôt que de rechercher sans cesse les bonnes dimensions ! 
Therese Matthys's curator insight,
June 6, 2013 10:05 AM
Is your company consistent with its brand image online across all channels?
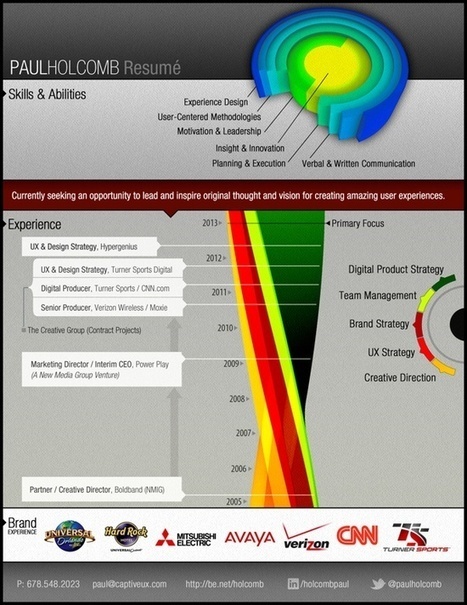
Infographics have become extremely popular online tools to create a compelling visualization by conveying a message much more effectively than a stand alone written article or photo. They must be well-designed and appealing to the eye; these 10 online tools below will aid you in creating infographics to champion your cause and convey a visual message... Via Lauren Moss

Ken Dickens's curator insight,
April 19, 2013 1:54 PM
Company's are creating infographics to tell their story. Individuals are doing the same to get hired. Shouldn't non-profits be doing this too? Yes, you should. Find a Photoshop Volunteer and make this happen! -Ken

Sonya Nikolova's curator insight,
June 30, 2013 3:01 AM
Because in the current stagnated job market, you have to stand out!

Baiba Svenca's curator insight,
February 15, 2013 5:51 AM
A neat presentation on infographics, appropriate for beginners and students who just want to start with their first infographic. The slideshow gives the definition, types and examples of various infographics. 
Warren Williams's curator insight,
February 16, 2013 5:04 PM
Good for beginners to understand where and how to start
Who knew? Infogr.am, a tool that allows you to create infographics, now allows you to include videos in your infographics...with the caveat they must come from YouTube or Vimeo. For more information check out this post from Richard Byrne! Via Beth Dichter
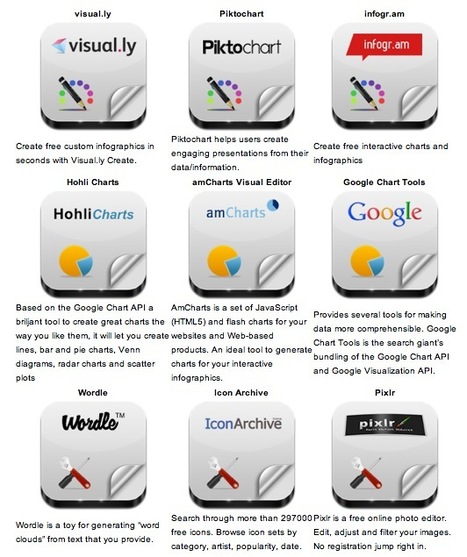
Robin Good: Here is a handy short guide to nine free infographic creation tools that can be utilized to create enticing visuals, word charts and data-based infographics without having special technical skills.
Useful. 8/10
Check them all out: http://www.infographicsarchive.com/create-infographics-and-data-visualization/
(Unearted by Andres Taborga) Via Robin Good

Sahana Chattopadhyay's curator insight,
May 4, 2015 11:59 PM
Infographics are great tools to present curated and focused content from a specific perspective. |
"Even if you’re not a graphic designer, you can quickly and easily create attractive marketing-driven infographics for your website and social media feeds..." Via Jessica Kelly

Jessica Kelly's curator insight,
February 4, 2016 6:57 PM
This helpful post helps you think about the kinds of things you can show off graphically, as well as some good ways to do so.
![What's the carbon footprint of the Internet? [Infographic] | Design, Science and Technology | Scoop.it](https://img.scoop.it/aNn9VgqhUBgovEsoWYVBrDl72eJkfbmt4t8yenImKBVvK0kTmF0xjctABnaLJIm9)
What is the carbon footprint of one single Google search? How about a single email? These and many other questions are presented in the following infographic... Via Lauren Moss
![How To Find Openly Licensed Educational Resources You Can Use [Infographic] | Design, Science and Technology | Scoop.it](https://img.scoop.it/UEhtZjmMpwB5jMfdGK4baTl72eJkfbmt4t8yenImKBVvK0kTmF0xjctABnaLJIm9)
Most of us turn to the internet when we are looking for resources to use for a presentation, report or article. The internet holds the key to so many robust resources.

Suzanne's curator insight,
February 17, 2015 5:02 AM
Every language teacher and student should contribute to make this a powerful resource concept. Language is an instrument; use it, take care of it, share it. 
Dean Mantz's curator insight,
February 18, 2015 11:15 AM
Thanks to @Dennis T OConnor for sharing this infographic on finding and identifying open source education resources. 
Iolanda Bueno de Camargo Cortelazzo's curator insight,
February 19, 2015 12:00 PM
Bastante úteis estas informações para professores e gestores educacionais.
From
circos

How To Succeed Visually * Learning Curve Protects The Niche WHEN You Get In. Via Martin (Marty) Smith

What Does It Take To Be A Teacher? Infographic shows that teachers’ realities are growing increasingly complex.

Steve Vaitl's curator insight,
May 16, 2014 12:05 PM
Interesting information about teachers. I can't help but wonder in light of what we know regarding how we learn, what does this say about US education? 
Niki Davis's curator insight,
May 19, 2014 6:16 AM
Looks too certain to me - there must be enormous difficulties in measuring this across cultures, contexts and other aspects of these rapidly evolving ecosystems.
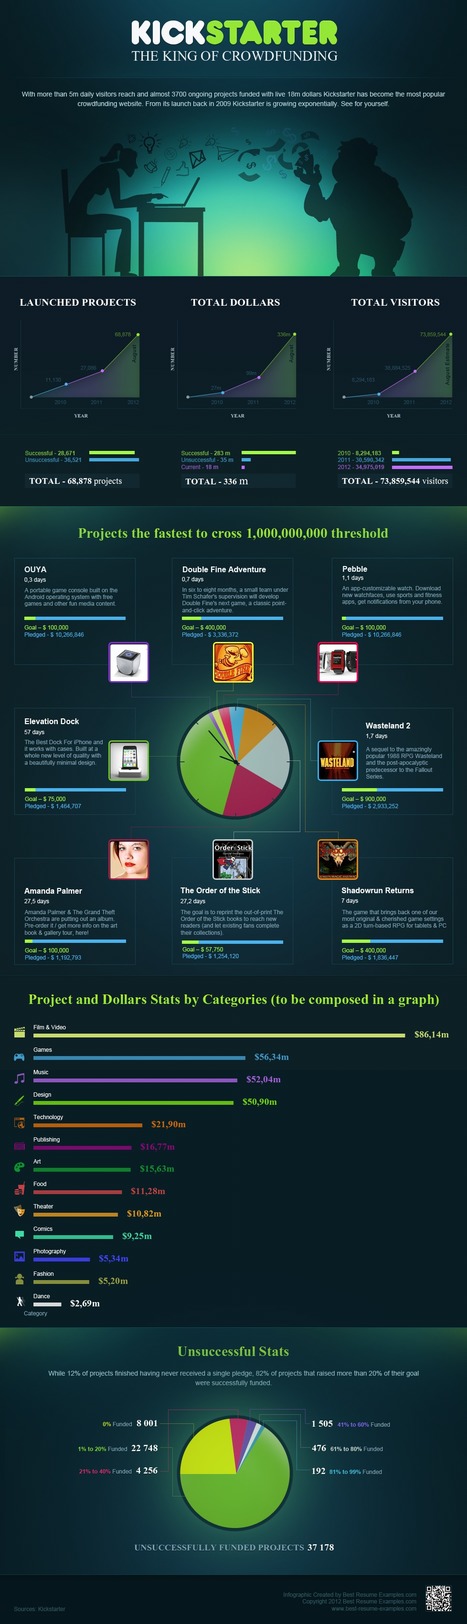
Crowdfunding is on the rise, and Kickstarter is leading the pack. Not only is the trend increasing but, it I’ve noticed that the word “kickstart” has replaced some of the actual terms used when referring to other areas of crowdfunding.
Kickstarter Stats: over 5 million daily visitors3700 ongoing projects funded$18 Million of fundingMultiple projects cross the $1 million thresholdFilm and Video, Games, Music, and Technology are the largest CategoriesVia Lauren Moss

Iron Dane Richards's comment,
September 23, 2013 8:19 AM
In my latest book on business credit it discusses the value of crowd-funding and Indigogo as they will fund anything unlike Kickstarter that specializes in Media oriented endeavors.

Martin (Marty) Smith's comment,
September 23, 2013 10:21 AM
Good insight from Iron Dane Richards. Easier to create a sure takeaway from Indigogo too since they will let campaigns increase the house take and walk away with something where Kickstarter is all or nothing. Either the campaign meets its goals or it gets nothing. 42% of the campaigns on Kickstarter meet their goals and most campaigns are funded at $10,000 or below.

Brett.Ashley.Crawford's curator insight,
October 28, 2013 12:18 PM
Nonprofits are also looking to crowdfunding -- but it has a dark underbelly as well.
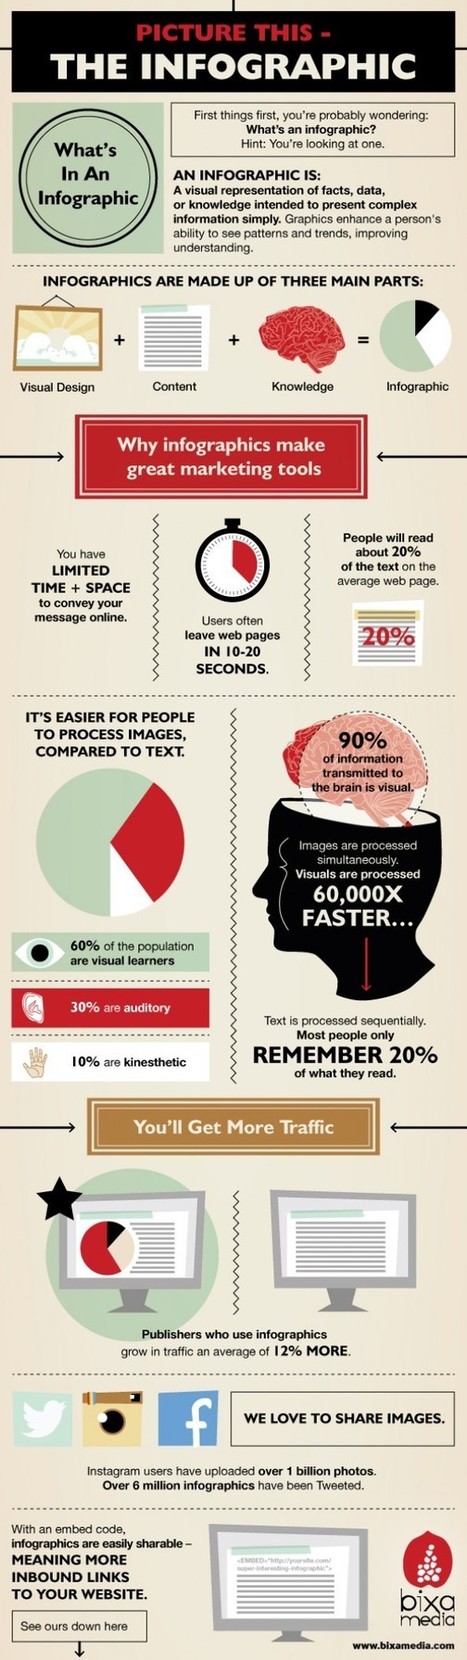
A picture is worth a thousand words, and Californian digital marketing agency, Bixa Media, have illustrated (pun intended) by creating an infographic about the importance of… well, infographics.
Based on the company’s research and insights, they found that visual data is absorbed 60,000x faster than text and people will only read about 20% of the text on a page. Via Lauren Moss
Infographics have become extremely popular online tools to create a compelling visualization by conveying a message much more effectively than a stand alone written article or photo. They must be well-designed and appealing to the eye; these 10 online tools below will aid you in creating infographics to champion your cause and convey a visual message... Via Lauren Moss
Infographics are changing the way we share information, so we thought it would be a good idea to gather 12 essential ones that would help marketers and businesses understand what’s currently taking place in the online world as well as make better use of the tools we have at our disposal. Via Lauren Moss
Data is everywhere and well-designed data graphics can be both beautiful and meaningful. As visualizations take center stage in a data-centric world, researchers and developers spend much time understanding and creating better visualizations. But they spend just as much time understanding how tools can help programmers and designers create visualizations faster, more effectively, and more enjoyably.
As any visualization practitioner will tell you, turning a dataset from raw stuff in a file to a final result in a picture is far from a single-track, linear path. Rather, there is a constant iteration of competing designs, tweaking and evaluating at once their pros and cons. The visualization research community has recognized the importance of keeping track of this process.
Read the complete article to learn more about the future of the practice and the tools that enable designers to create thoughtful infographics and visualizations... Via Lauren Moss
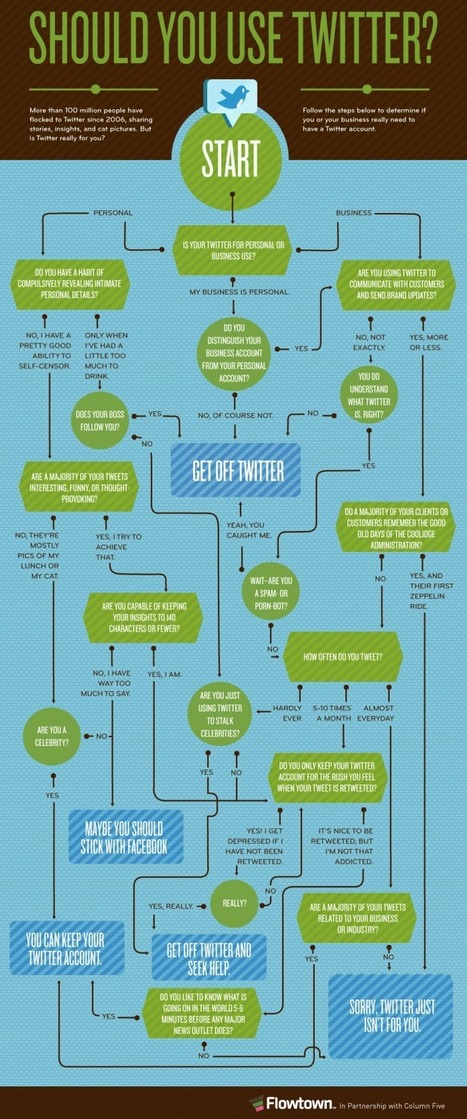
We're all already using Twitter it seems. But should we? This flowchart answers the big question: should you use Twitter? Via Gust MEES

Ed Bonhaus's curator insight,
January 14, 2013 1:43 PM
After following this flow chart, I've discovered that I should continue using Twitter.
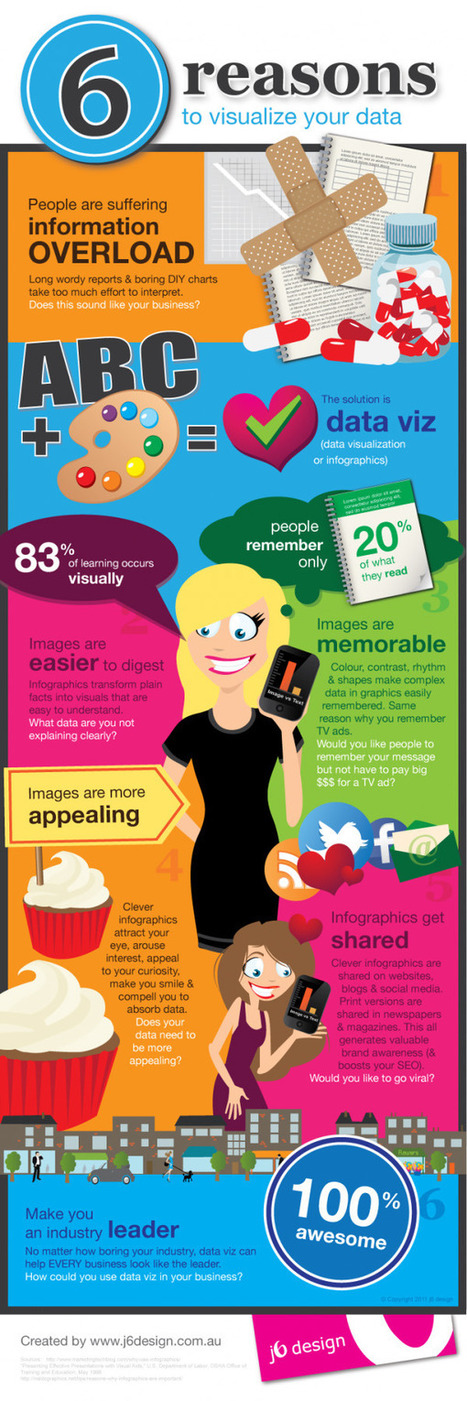
This piece was posted by Loren Sorenson for Hubspot, I selected it because as she says "If you aren’t prepared for the visual content revolution, you may be left in the dust.
Not convinced? Let's take a look at exactly how visual contentis positively contributing to marketing strategies -- it may just give you the push you need
"Learn why visual content is a critical part of your content creation strategy.
Here are some highlights:
**People remember only 20% of what they read
**83% of learning is visual
Condenses and Explains Large Amounts of Information
**Today, there is too much information on the Internet you have about 3 seconds to catch someone’s eyes so they'll consume your information.
Gives Your Brand an Identity
**Visual content draws people in, letting viewers better understand your brand's identity
Drives User Engagement
**If you've ever read a book with a child, you probably know they find pictures more interesting than words; but are adults really that different?
Selected by Jan Gordon covering "Content Curation, Social Business and Beyond"
Read full article here: [http://bit.ly/Ifujbp] Via janlgordon
janlgordon's comment,
April 11, 2012 3:21 PM
Beth Kanter
Thank you for adding me to the wiki and for your kind words, it's greatly appreciated. Yes this is the conversation of the moment so to speak. I'm sure your presentation was amazing. Would love to hear it if you have a replay. 
Beth Kanter's comment,
April 11, 2012 10:08 PM
Jan: There's a link in the wiki to the live stream of the session - and a lot of notes and resources ... I love this topic! I'm holding myself back from created another scoop.it on it ...
janlgordon's comment,
April 13, 2012 10:05 PM
Beth Kanter
Thanks for looking forward to seeing this info. Knowing you, I can imagine that you want to start another scoopit on this topic but it's not necessary because you're already doing a wonderful job covering it now. |


