Design, Science and Technology
45.7K views | +4 today
Design, Science and Technology
#ideas #design #science #technology #inspiration #media #information
Your new post is loading...
Rescooped by Antonios Bouris from visualizing social media
Scoop.it!

How to Optimize Your Blog for Content Distribution

How to Optimize Your Blog for Content Distribution | Design, Science and Technology | Scoop.it

Good content is great to have, but it doesn’t mean much if no one sees it. You’re putting in all the work; you want all the shares, media pickup, and unique visitors you can get.

If you’re running a blog, are you sure it’s optimized for distribution? Even in this modern Web-publishing era, too many blogs are woefully behind the times: broken social counters, no CTAS, the list goes on. To make sure you’re publishing the right way, check out these tips to optimize your blog for content distribution...


Via Lauren Moss
Marco Favero's curator insight, July 31, 2015 2:57 AM

aggiungere la vostra comprensione ...

Carlos Rodrigues Cadre's curator insight, July 31, 2015 9:50 AM

adicionar sua visão ...

La pluma digital's curator insight, October 28, 2016 3:04 AM
Buenos trucos para optimizar la distribución de contenidos en un blog
Rescooped by Antonios Bouris from Must Design
Scoop.it!

Website Design Projects Timeline From Research To Testing [infographic]

Website Design Projects Timeline From Research To Testing  [infographic] | Design, Science and Technology | Scoop.it
This great infographic takes you through the initial engagement stages for new website design work, through research, landing page design, coding, validation onto final launch and search engine optimi

Via Martin (Marty) Smith
Martin (Marty) Smith's curator insight, February 7, 2014 12:06 AM

Cool way to visualize web design process and true to my experience of creating more than 100 websites.

Katja Tschimmel's curator insight, February 14, 2014 2:35 PM

Design Thinking applied to Web Sites. Very nice graphic!

Rescooped by Antonios Bouris from visual data
Scoop.it!

Schematic of Structures: Charting History's Most Significant Works of Architecture

Schematic of Structures: Charting History's Most Significant Works of Architecture | Design, Science and Technology | Scoop.it

Yet another creation has rolled off the powerhouse infographics assembly line over at Pop Chart Lab, and this time, the indefatigable taxonomizers of alcohols and famous quotes have turned their attention to works of architecture.

The Schematic of Structures organizes what the designers describe as "90 eminent edifices erected and perfected throughout history." Arranged by height, the infographic lines up some of the greatest works envisioned and built by man since prehistory, from the Neolithic Cairn of Barnenez and the Parthenon to more modern creations like London's Gherkin and the Burj Khalifa.


Via Lauren Moss
No comment yet.
Rescooped by Antonios Bouris from Curation, Social Business and Beyond
Scoop.it!

6 Reasons to Visualize Your Data in the Age of Distraction

6 Reasons to Visualize Your Data in the Age of Distraction | Design, Science and Technology | Scoop.it

This piece was posted by Loren Sorenson for Hubspot, I selected it because as she says "If you aren’t prepared for the visual content revolution, you may be left in the dust.


Not convinced? Let's take a look at exactly how visual contentis positively contributing to marketing strategies -- it may just give you the push you need


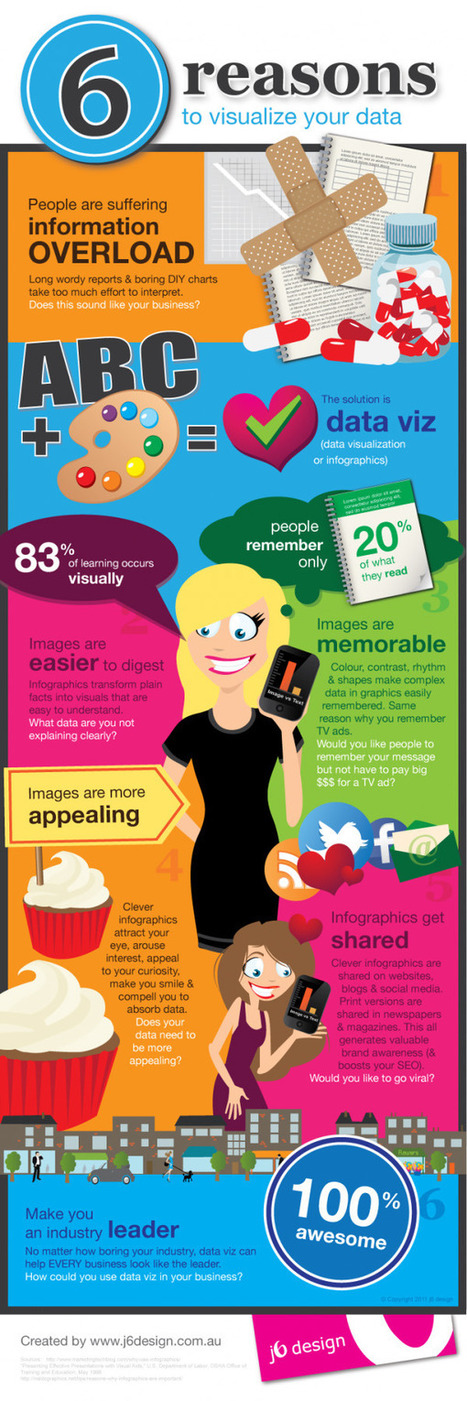
"Learn why visual content is a critical part of your content creation strategy.


Here are some highlights:


**People remember only 20% of what they read


**83% of learning is visual


Condenses and Explains Large Amounts of Information


**Today, there is too much information on the Internet you have about 3 seconds to catch someone’s eyes so they'll consume your information.


Gives Your Brand an Identity


**Visual content draws people in, letting viewers better understand your brand's identity


Drives User Engagement


**If you've ever read a book with a child, you probably know they find pictures more interesting than words; but are adults really that different?


Selected by Jan Gordon covering "Content Curation, Social Business and Beyond"


Read full article here: [http://bit.ly/Ifujbp]


Via janlgordon
janlgordon's comment, April 11, 2012 3:21 PM
Beth Kanter
Thank you for adding me to the wiki and for your kind words, it's greatly appreciated. Yes this is the conversation of the moment so to speak. I'm sure your presentation was amazing. Would love to hear it if you have a replay.
Beth Kanter's comment, April 11, 2012 10:08 PM
Jan: There's a link in the wiki to the live stream of the session - and a lot of notes and resources ... I love this topic! I'm holding myself back from created another scoop.it on it ...
janlgordon's comment, April 13, 2012 10:05 PM
Beth Kanter
Thanks for looking forward to seeing this info. Knowing you, I can imagine that you want to start another scoopit on this topic but it's not necessary because you're already doing a wonderful job covering it now.