

Research and publish the best content.
Get Started for FREE
Sign up with Facebook Sign up with X
I don't have a Facebook or a X account
Already have an account: Login

E-Learning-Inclusivo (Mashup)
1.1M views |
+25 today

 Your new post is loading...
 Your new post is loading...
Your new post is loading...


luiy's curator insight,
January 20, 2014 10:01 AM
As our governments and businesses become increasingly flush with information, more and bigger data are becoming available from across the globe. Increasingly, investigative reporters need to know how to obtain, clean, and analyze “structured information” in this digital world. Here is a list of resources to get you started, but we want to keep updating our community with the best resources available. Do you know of a great data tutorial we haven't listed, perhaps in a language other than English? Help us keep this resource guide comprehensive by sending your favorite resource to: kate.willson (at) gijn (dot) org. |
Through a series of interviews with journalists and developers working at the BBC and Financial Times plus some key players outside of major newsrooms, Liz Hannaford aims to find out about data journalism’s special role today.
|


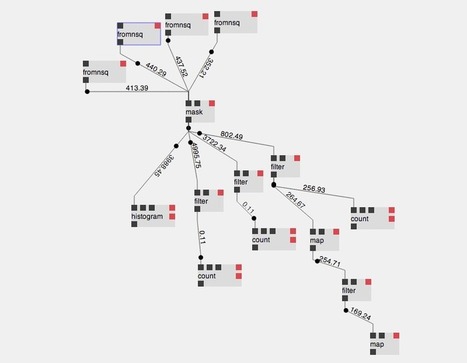
INTRODUCING STREAMTOOLS: A GRAPHICAL TOOL FOR WORKING WITH STREAMS OF DATA
New and open source from the New York Times R&D Lab.
We see a moment coming when the collection of endless streams of data is commonplace. As this transition accelerates it is becoming increasingly apparent that our existing toolset for dealing with streams of data is lacking. Over the last 20 years we have invested heavily in tools that deal with tabulated data, from Excel, MySQL, and MATLAB to Hadoop, R, and Python+Numpy. These tools, when faced with a stream of never-ending data, fall short and diminish our creative potential.
In response to this shortfall we have created streamtools—a new, open source project by the New York Times R&D Lab which provides a general purpose, graphical tool for dealing with streams of data. It offers a vocabulary of operations that can be connected together to create live data processing systems without the need for programming or complicated infrastructure. These systems are assembled using a visual interface that affords both immediate understanding and live manipulation of the system.
"In response to this shortfall we have created streamtools—a new, open source project by the New York Times R&D Lab which provides a general purpose, graphical tool for dealing with streams of data. It offers a vocabulary of operations that can be connected together to create live data processing systems without the need for programming or complicated infrastructure. These systems are assembled using a visual interface that affords both immediate understanding and live manipulation of the system."