
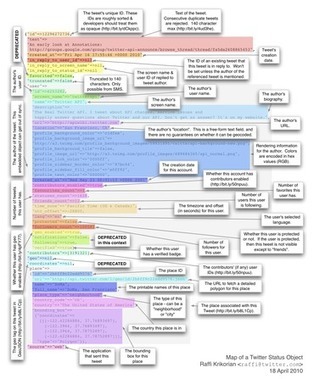

Just because you only see 140 characters doesn't mean that Twitter isn't getting complicated behind the scenes. Here's how status objects are evolving.
Via luiy
Get Started for FREE
Sign up with Facebook Sign up with X
I don't have a Facebook or a X account


 Your new post is loading...
 Your new post is loading...
Your new post is loading...
Just because you only see 140 characters doesn't mean that Twitter isn't getting complicated behind the scenes. Here's how status objects are evolving. Via luiy 

luiy's curator insight,
July 2, 2014 5:10 AM
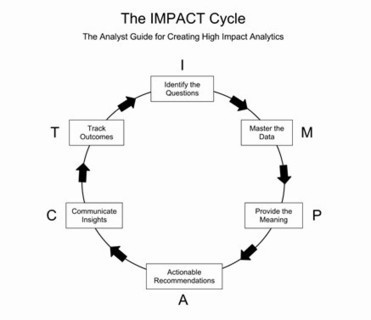
I. Identify the question. In a non intrusive way, help your business partner identify the critical business question(s) he or she needs help in answering. Then set a clear expectation of the time and the work involved to get an answer.
M. Master the data.This is the analyst’s sweet spot—assemble, analyze, and synthesize all available information that will help in answering the critical business question. Create simple and clear visual presentations (charts, graphs, tables, interactive data environments, and so on) of that data that are easy to comprehend.
P. Provide the meaning. Articulate clear and concise interpretations of the data and visuals in the context of the critical business questions that were identified.
A. Actionable recommendations. Provide thoughtful business recommendations based on your interpretation of the data. Even if they are off-base, it’s easier to react to a suggestion that to generate one. Where possible, tie a rough dollar figure to any revenue improvements or cost savings associated with your recommendations.
C. Communicate insights. Focus on a multi-pronged communication strategy that will get your insights as far and as wide into the organization as possible. Maybe it’s in the form of an interactive tool others can use, a recorded WebEx of your insights, a lunch and learn, or even just a thoughtful executive memo that can be passed around.
T. Track outcomes. Set up a way to track the impact of your insights. Make sure there is future follow-up with your business partners on the outcome of any actions. What was done, what was the impact, and what are the new critical questions that need your help as a result?
luiy's curator insight,
February 4, 2014 11:21 AM
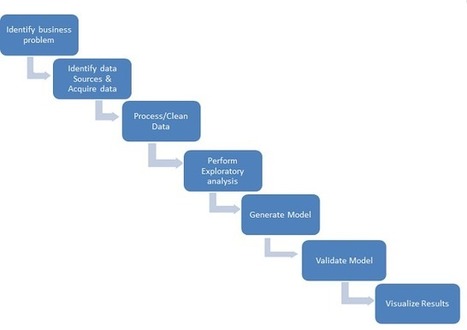
After going through the overview of tools & technologies needed to become a Data scientist in my previous blog post, in this post, we shall understand how to tackle a data analysis problem. Any data analysis project starts with identifying a business problem where historical data exists. A business problem can be anything which can include prediction problems, analyzing customer behavior, identifying new patterns from past events, building recommendation engines etc. |
luiy's curator insight,
September 11, 2014 10:29 AM
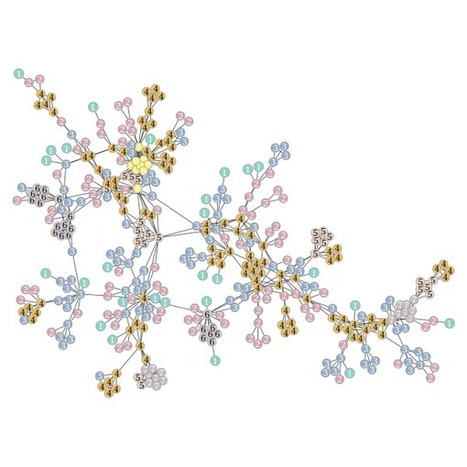
An extensive array of features is included, such as support for arbitrary vertex, edge or graph properties, efficient "on the fly" filtering of vertices and edges, powerful graph I/O using the GraphML, GML and dot file formats, graph pickling, graph statistics (degree/property histogram, vertex correlations, average shortest distance, etc.), centrality measures, standard topological algorithms (isomorphism, minimum spanning tree, connected components, dominator tree, maximum flow, etc.), generation of random graphs with arbitrary degrees and correlations, detection of modules and communities via statistical inference ,,,,,,
luiy's curator insight,
February 28, 2014 6:26 AM
Circos is a software package for visualizing data and information. It visualizes data in a circular layout — this makes Circos ideal for exploring relationships between objects or positions. There are other reasons why a circular layout is advantageous, not the least being the fact that it is attractive.
Circos is ideal for creating publication-quality infographics and illustrations with a high data-to-ink ratio, richly layered data and pleasant symmetries. You have fine control each element in the figure to tailor its focus points and detail to your audience. Circos is flexible. Although originally designed for visualizing genomic data, it can create figures from data in any field. If you have data that describes relationships or multi-layered annotations of one or more scales, Circos is for you.
Circos can be automated. It is controlled by plain-text configuration files, which makes it easily incorporated into data acquisition, analysis and reporting pipelines (a data pipeline is a multi-step process in which data is analyzed by multiple and typically independent tools, each passing their output as the input to the next step). |


.. an interesting map of what's going on behind your Twitter stream. As it turns out, there is quite a bit of data associated with not just you as a user, but also with every tweet that you post to the service.