

Research and publish the best content.
Get Started for FREE
Sign up with Facebook Sign up with X
I don't have a Facebook or a X account
Already have an account: Login

E-Learning-Inclusivo (Mashup)
1.1M views |
+10 today

 Your new post is loading...
 Your new post is loading...
Your new post is loading...
Journalists are increasingly doing their own number-crunching and reporting on it, rather than asking scientists to tell them what they’ve found. Call it data journalism, or computational journalism, or knowledge-base journalism, it’s a hot field these days, with top journalism schools offering dual degrees and specialized training in computer programming and statistical analysis. Some journalists have also begun calling for the adoption of aspects of the scientific method, particularly the practices of collaborating, sharing data, citing reference sources, and aiming for reproducibility. There are fundamental differences between science and journalism that make complete co-option of scientific method infeasible, even undesirable. Via Andrea Naranjo 
|

Mlik Sahib's curator insight,
March 5, 2014 7:00 PM
"This free five-module online introductory course gives you the essential concepts, techniques, and skills to effectively work with data and produce compelling data stories under tight deadlines. Comprised of video lectures, tutorials, assignments, readings, and discussion forums, this course is open to anyone in the world with an Internet connection who wants to tell stories with data." |


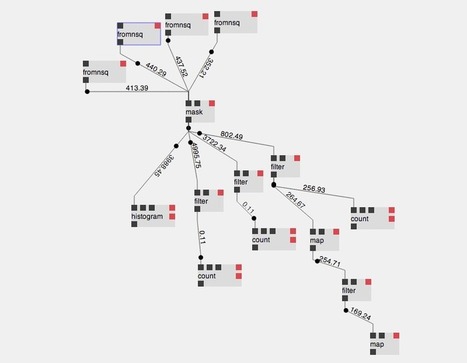
INTRODUCING STREAMTOOLS: A GRAPHICAL TOOL FOR WORKING WITH STREAMS OF DATA
New and open source from the New York Times R&D Lab.
We see a moment coming when the collection of endless streams of data is commonplace. As this transition accelerates it is becoming increasingly apparent that our existing toolset for dealing with streams of data is lacking. Over the last 20 years we have invested heavily in tools that deal with tabulated data, from Excel, MySQL, and MATLAB to Hadoop, R, and Python+Numpy. These tools, when faced with a stream of never-ending data, fall short and diminish our creative potential.
In response to this shortfall we have created streamtools—a new, open source project by the New York Times R&D Lab which provides a general purpose, graphical tool for dealing with streams of data. It offers a vocabulary of operations that can be connected together to create live data processing systems without the need for programming or complicated infrastructure. These systems are assembled using a visual interface that affords both immediate understanding and live manipulation of the system.
"In response to this shortfall we have created streamtools—a new, open source project by the New York Times R&D Lab which provides a general purpose, graphical tool for dealing with streams of data. It offers a vocabulary of operations that can be connected together to create live data processing systems without the need for programming or complicated infrastructure. These systems are assembled using a visual interface that affords both immediate understanding and live manipulation of the system."