Visual Design and Presentation in Education
13.1K views | +0 today
Follow
Visual Design and Presentation in Education
Tips, Tools and Tricks for Presentations, Digital and Graphic Design in Higher Education
Your new post is loading...

Popular Tags

Current selected tag: 'infographics'. Clear
Rescooped by Kim Flintoff from Public Relations & Social Marketing Insight
Scoop.it!

17 Fantastic Infographic Generators!

17 Fantastic Infographic Generators! | Visual Design and Presentation in Education | Scoop.it
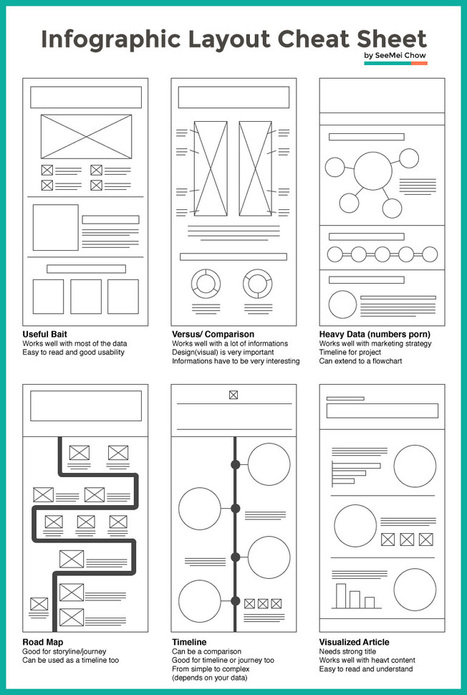
Data is crucial. However, displaying a chunk of plain data can be monotonous. Infographics visualize plain data and make it visually more appealing. Data turned into infographic has a higher potential to go viral and be effective. While many of us are designers who can design amazing infographs, Infographic Generators can come in handy to Designers and non-designers alike. They can be a time saving resource. So here is a list of 17 fantastic Infographic Generators I compiled together:...
Via Jeff Domansky
Willem Kuypers's curator insight, March 9, 2015 2:37 AM

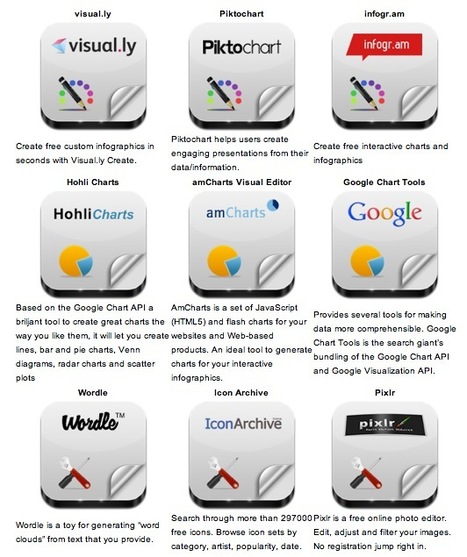
J'utilise de plus en plus les info-graphiques. Ce site aide à les créer pour ceux qui sont moins doués en graphisme.

Fran Bozarth's curator insight, March 11, 2015 2:31 PM

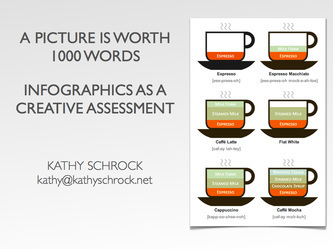
This could spice up just about any presentation - student or instructor. 

Monica S Mcfeeters's curator insight, March 20, 2015 11:49 PM

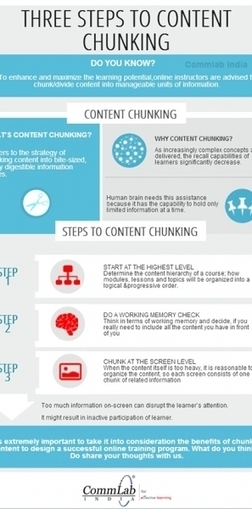
Here are links for to help with creating info-graphs.

Rescooped by Peter Mellow from Digital Presentations in Education
Scoop.it!

Sprites - create infographics on the web

Sprites - create infographics on the web | Visual Design and Presentation in Education | Scoop.it
Sprites is a free tool for creating beautiful animated infographics for the Web.

Via Baiba Svenca
Erin Walsh's curator insight, May 22, 2014 2:55 PM

Infographics are a great way to grab someones attention and get your information out there

Marja Oilinki's curator insight, May 23, 2014 5:21 AM

Toistaiseksi Pro-versiona ilmainen melkoisen intuitiivisesti toimiva ja tyylikäs infografiikkatyökalu Sprites sopii yhteen Googlen työkalujen kanssa. Esimerkiksi tilaston muuttaminen havainnolliseen muotoon on todella helppoa. 

BI Media Specialists's curator insight, May 30, 2014 7:54 AM

I love an infographic!  Such a great way to get information across to visual learners.  Right now you can sign up for a free pro account!  

Rescooped by Kim Flintoff from Digital Presentations in Education
Scoop.it!

46 Tools To Make Infographics In The Classroom

46 Tools To Make Infographics In The Classroom | Visual Design and Presentation in Education | Scoop.it

Infographics are interesting–a mash of (hopefully) easily-consumed visuals (so, symbols, shapes, and images) and added relevant character-based data (so, numbers, words, and brief sentences).

The learning application for them is clear, with many academic standards–including the Common Core standards–requiring teachers to use a variety of media forms, charts, and other data for both information reading as well as general fluency...


Via Baiba Svenca
maite collados's curator insight, January 14, 2014 11:24 AM

Las infografías son una herramienta muy útil por su factor visual: en poco espacio y de forma visulamente agradable y atrayente, engloba datos y relaciona conceptos.

ManufacturingStories's curator insight, July 30, 2014 7:50 AM

For more resources on Social Media & Content Curation visit http://bit.ly/1640Tbl


Cynthia Day's curator insight, July 30, 2014 2:45 PM

apps

Rescooped by Kim Flintoff from 21st Century Learning and Teaching
Scoop.it!

The Ultimate Guide To Infographics

The Ultimate Guide To Infographics | Visual Design and Presentation in Education | Scoop.it

They allow students to comprehend, interpret, and analyze complex information in a quick and clear manner. This combined with the brain research to support why infographics are so effective gives teachers a powerful new tool to use for teaching and learning.


Via Nik Peachey, Gust MEES
No comment yet.
Rescooped by Kim Flintoff from All Infographics
Scoop.it!

10 Reasons How Bad Infographic can Damage Your Business | All Infographics

10 Reasons How Bad Infographic can Damage Your Business | All Infographics | Visual Design and Presentation in Education | Scoop.it
Infographics on How creating Bad Info graphics can damage and ruin business health and marketing concept forever on Business marketing on information graphics...

Via Christino Martin
No comment yet.
Rescooped by Kim Flintoff from Data Visualization Topics
Scoop.it!

Use infographics to keep your website visitors interested

Use infographics to keep your website visitors interested | Visual Design and Presentation in Education | Scoop.it
It is important to keep your blog readers and website visitors interested in the information you share. Coming up with creative and eye-catching ways to grab the attention of online users is extremely crucial in having people visit and return to ...

Via Siarhei Mardovich
No comment yet.
Scooped by Learning Futures
Scoop.it!

Infographics

Infographics | Visual Design and Presentation in Education | Scoop.it

A useful and very comprehensive resources around using and creating infographics. Books, online tutorials and resources and a range of samples. 

No comment yet.
Rescooped by Kim Flintoff from Public Relations & Social Marketing Insight
Scoop.it!

Layout Cheat Sheet for Infographics : Visual arrangement tips

Layout Cheat Sheet for Infographics : Visual arrangement tips | Visual Design and Presentation in Education | Scoop.it

Infographic layouts refer to the arrangement of your visual elements and your content. When you begin working on a piece of infographic, you should have a story to tell hence, you will need to select a layout that best suits your story. Using the right layout will ensure good readability and convey your message well.


We have put together a cheat sheet for your quick reference to the right arrangement to use, here are six common ones you can quickly work with....


Via Jeff Domansky
Tony Guzman's curator insight, March 2, 2015 3:29 PM

This article helps you determine the best layout for the type of infographic you may be creating.

David Baker's curator insight, March 13, 2015 1:21 AM

This is a great tool to share with my seminar teachers whose final project for the year is an infographic.

Monica S Mcfeeters's curator insight, March 20, 2015 11:51 PM

HERE ARE SOME HELPFUL LAYOUTS TO SPEED UP YOUR DESIGNS.

Rescooped by Peter Mellow from Leadership in Distance Education
Scoop.it!

How to Chunk Content for eLearning Infographic | e-Learning ...

How to Chunk Content for eLearning Infographic | e-Learning ... | Visual Design and Presentation in Education | Scoop.it
One of the main concepts that leads to successful e-Learning course design is information chunking. But what is chunking? Why is it embedded in the world of instructional design? And what kind of chunking strategies can an ...

Via Dr. Susan Bainbridge
Marisa Maiocchi's curator insight, January 8, 2014 4:31 AM

Interesante. Pienso que, de algún modo, quienes trabajamos con e-learning ya estamos haciendo "chunking" hace tiempo. 

Noland Hoshino's comment, January 25, 2014 1:43 PM
Like I've always said about the flood of information people put out -- you've got to "Chunk it"
Noland Hoshino's comment, January 25, 2014 1:43 PM
Like I've always said about the flood of information people put out -- you've got to "Chunk it"
Scooped by Learning Futures
Scoop.it!

10 Fun Tools To Easily Make Your Own Infographics - Edudemic

10 Fun Tools To Easily Make Your Own Infographics - Edudemic | Visual Design and Presentation in Education | Scoop.it
People love to learn by examining visual representations of data. That's been proven time and time again by the popularity of both infographics and Pinterest. So what if you could make your own infographics?
Gürkan Tabak's curator insight, July 17, 2013 5:10 AM

Make your infographics. You can try which one you want...

Rescooped by Kim Flintoff from visual data
Scoop.it!

6 Deadly Sins of Data Visualization

6 Deadly Sins of Data Visualization | Visual Design and Presentation in Education | Scoop.it
You’re a marketer. And half your job is marketing your ideas. Like it or not, you have to be good at proving your point, ‘cause being right isn’t enough. You have to justify the time, dollars and effort required for your internet marketing campaign. In the meeting room struggle for resources, your best weapon is great data presentation.

Events tell a story. and people more easily follow a story told visually than one told verbally.

Want to get better? Avoid these six gigantic visualization mistakes...


Via Lauren Moss
No comment yet.
Rescooped by Kim Flintoff from Learning & Technology News
Scoop.it!

How To Design Your Own Infographics

How To Design Your Own Infographics | Visual Design and Presentation in Education | Scoop.it

Infographics seem to be a real trend today, with new ones popping up daily on all sorts of subjects. From mortgages to ice cream, estimating software to infographics about infographics, there is very little now that hasn't been 'visualised' in some form. Many people don't realise that the term information graphic, or 'infographic' was first coined over 100 years ago, with the Coxcomb chart by Florence Nightingale in 1857 being one of earliest recognised examples. They have existed in many forms since then, but only in the past few years have infographics developed into the art form we know today.


Via Nik Peachey
No comment yet.
Rescooped by Kim Flintoff from 21st Century Tools for Teaching-People and Learners
Scoop.it!

9 Step Guide to Creating Marvelous Infographics

9 Step Guide to Creating Marvelous Infographics | Visual Design and Presentation in Education | Scoop.it
“Information can be useful -- and even beautiful -- but only when it’s presented well.” So how do you go about creating such an amazing infographic? I have 9 steps that may just help you.


Read more:

http://blog.mindjet.com/2012/07/9-step-guide-to-creating-marvelous-infographics/


Via Gust MEES
No comment yet.
Rescooped by Kim Flintoff from Presentation Tools
Scoop.it!

Infographic Builders: 9 Free Tools To Create Great Visual Charts

Infographic Builders: 9 Free Tools To Create Great Visual Charts | Visual Design and Presentation in Education | Scoop.it

Robin Good: Here is a handy short guide to nine free infographic creation tools that can be utilized to create enticing visuals, word charts and data-based infographics without having special technical skills.


Useful. 8/10


Check them all out: http://www.infographicsarchive.com/create-infographics-and-data-visualization/ ;


(Unearted by Andres Taborga)


Via Robin Good
Trude Burnett's curator insight, May 9, 2014 3:48 PM

Good tools to make Infographics

becool's curator insight, May 4, 2015 6:40 AM

Infographics voor zij die er nog steeds zot van zijn.

Sahana Chattopadhyay's curator insight, May 4, 2015 11:59 PM

Infographics are great tools to present curated and focused content from a specific perspective.