Business Improvement and Social media
23.3K views | +0 today
Your new post is loading...
Rescooped by Ricard Lloria from Great Infographics
Scoop.it!

The Anatomy of an Optimized Facebook Ad #Infographic

The Anatomy of an Optimized Facebook Ad #Infographic | Business Improvement and Social media | Scoop.it
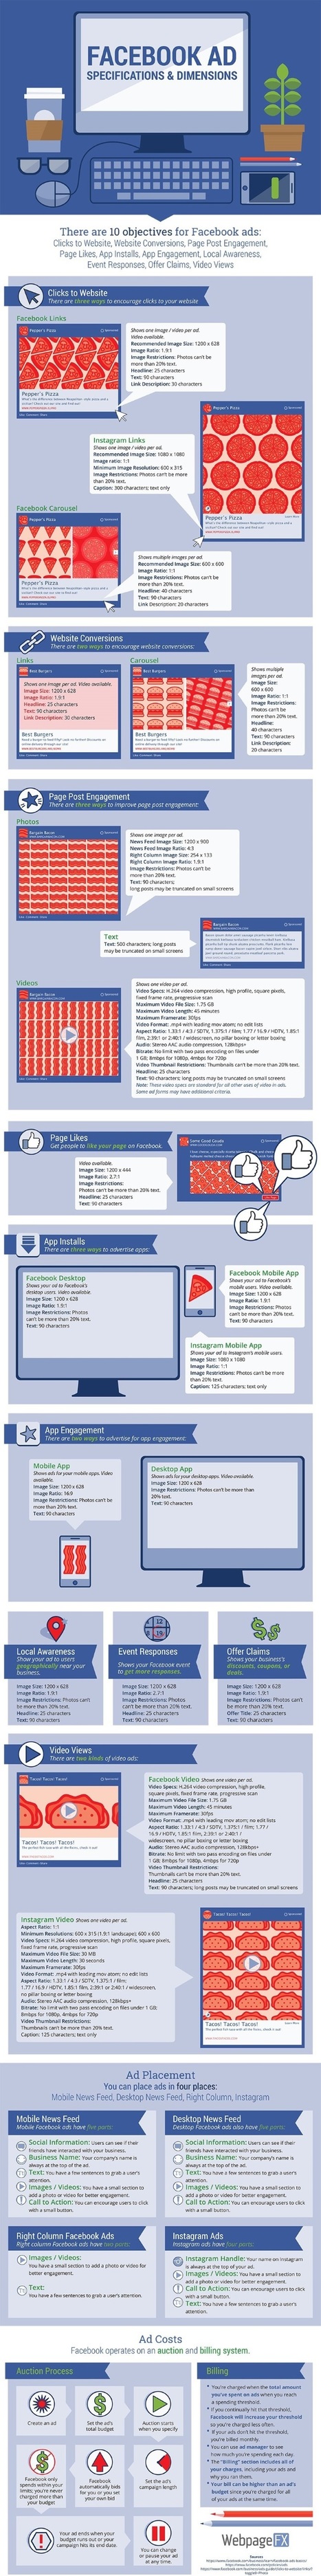
When it comes to creating a Facebook ad for your business, there are a lot of different things to consider.

How much text should you include? What dimensions should your images and videos be? What's the difference between a desktop News Feed ad, a mobile News Feed ad, a right column ad, and an Instagram ad? How does the auction and billing system work?

Via Brian Yanish - MarketingHits.com, malek, John van den Brink
Ricard Lloria's insight:

Everything you wanted to know about Facebook Ads in a miniaturized infographic guide

malek's curator insight, March 11, 2016 10:39 AM

Everything you wanted to know about Facebook Ads in a miniaturized infographic guide

Stephania Savva, Ph.D's curator insight, March 11, 2016 11:15 AM

Everything you wanted to know about Facebook Ads in a miniaturized infographic guide

Jean-Pierre Blanger's curator insight, March 13, 2016 11:05 AM

Everything you wanted to know about Facebook Ads in a miniaturized infographic guide

Rescooped by Ricard Lloria from visual data
Scoop.it!

An Infographic Guide To Color Psychology

An Infographic Guide To Color Psychology | Business Improvement and Social media | Scoop.it

Have you ever had difficulty choosing colours for a new scheme or wondered why we associate some colours with good luck and others with danger? Welcome to The Complete Infographic Guide to Colour Psychology.

Discover all you ever needed to know about the psychology behind colours and why their meaning differs depending on which country you’re from…


Via Lauren Moss
Bad Spoon's curator insight, August 26, 2013 2:14 AM

De nombreux articles et infographies existent sur le sujet, mais cette infographie est probablement la plus intéressante que j'ai vue jusqu'à présent

taniaATenthuse.me's comment, August 29, 2013 11:34 AM
Great infographic, thank you for sharing Lauren. It reminds us of the significant influence that society and cultural values have on so many different aspects of our lives.
taniaATenthuse.me's curator insight, August 29, 2013 11:59 AM

This Colour Psychology infographic reminds us of the significant influence that societal and cultural values have on so many different aspects of our lives. The implications are so many. This guide can be really useful for entrepreneurs and freelancers when they decide on logo and branding. 

Rescooped by Ricard Lloria from visualizing social media
Scoop.it!

An Infographic Guide to Content Marketing

An Infographic Guide to Content Marketing | Business Improvement and Social media | Scoop.it

Content marketing is of much more importance today than it ever has been.

Did you know that 90% of all organizations use content marketing in their efforts now? This infographic is filled with vital information on content marketing such as – 91% of B2B marketers use content marketing and 86% B2C marketers are making use of it.

Content marketing is here to stay and these stats definitely prove the fact.


Via Lauren Moss
debbieleven's curator insight, June 12, 2013 7:02 AM

US stats but 62% of companies outsource their content marketing - I was surprised at that.

Kaye Blum's curator insight, June 12, 2013 7:04 PM

A clear infographic explaining the significance of content marketing, especially for B2B.

Delton Allred's curator insight, July 2, 2013 11:33 AM

Interesting infographic! The information it provides is a good way to capture the process of creating and writing content.


Don't like the graphics so much.


Rescooped by Ricard Lloria from visualizing social media
Scoop.it!

What Makes A Successful Social Media Campaign (Infographic)

What Makes A Successful Social Media Campaign (Infographic) | Business Improvement and Social media | Scoop.it

Social media marketing is a great way to reach out to your loyal customers and find new leads. Check out the infographic below to discover the benefits of advertising on social networks and some advanced tips for bolstering your brand.


Via Lauren Moss
Kaye Blum's curator insight, June 3, 2013 9:24 PM

A simple infographic with usage stats and some clear Dos and Don'ts for social media marketing.

Jim Doyle's curator insight, June 4, 2013 6:07 AM

What will make your Social Media Campaign be successful.

Deb Nystrom, REVELN's curator insight, June 5, 2013 12:57 PM

Handy Do's and Don'ts, and the Infographic to make it so scan, read easy. Implementation is the key!  ~  D

Rescooped by Ricard Lloria from visualizing social media
Scoop.it!

A Visual Guide to Twitter

A Visual Guide to Twitter | Business Improvement and Social media | Scoop.it

This infographic provides a visual guide and a brief synopsis of different uses for Twitter.

It includes information about how Twitter can be used as a tool for information, customer service, networking, business management and website management.


Via Lauren Moss
Carlos Castaño's comment, June 6, 2013 9:48 AM
I'm agree with you.
Alexander Abramov's comment, June 6, 2013 10:23 AM
You put it very nicely
Jim Doyle's curator insight, June 6, 2013 8:45 PM
A Visual Guide to Twitter
Rescooped by Ricard Lloria from visualizing social media
Scoop.it!

An 8-Step Social Media Marketing Strategy For Brands [INFOGRAPHIC]

An 8-Step Social Media Marketing Strategy For Brands [INFOGRAPHIC] | Business Improvement and Social media | Scoop.it

Platforms such as Twitter and Facebook come with a pretty steep learning curve – certainly when used for business marketing – and to maximize return on investment it’s essential that you implement a winning strategy.


It's important for businesses to select the right individuals to manage social channels and to use specific metrics to analyze feedback and success.

Learn more about social media strategies from this infographic, which presents an 8-step strategy for successful social media marketing...


Via Lauren Moss
Bart van Maanen's curator insight, March 28, 2013 6:15 AM

Goed en overzichtelijk stappenplan om naar de social media marketing te kijken. Met de waardevolle toevoeging (die nogal eens wordt vergeten door bedrijven) dat het bij alle automatisering wel om mensen gaat en niet om logo's.

Rich Rawdin's comment, March 29, 2013 12:11 PM
Great content. Show me more !
AndySernovitz's curator insight, May 3, 2013 6:59 AM


It's important for businesses to select the right individuals to manage social channels and to use specific metrics to analyze feedback and success.

Learn more about social media strategies from this infographic, which presents an 8-step strategy for successful social media marketing...

Rescooped by Ricard Lloria from visualizing social media
Scoop.it!

How to Build the Perfect Tweet: an infographic guide

How to Build the Perfect Tweet: an infographic guide | Business Improvement and Social media | Scoop.it

A tweet only has 140 characters; with such a small amount of characters at your disposal, you need to make the most of each one.


The perfect tweet consists of three main parts: your message, a link and blank space. Here's what each section should include:

Message:

Call to action: Tell readers what you want them to do.Hashtags: Include one or two to increase your reach among people who don't follow you.Tone: Use your own voice, but in a professional way.Format: Use a mix of headlines, questions and statistics to drive clicks and retweets.

Link:

Shortened URLs: Bit.ly links earn the most retweets.

Blank space:

Leave room for at least 20 characters at the end of your tweet so retweeters can add comments. 

Check out the graphic for more information...


Via Lauren Moss
ParadigmGallery's comment, March 6, 2013 12:21 PM
ugh..come a long way but always more to learn...space at end of tweet for added comments and RT's ....WOW
Rescooped by Ricard Lloria from visualizing social media
Scoop.it!

The Essential Guide To Digital Etiquette

The Essential Guide To Digital Etiquette | Business Improvement and Social media | Scoop.it

Presenting the FWD IRL FAQ: quick links to your most pressing Internet- and phone-related concerns.


Click the questions to be linked to the column where this question was originally answered. We've selected MANY, but not all, of the original questions answered, representing the 122 questions answered over the past year. (You may have to scroll down a question or two, but it'll be there!)


Via Lauren Moss
Lauren Moss's curator insight, December 29, 2012 6:49 PM

A fairly comprehensive list of questions and answers that pertain to social media best practices and digital communication...

Rescooped by Ricard Lloria from MarketingHits
Scoop.it!

The eCommerce Guide to Social, Local & Mobile [Infographic]

The eCommerce Guide to Social, Local & Mobile [Infographic] | Business Improvement and Social media | Scoop.it

SoLoMo, short for “social-local-mobile,” is essentially the addition of local information to search engine results in order to capitalize on the increasing use of mobile devices.


SoLoMo has also evolved to include mobile-specific offers pushed out to consumers based on their current location. If you are among the growing population that now has smart phones, you have no doubt seen and even taken advantage of these kinds of offers.

In this infographic from Monetate, learn how SoLoMo is having an overall impact on traditional eCommerce, and how consumers are using their smartphones to access social and local sites which ultimately influence purchases. It also also touches on the showrooming effect, providing retailers a guide to making the most out of SoLoMo opportunities.


Via Lauren Moss, Brian Yanish - MarketingHits.com
No comment yet.
Rescooped by Ricard Lloria from visualizing social media
Scoop.it!

#Infographic: The Optimal Length for Every #SocialMedia Update

#Infographic: The Optimal Length for Every #SocialMedia Update | Business Improvement and Social media | Scoop.it
The optimal length for social media posts and all other forms of online content. Get best practices for tweets, posts, blogs, and more.

Via Lauren Moss
Paul Mendelsohn's curator insight, November 18, 2014 9:24 AM

Another great infographic on social media. This one on effective word count. Summary, to quote Shakespeare, "Brevity is the soul of wit."

Reeda Malik's curator insight, December 21, 2014 9:13 PM

Awesome representation of social media attention span metrics.

John Norman's curator insight, January 11, 2015 11:07 PM

Just when you think you're getting the hang of it someone tells you otherwise! No matter - we live and learn. Keep on trucking!

Rescooped by Ricard Lloria from visualizing social media
Scoop.it!

Social Media Image Size Guide [INFOGRAPHIC]

Social Media Image Size Guide [INFOGRAPHIC] | Business Improvement and Social media | Scoop.it

The basics of any social media account can be quickly mastered, but figuring out the heights and widths of all the images you will need to make your social outposts look awesome is a time-consuming and, unfortunately, often instantly forgettable business.

And it gets a heck of a lot more complicated when you start rolling out your Google+, LinkedIn and YouTube channels, and more.


Help is at hand, courtesy of this infographic from Raidious, which presents a one-stop social media spec guide for content designers.


Via Lauren Moss
Clovis Ferré's comment, August 10, 2013 5:49 AM
if you need even more details, check out this infographic too http://tentsocial.com/blog/bid/267887/The-Ridiculously-Exhaustive-Social-Media-Dimensions-Blueprint-INFOGRAPHIC
PHi-Solutions's curator insight, August 10, 2013 6:31 AM

Useful tool to help those getting started with Social. 

Kaye Blum's curator insight, August 12, 2013 5:42 AM

Handy...

Rescooped by Ricard Lloria from visualizing social media
Scoop.it!

What Makes A Successful Social Media Campaign (Infographic)

What Makes A Successful Social Media Campaign (Infographic) | Business Improvement and Social media | Scoop.it

Social media marketing is a great way to reach out to your loyal customers and find new leads. Check out the infographic below to discover the benefits of advertising on social networks and some advanced tips for bolstering your brand.


Via Lauren Moss
Kaye Blum's curator insight, June 3, 2013 9:24 PM

A simple infographic with usage stats and some clear Dos and Don'ts for social media marketing.

Jim Doyle's curator insight, June 4, 2013 6:07 AM

What will make your Social Media Campaign be successful.

Deb Nystrom, REVELN's curator insight, June 5, 2013 12:57 PM

Handy Do's and Don'ts, and the Infographic to make it so scan, read easy. Implementation is the key!  ~  D

Rescooped by Ricard Lloria from visualizing social media
Scoop.it!

The Social Media Dimensions Blueprint (Infographic)

The Social Media Dimensions Blueprint (Infographic) | Business Improvement and Social media | Scoop.it

Like all new technology, social media changes fast.

Just trying to keep your head around all of the different platforms, how to approach them and, of course, how to design for them can be a full time job.

Social media has proven itself as a crucial component of a brand’s marketing mix, but with the many different platforms, it can be very difficult to put forth a consistent brand image online.


The [Ridiculously Exhausitive] Social Media Design Blueprint features all of the major design dimensions for all of the major platforms, including Facebook, Twitter, Google+, LinkedIN, YouTube, Pinterest and the most recent entry, Instagram.


Via Lauren Moss
Two Pens's curator insight, May 30, 2013 1:31 PM

How to keep up with all those pesky design requirements on FB,LI, Twitter, etc. Thank you, somebody!

MESODEV's curator insight, May 31, 2013 4:01 AM

Voilà une infographie utile plutôt que de rechercher sans cesse les bonnes dimensions !

Therese Matthys's curator insight, June 6, 2013 10:05 AM

Is your company consistent with its brand image online across all channels?

Rescooped by Ricard Lloria from visualizing social media
Scoop.it!

26 Things to Note Before You Develop a Website – Infographic

26 Things to Note Before You Develop a Website – Infographic | Business Improvement and Social media | Scoop.it

If you are just getting started on the journey of developing your website, you may feel overwhelmed with all the things you need to figure out and plan before you even get started. There are definitely enough details to consider that it’s worth making a list so you don’t forget any of them. Or, instead of making your own list. This infographic from Pixaal showing the basic things to note before someone or company develop a website...


Via Lauren Moss
Jayne Courts's comment, April 24, 2013 6:51 AM
Actually Anthony I would. I have a pdf of this infographic and would use it to help any client through the web design process. I do have a proper 'pre-flight' checklist that I go through so that I am clear on what they actually want from their site and can incorporate any special requirements into the design process. It also helps clients know what they REALLY want - because many have a vague idea of what they want from a site - or far-flung ideas about design that work on paper but don't necessarily work on the internet. So using this infographic alongside a website 'plan' would help with the process I believe.
Laser Focus Coaching's comment, April 25, 2013 5:53 PM
Great point Jayne.
AndySernovitz's curator insight, May 3, 2013 6:44 AM

There are definitely enough details to consider that it’s worth making a list so you don’t forget any of them. Or, instead of making your own list. This infographic showing the basic things to note before someone or company develop a website...

Rescooped by Ricard Lloria from visual data
Scoop.it!

Creating Engaging & Sharable Graphics

Creating Engaging & Sharable Graphics | Business Improvement and Social media | Scoop.it

When it comes to creating graphics for visual social networks, there are a few key ideas you should keep in mind to increase your reach and engagement. Your audience wants to be educated. They want to be inspired.


Of course, depending on the network in which you are promoting your content, the visual itself may be the entire piece of content, thus making it equally as important as the content it contains. 

This is largely the case when it comes to social networks like Instagram, Pinterest and Vine. While all three allow for the option to link to more information in the comments, caption or description sections, the visual is the content for all intents and purposes since you can’t depend on someone clicking for more information.

When it comes to creating graphics for visual social networks, there are a few key ideas you should keep in mind to increase your reach...


Via Lauren Moss
Louise Robinson-Lay's curator insight, March 12, 2013 3:41 AM

Some great tips to keep in mind when creating graphics.

Rescooped by Ricard Lloria from visualizing social media
Scoop.it!

Facebook Cheat Sheet for Social Media Managers [infographic]

Facebook Cheat Sheet for Social Media Managers [infographic] | Business Improvement and Social media | Scoop.it


Social Media Managers are always on the lookout for ways to increase engagement within their brand’s Facebook page.

In a recent report, Lynchpin SEO compiled statistics on the types of posts that garnered the most comments, shares, and “likes,” for more than 1,500 brand pages on Facebook.


These stats reveal an array of interesting things about brand pages. For instance:

Updates with emoticons saw higher interaction rates than those with picturesPosts that contain the words “take,” “click,” “submit,” “check,” and “shop” experience significantly lower rates of interaction.


See the infographic for more— and always, do take everything you read with a pinch of salt...


Via Lauren Moss
Christine Harris-Smyth's curator insight, January 9, 2013 8:31 PM

Hmm - emoticons for higher interaction. Help me. I really dislike the little buggers. On the rest of the data - isolated data may need to be read in context with the type of posts. Seriously "win" indicates opportunity. No analysis of "free" or "sex".

PDDM's comment January 16, 2013 6:44 PM
We don't like 'em either but we use 'em. At least for now, data shows they work. The fresher the better right? Always trying to figure out a way to use Putnam haha
Janet Louise Stephenson's curator insight, May 3, 2013 10:28 PM

Create better posts on Facebook with these useful tips.

Rescooped by Ricard Lloria from visualizing social media
Scoop.it!

A Blogger's Guide to Publishing Infographics

A Blogger's Guide to Publishing Infographics | Business Improvement and Social media | Scoop.it
With plenty of different forms of advertising and publication forming over the past several years, many bloggers are looking for alternative ways to catch the eyes of their readers.
One of the best ways to do this is by creating infographics that summarize a topic or event in an aesthetically-pleasing fashion. By boiling down the subject material into an easy-to-digest format, you stand to gain much attention from those seeking refuge in an internet environment of information overload...
Via Lauren Moss
Mark Trinidad's comment, December 12, 2012 12:40 PM
amazing as always Lauren... infographics
Belinda Suvaal's curator insight, December 12, 2012 2:07 PM

Een goede #infographic is goud waard (IMHO: sommige infographics schieten hun doel voorbij door een overload aan feitjes en statistiekjes)

Lauren Moss's comment, December 13, 2012 2:19 AM
Thank you!