

WorldWide Carpets : David Hanauer design

 Your new post is loading...
 Your new post is loading...
Your new post is loading...
WorldWide Carpets : David Hanauer design 
No comment yet.
Sign up to comment
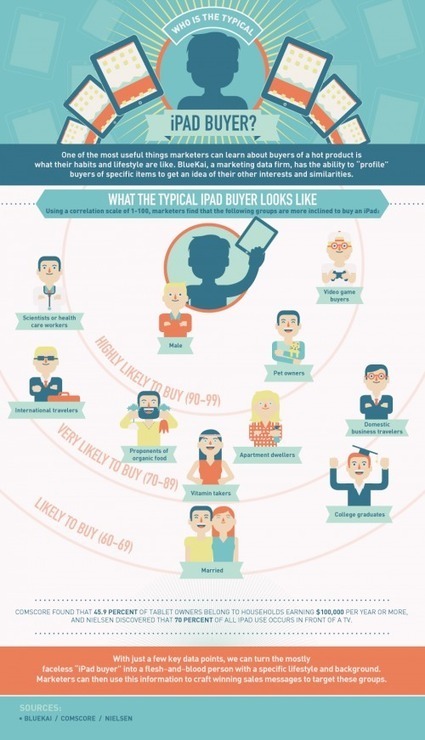
[Infographie] Portrait-robot de l’acheteur d’iPad ([Infographie] Portrait-robot de l’acheteur d’iPad | Websourcing.fr http://t.co/WCLVhxAy via @lionelroux...)...

It’s time for the annual best-of lists, so I thought you might enjoy this urbanist take on the year's best songs. It’s based on the recently released list of the year’s top singles from reviewers and critics at the music site Pitchfork. So yes, we're starting with a subjective assessment, one that is heavily skewed toward English language acts in the indie, alternative, and hip-hop genres. It's also admittedly one that's on occasion been mocked as out of touch or overly snobby. Still, it’s as useful a barometer of what’s hot at the leading edges of popular music as any. And for our purposes, it turns out to be quite amenable to locational analysis, too. Via Simon Decreuze
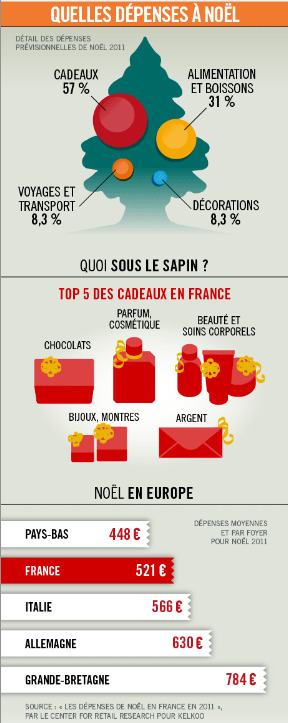
Infographie France Info, réalisée par WeDoData

Par Cameron Booth The latest in my series of transit map-style diagrams - this time, of the U.S. Highway system. That's U.S. Routes (like Route 66), not to be confused with the newer Interstate Highway system (I-5, I20, etc.). Without a doubt, this is the most complex map of this type I have attempted.
![Nouvel Obs : classement des écoles de commerces 2012 [design WeDoData] | Journalisme graphique | Scoop.it](https://img.scoop.it/mi0Xngqhow3QEW7RAyBsUDl72eJkfbmt4t8yenImKBVvK0kTmF0xjctABnaLJIm9)
Le classement des écoles de commerce 2012 : avec Challenges, magazine économique français en temps réel.
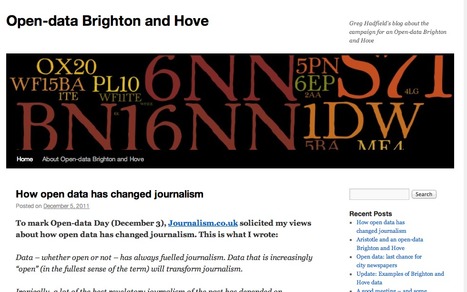
The UK's first open-data cities conference: April 2012...

La sélection de Nathan Yau, du site FlowingData

In authoritarian countries throughout the Middle East and North Africa, Western surveillance tools have empowered repression, allowing leaders to intercept e-mails and text messages, and monitor the whereabouts of citizens through their cell phones. Armed with this information, police in many of these countries now routinely confront dissidents with records of their messages and movements during arrest and torture, according to a 10-month investigation by Bloomberg News.
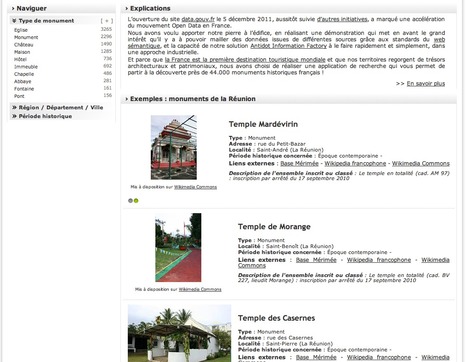
L’ouverture du site data.gouv.fr le 5 décembre 2011, aussitôt suivie d’autres initiatives, a marqué une accélération du mouvement Open Data en France.
|
|

|
Scooped by
Karen Bastien
January 2, 2012 1:43 PM
|
![Les secrets de la cuisine mondiale [dataviz] | Journalisme graphique | Scoop.it](https://img.scoop.it/xUCf5MsnDuOcymSMqzEfHjl72eJkfbmt4t8yenImKBVvK0kTmF0xjctABnaLJIm9)
The cultural diversity of culinary practice, as illustrated by the variety of regional cuisines, raises the question of whether there are any general patterns that determine the ingredient combinations used in food today or principles that...
|
|
Scooped by
Karen Bastien
January 2, 2012 9:33 AM
|

Quelle énergie !
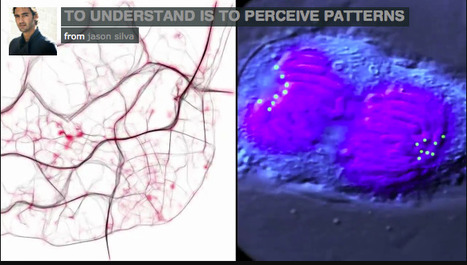
Research findings in data visualization captured, streamed, animated… beautified!
|
|
Scooped by
Karen Bastien
January 2, 2012 9:54 AM
|
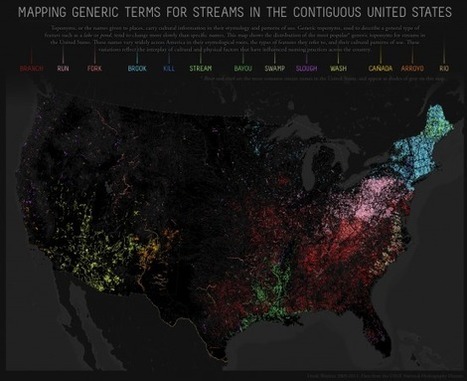
A map doing the rounds at the moment (thanks to a plug from flowingdata) is Derek Watkin’s brilliant map of “generic” terms for rivers in the United States (below).The map shows how different cultural and linguistic factors have influenced the naming of geographic features in the US. For example French settlers named the streams they encountered “bayous”.
|
|
Scooped by
Karen Bastien
December 26, 2011 12:47 PM
|
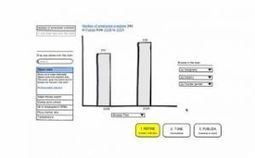
Le besoin de trouver, trier et mettre en valeur des données chiffrées prend de plus en plus d’importance dans la société de l’information. Partant de ce constat, la start-up QunB développe un moteur de recherche pour toutes les questions qui commencent par ”combien”.
|
|
Scooped by
Karen Bastien
December 26, 2011 8:48 AM
|

Readers shared their expectations about their job status, the future of the economy and the prospects for the next generation.
|
|
Scooped by
Karen Bastien
December 23, 2011 3:52 AM
|
![Et ton pays, il a quelle forme ? [Appli] | Journalisme graphique | Scoop.it](https://img.scoop.it/5vOUm73rh0If4RdOvDGjfzl72eJkfbmt4t8yenImKBVvK0kTmF0xjctABnaLJIm9)
Visualization of the interplay between sustainability and human development across the world.
The data used in this project are taken from the Human Development Report 2011 published by the United Nations Development Program that presents the Human Development Index and all its indicators.
|
|
Scooped by
Karen Bastien
December 22, 2011 10:54 AM
|

Our interactive reviews 2011 day-by-day but also captures running stories that defined the year.
|
|
Scooped by
Karen Bastien
December 22, 2011 8:40 AM
|
![Charbon : l'Asie en raffole [anim] | Journalisme graphique | Scoop.it](https://img.scoop.it/rdG9WGyaEZAn0J31C3gQMTl72eJkfbmt4t8yenImKBVvK0kTmF0xjctABnaLJIm9)
Global coal demand has almost doubled since 1980, driven by increases in Asia, where demand is up over 400% from 1980-2010. In turn, Asian demand is dominated by China; demand in China increased almost five-fold between 1980-2010 and accounted for 73% of Asia's consumption and almost half of coal consumption globally in 2010.
|
|
Rescooped by
Karen Bastien
from Datavisualisation & géopolitique
December 21, 2011 2:03 PM
|
|
|
Rescooped by
Karen Bastien
from Datavisualisation & géopolitique
December 21, 2011 7:13 AM
|
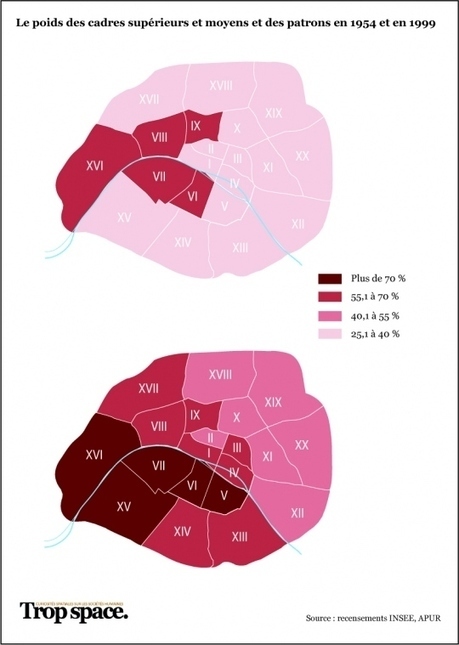
A Paris, les catégories sociales, les tranches d'âges, les métiers, les origines ethniques se côtoient, se croisent, se rencontrent.
|
|
Scooped by
Karen Bastien
December 21, 2011 4:11 AM
|
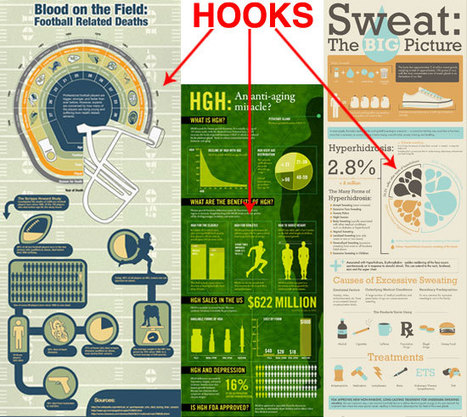
Since the dawn of the Internet, the demand for good design has continued to skyrocket. From Web 1.0 to Web 2.0 and beyond, designers have remained on their toes as they define the trends and expectations of our online universe. The Internet is a great designer’s playground, and online businesses are growing more and more appreciative of what can be gained from a bit of well-executed eye candy. Over the past two years, this fact has become the backbone of a growing trend in online marketing: the infographic.


![L'empreinte carbone de nos vies numériques [WeDoData] | Journalisme graphique | Scoop.it](https://img.scoop.it/BpDUUhsis-6pNCtXqJL1Ajl72eJkfbmt4t8yenImKBVvK0kTmF0xjctABnaLJIm9)
![Who Runs London ? [dataviz] | Journalisme graphique | Scoop.it](https://img.scoop.it/RSZtH6wR39vNoflz3Fr9nzl72eJkfbmt4t8yenImKBVvK0kTmF0xjctABnaLJIm9)

