 Your new post is loading...

|
Scooped by
Marteq
|
1. How do I organize my account?
2. What kind of data can I access?
3. Why should I set up goals?
4. What is a segment?
5. How can I find out more about my (not provided) keywords?
|
|
Scooped by
Marteq
|
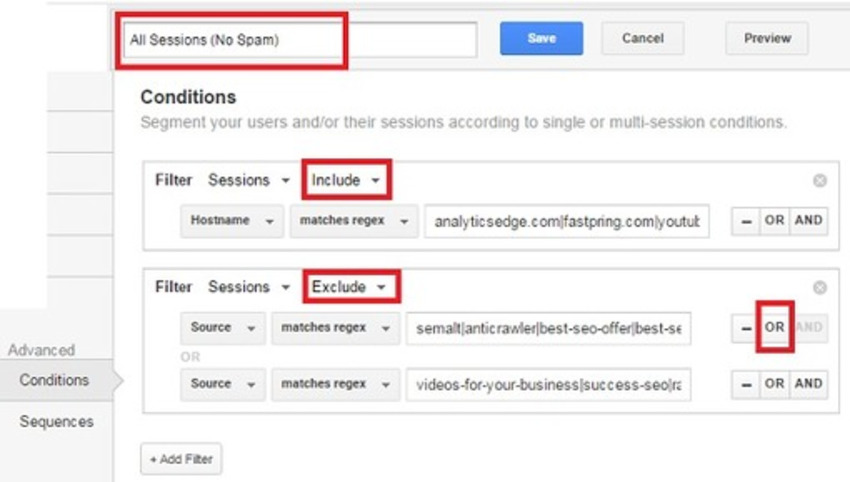
This is a PROVEN WORKING SOLUTION with filter expressions updated regularly! There are a lot of partial solutions and misinformation out there about clearing out so-called referral spam (and organic search and event spam too), so here’s the Definitive Guide to removing all of that junk! This article has been constantly updated since January 2015 and has shown over 330,000 people how to get rid of spam in Google Analytics reporting.
The process in summary, proven effective for over 24 months:
- Have a new website? Use a ‘-2’ or higher property
- Implement a Valid Hostname Filter to eliminate ghost visits
- Implement Spam Crawler Filters to eliminate the targeted spam visits
- Create a Custom Segment with these filters to use for reporting
- Turn on Google’s bot & spider filter option
All the information you need is provided below in this step-by-step guide, but you will need to update the filters as they change.
|
|
Scooped by
Marteq
|
Marketers will be more accountable than ever. The mindset shift means moving beyond the KPIs we have been used to and connecting the dots across from strategy to execution to performance. This means starting with the business goals and tracing the path to determine the key variables that lead to those goals. It also means injecting more information to better inform communication strategies:
- Qualified leads: Use behavioral and social data to verify prospect leads and identify false positives.
- Enrich customer profiles: leverage behavioral and profiling information to enhance knowledge about your customers.
- Machine learning will also enable scoring systems to develop best-fit models that define audience segments, product matches, affinities and customer value.
- Developing an end-to-end accountable framework: Acquisition to retention will require continuous optimizations based on updated market and customer data to improve performance.
|
|
Scooped by
Marteq
|
*Create the role of chief analytics officer -- Employed by organizations in diverse industries, including Duke University Heath Center, Macy’s, GoDaddy, EY, and even the City of New York, this role is responsible for mapping analytics needs and use cases throughout an organization. With a direct line to the C-suite, chief analytics officers match business needs and problems with analytics technology for answers.
*Form a cross-functional analytics team -- Bringing HR, marketing and other functional personnel together with IT can be one of the most beneficial ways to bridge the gap between IT and end users. Enabling these users to become citizen data scientists and use predictive analytics for their own unique needs creates meaningful results for everyone involved.
|
|
Scooped by
Marteq
|
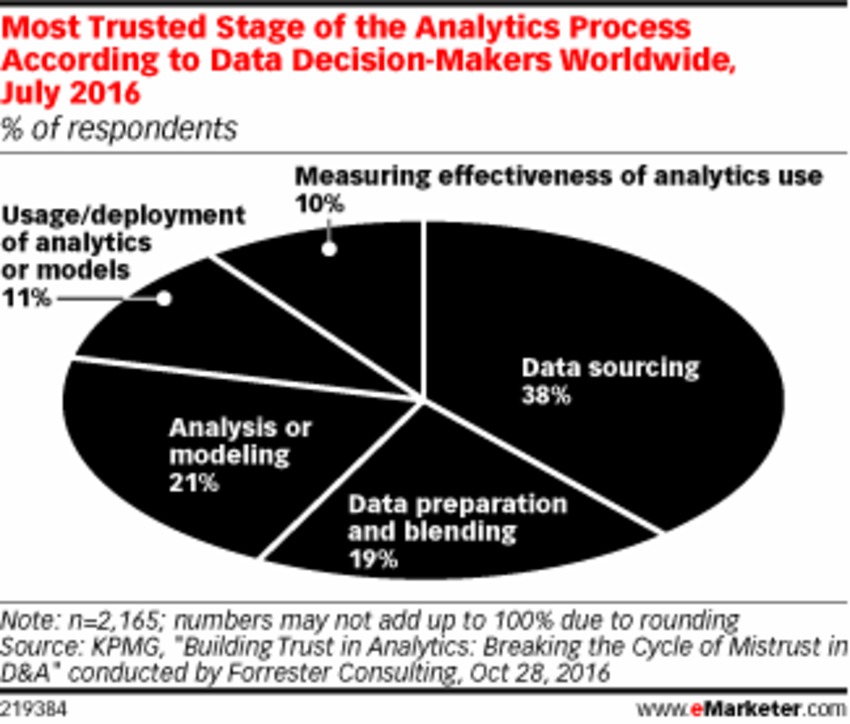
Many executives are raising questions about the reliability of the processes used to gather information. This is in addition to growing concerns about how best to maintain the privacy of their customers while doing so.
According to a July 2016 report by KPMG, which looked at how marketers could “build more trust” into their analytics and data-gathering processes, one problem with current analytics methods is executives aren’t always confident in the results. When asked about the most trusted stage of their analytics-gathering process, 38% said it was the very first step, which was data sourcing. For every stage of the process after that, marketers said they had significant doubts. Only 21% of executives said they trusted their analysis or data modeling, while just 10% said they trusted how they were currently measuring the effectiveness of their analytics efforts.
|
|
Scooped by
Marteq
|
Adoption of unified marketing impact analytics (UMIA) is growing as marketers prioritize creating a data-driven approach to marketing investment decisions and realize the importance of maintaining a 360-degree view of customer interactions.
UMIA requires buy-in and coordination from all corners of the organization. This report specifically maps out how the internal marketing, customer analytics, technology, and finance organizations, along with third-party partners should divvy up responsibility in tackling marketing measurement.
|
|
Scooped by
Marteq
|
1. Clicktale
2. Indicative
3. GoSquared
4. CAKE
5. Demand Jump
6. Bitly
7. Google Analytics
8. Hive Marketing Cloud
9. Conversion Logic
10. Kissmetrics
|
|
Scooped by
Marteq
|
Cross-channel marketing attribution software provider Visual IQ has acquired Refined Labs, a German attribution and customer journey analytics provider. The new partnership will strengthen Visual IQ's global offerings to businesses of all sizes and advertising spends.
Based in Munich, Refined Labs provides advanced measurement, search performance management and TV measurement solutions to help marketers optimize their ROI. With the addition to Visual IQ's IQ Intelligence Suite, marketers will be able to understand better the complex customer journey and how best to allocate spend across channels and devices.
|
|
Scooped by
Marteq
|
Simply put, Search Analytics for Sheets is a (completely free) Google Sheets add-on that allows you to fetch data from GSC (via its API), grouped and filtered to your liking, and create automated monthly backups.
If your interest is piqued, installing the add-on is fairly simple. Either install it from the Chrome Web Store, or:
- Open a Google spreadsheet
- Go to Add-ons -> Get add-ons
- Search for Search Analytics for Sheets
- Install it (It'll ask you to authorize a bunch of stuff, but you can sleep safe: The add-on has been reviewed by Google and no data is being saved/monitored/used in any other way except grabbing it and putting it in your spreadsheets).
|
|
Scooped by
Marteq
|
1. Always Start by Setting Your Objective(s)
2. Define Your Data Model
Now that you set your objective(s), it’s critical to make sure you have the data you need in order to report the success of your campaign or program. If you don’t have the data, you won’t be able to report back to your business that the investment made will deliver positive ROI. The good news is, you can start small and refine it as you become more sophisticated in your segmentation and targeting strategies. Going back to the re-engagement program, in order to report on whether you achieved the objective set, you’ll need to be able to identify and flag the inactive group prior to shipping your campaign out of the door.
3. Define the Metrics & KPIs
4. Develop a Reporting Plan (Align Reports x Stakeholders)
5. Don’t Forget to Capture Your Learnings
|
|
Scooped by
Marteq
|
|
|
Scooped by
Marteq
|
Salesforce announced the Wave Analytics for B2B Marketing app, a new Salesforce Wave Analytics app that will enable users to dive deeper into marketing, CRM and third-party data and empower them to gain new insights into campaign performance to maximize marketing efforts.
Wave for B2B Marketing is the only out-of-the-box marketing analytics solution specifically for Salesforce customers that provides marketers with a consolidated view of the marketing and CRM data that matters most to them — including lead volume, lead to opportunity conversion rates, pipeline velocity, and campaign ROI. Customers can also pull in data from third-party solutions like Google Analytics, and webinar and event management platforms, to get a complete view of all marketing efforts. Customers get pre-built dashboards that show high-level metrics for heads of marketing as well as more tactical metrics for front-line marketers, but also have the power to create customer dashboards based on specific roles.
Marketers don’t measure just to report. They measure to improve. With Wave for B2B Marketing, marketers can easily dissect data to understand how their campaigns are performing and quickly make adjustments to improve — without the need for a dedicated analytics expert.
Marketers can easily share snapshots of data and insights directly from the app, and work with sales to take immediate action as a team to turn more prospects into customers, across any device — desktop, tablet, or mobile phone.
|
|
Scooped by
Marteq
|
|
|
Scooped by
Marteq
|
Historical analytics
Today, Google Analytics is the most common of these tools. It’s great at telling you what happened yesterday, last week, last month. How did our marketing efforts perform? When used correctly, it allows you to adjust your marketing plan, as historical evidence demonstrates you’re not going to reach your goal in time.
Real-time analytics
Savvy marketers are now starting to embrace real-time analytics. No longer do they have to wait until the next day or week to see the impact their marketing efforts are having. When used correctly, real-time analytics not only allows for quicker adjustments to marketing plans, it can also save thousands of dollars by killing efforts that fail right from the start or by giving a boost to those that are working. This ensures a higher ROI than if you waited a few days to review the data.
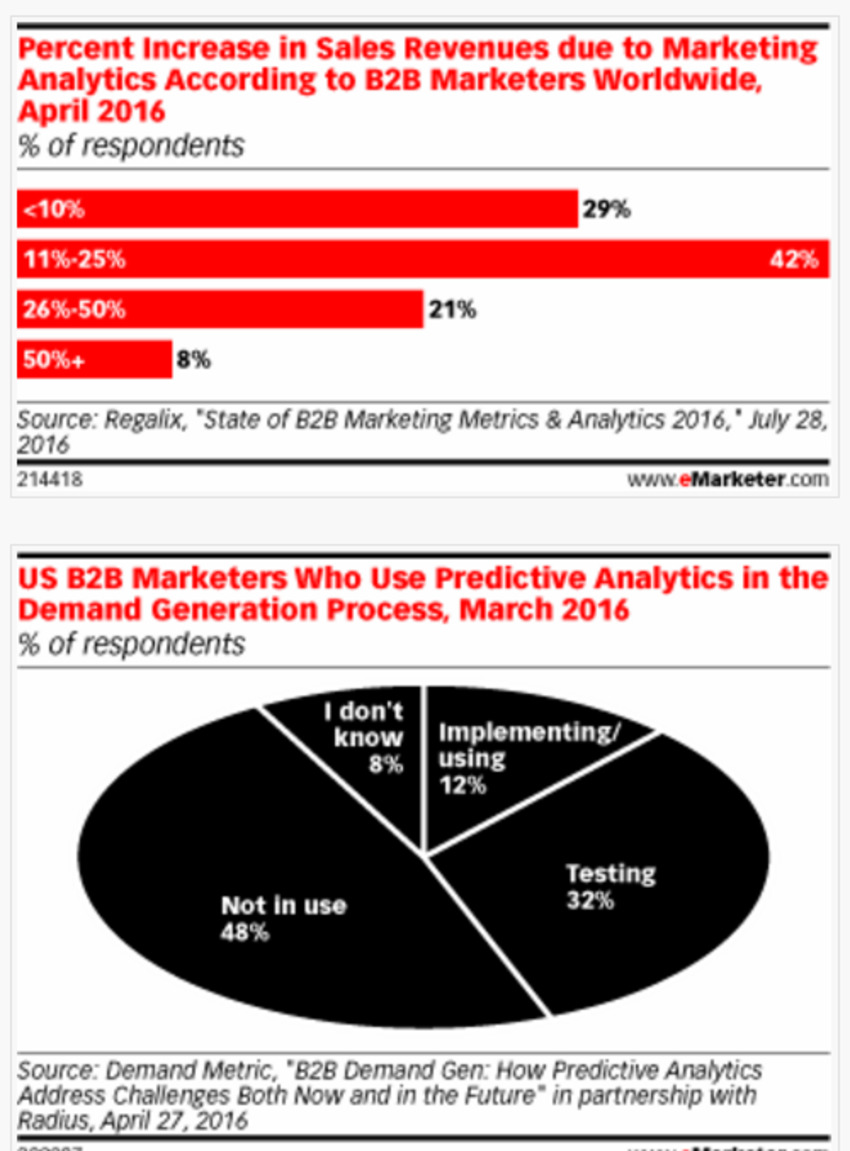
Predictive analytics
The best way to explain predictive analytics is that it’s the next generation of analytics, leveraging the power of historical and real-time analytics. Today, analysts can leverage the power of real-time analytics, making near-instant adjustments to their forecasts and allowing a nimble marketing team to make adaptations to their campaigns on the fly, avoiding potential disasters.
|
|
Scooped by
Marteq
|
Which One Is Right for Your Business?
Both attribution and marketing mix modeling offer marketers valuable insights into how their marketing investments are performing. The best approach for your business depends on your objectives and KPIs. It may be attribution, MMM, or a combination of the two, such as unified marketing impact analytics—more on that later.
Key Strengths
MMM: Breadth—the ability to analyze offline variables, including those outside of the marketer's control, alongside planning, spending, and performance metrics in a single view. MMM is particularly effective for "push" marketing tactics driven by specific events from which customer reactions are spread over a relatively short period of time. It also excels at quantifying the financial value of brand ads.
Attribution: Speed—the ability to understand how channels, tactics, and spend are performing on a daily basis, particularly for "pull" marketing, when the event is triggered by the customer. Attribution enables marketers to update campaigns on the fly, such as shifting budget by tactic, as well as glean long-term insights around scenario planning and forecasting. The granular view also allows for insights not possible from a higher perspective, including subtle synergies between channels and the ability to allocate revenue to channels proportional to impact.
|
|
Scooped by
Marteq
|
Perhaps the key metric of relevance is how well you actually solve the problems that your audience are experiencing. If your content answers a query in an effective manner, then you are delivering precisely the sort of user experience that search engines want to promote.
How you tangibly measure this will sometimes depend on the query that you are serving. A very simple query can be served extremely quickly with a single page, whereas more in depth queries will require much more detailed, long-form content.
Using another of our internal tools, known as Roadmap, we can start to identify correlations between both known and potential ranking factors, with high search ranking positions. The more strongly that high-ranking websites score for particular factors, the stronger the correlation.
The graph above demonstrates how particular factors, in this case those that are indicative of a strong user experience, with higher search engine rankings, correlate with higher search ranking positions.
|
|
Scooped by
Marteq
|
Marketing Strategy - B2B marketers say the most important goal of their data management strategy is to improve ROI measurability, according to recent research from Openprise and Ascend2.
|
|
Scooped by
Marteq
|
Marketers unanimously agree on the need for analytics, but not all are as yet committed to investing in it. All the respondents we spoke with agreed that marketing analytics was important for
their marketing success. 84% of them rated it as very important; the remaining 16% rated it as somewhat important.
|
|
Scooped by
Marteq
|
- Head on over to the Admin section of Google Analytics and scroll down to Calculated Metrics. Select ‘Percent’ as Formatting Type.
- Start typing the name of the goal in the Formula field and it should appear in a dropdown. Select it. Space. ‘/’. Start typing users and select it as well.
- Name your metric — ‘goal name’ by users CVR and hit Create.
|
|
Scooped by
Marteq
|
1. Start with a plan
2. Be sure you’re capturing all the data you need
3.Create the right reports for the right stakeholders
Bonus tip: check out the recently launched Google Data Studio to make beautiful dashboards from all our data sources for free.
4. Always include an executive summary with anticipated reports
5. Start to learn and become proficient in marketing forecasting
|
|
Scooped by
Marteq
|
Engagement Reporting
Heatmapping & Click Tracking
Email Client Tracking
Subscriber- Level Report
Geolocation Reporting
|
|
Scooped by
Marteq
|
Why is this happening?
Over-reliance on IT:
One issue that often hinders adoption of new analytical tools is that many platforms being implemented are heavily dependent on IT for day-to-day operations.
Too Many Systems in Place:
When modern data discovery tools begin to stutter under the pressures of complex data, companies are channeled into purchasing additional, specialized tools to provide stronger back-end capabilities. However, each of these software stacks will, in turn, require increasingly large technical resources to maintain—both on its own, and as a working part of the complete "assembly line" the company now employs to turn raw data into useable information.
|
|
Scooped by
Marteq
|
If you are a data analyst that wants to access your data with SQL check Mode Analytics and Periscope. for open source kind check Re:dash
If you need quick, useful and beautiful dashboards check Geckoboard and Geckoboard. Want to take it a bit further? Check Leftronic and Klipfolio.
Not an SQL-savvy user? Check Chartio
Are you a data analyst that wants to easily explore your data sets? Check Looker
Want to have the best visualizations? Check Tableau.
|
|
Scooped by
Marteq
|
UTM stands for Urchin Tracking Module. The name is a holdover from back in the day before Google Analytics (GA) was around. Urchin was a web analytics program acquired by Google back in 2005, which marked the beginning of GA.
UTM codes are simple snippets of code appended to the end of URLs that communicate with the GA code on your website. Essentially, UTM codes allow you to track where traffic to your site originated in GA.
Simply put, without proper tracking, you are flying blind. The key word there is “proper.” Simply having GA installed on your site isn’t enough. You need to empower the tool by setting up proper tracking parameters for all your marketing campaigns.
|
|
Scooped by
Marteq
|
Performance metrics are all impacted. Making matters worse, nothing is in place for marketing teams to manually check their site traffic quality. Gauging the impact bots have on performance metrics is guesswork.
Well-known performance and analytics tools include:
Analytics and tracking – Google Analytics, MixPanel, Adobe Marketing Cloud, and Kissmetrics
Performance and attribution – Bizible, Adaptive Insights, and Beckon
Testing and optimization – Optimizely, On Interactive, and Webtrends
|
|


And CT for the answers...
marketingIO: MarTech for B2B Marketers. Strategy, Software, Services, Support, Staffing. Go here to submit RFQs. #MarTech #DigitalMarketing