


 Your new post is loading...

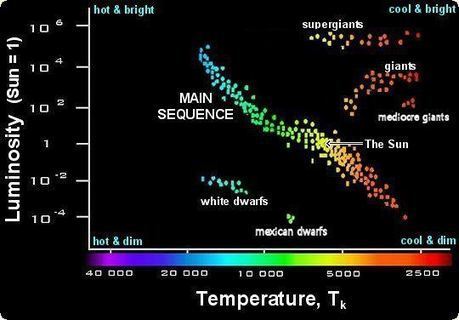

The Hertzsprung Russell Diagram is the “Rosetta Stone” of stellar astronomy and it’s simple, very simple. So to put it simply, it’s just a graph that plots lots of stars’ luminosities against their surface temperatures. As simple as that sounds, it is the key to understanding stellar evolution.
In case you thought “Rosetta Stone” is some sort of educational software for travelers, it is. But it’s also an actual stone that Indiana Jones or somebody like that found in Egypt that explains Obamacare in three languages. It sat around in a basement until some anthro-geek was rummaging around and realized we could use it to learn hieroglyphics. Before that no one knew what all those little hieroglyphic symbols meant. Two squiggly lines? A guy with a bird head? What the hell?
The stone dates back to olden times when they didn’t have Internet so the king would update his status by having a big stone tablet put in the town square. It was like an iPad but faster. It would be in several languages because they didn’t have Google Translate either.


