

You don’t need to be a seasoned data scientist or have a degree in graphic design in order to create incredible data visualisations.
Via Baiba Svenca
Get Started for FREE
Sign up with Facebook Sign up with X
I don't have a Facebook or a X account


 Your new post is loading...
 Your new post is loading...
Your new post is loading...
You don’t need to be a seasoned data scientist or have a degree in graphic design in order to create incredible data visualisations. Via Baiba Svenca 

Baiba Svenca's curator insight,
March 15, 2013 11:20 AM
Chartle is a free interactive chart creation tool using Java which works online, you don't need to download it. No registration. When your chart is ready, you can publish it or embed it on your website. Because of its simplicity, it is great for using with students. 
Christine Bushong's curator insight,
March 19, 2013 9:25 AM
Free. No registration. Publish or embed.
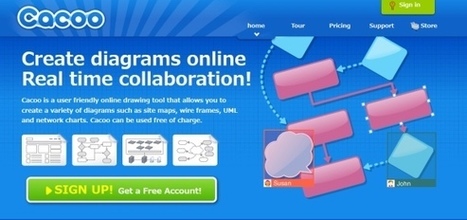
Cacoo enables creating both diagrams and presentations online, which can be saved in Microsoft PowerPoint and other formats... Via Baiba Svenca, Marisa Conde, juandoming, Mariano Fernandez S.
|
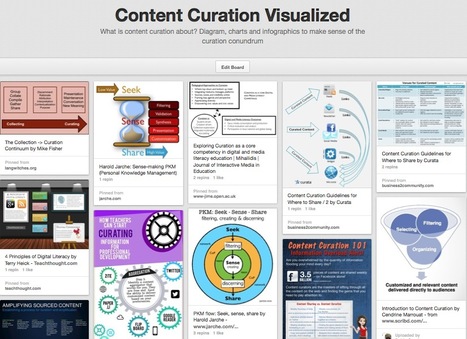
What is content curation about? Diagram, charts and infographics to make sense of the curation conundrum Via Robin Good, Ana Rodera

Monica S Mcfeeters's curator insight,
March 30, 2014 9:18 AM
This will be helpful to share to those wondering about content curation. 
Jeff Domansky's curator insight,
September 1, 2014 11:53 PM
Valuable collection of the art of curation from Robin Good.

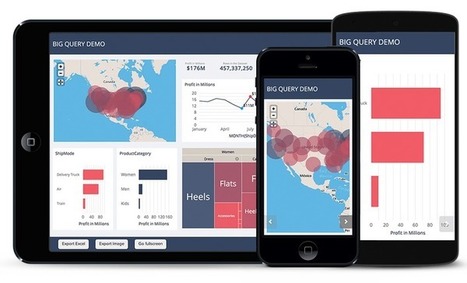
iCharts accelerates data storytelling with simplistic, interactive, visualization tools for big and small data providers. Via Baiba Svenca

Sue Gould's curator insight,
March 6, 2013 6:34 PM
There is an emerging learning trend towards visual stimulus as a result of growing up with videos, TV, and technology from barbie laptops to Ipads. This is a great resource for tutors to reach this audience while using few words. 
Robert Sims's curator insight,
March 15, 2013 5:07 PM
Here's a great tool for building up the Taxonomy usage in your classroom!
|


Ca donne envie d'essayer : nuage de mots, graphiques, cartes... Par Christopher Ratcliff @ Econsultancy publié le 25/02
Check out how to add visualisations to your presentations.
197