Stage 5 Changing Places
8.7K views | +0 today
Follow
Stage 5  Changing Places
Resources  linked to the NSW Geography Syllabus K - 10  
Curated by GTANSW & ACT
Your new post is loading...
Scooped by GTANSW & ACT
Scoop.it!

Coastal Hazard Threat Map

Coastal Hazard Threat Map | Stage 5  Changing Places | Scoop.it

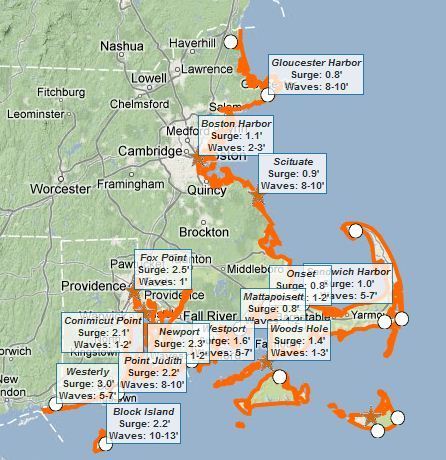
This interactive map of coastal Massachusetts and Rhode Island shows some basic flooding data including: 1) where are the flood warnings (essential the entire coastline), 2) how high the storm surge is, and 3) how high the waves are.


Tags: Rhode Island, water, disasters, geospatial.

No comment yet.
Scooped by GTANSW & ACT
Scoop.it!

Google Earth in China

Google Earth in China | Stage 5  Changing Places | Scoop.it

This gallery of Google Earth Screen shots primarily from Yunnan Province in Southern China (bordering Vietnam and Burma) . 


This is a great example of using geospatial technologies to interpret the cultural landscape--the merger of 'people and pixels' as the textbook of the same name encourages with classrooms.  

Jessica Rieman's curator insight, April 23, 2014 4:44 PM

In this description followed by images there are all types of vintage points in order to show a clear image of where in relation a time and place a certain society/ country is and to give some background info on what you are looking at by seeing it in multiple images.

Scooped by GTANSW & ACT
Scoop.it!

Satellite Images of Urban Sprawl

Satellite Images of Urban Sprawl | Stage 5  Changing Places | Scoop.it
The past century has been defined by an epic migration of people from rural areas to the city. In 2008, for the first time in history, more of the Earth's population was living in cities than in the countryside.


 The 'slide bar' in the middle allows the viewer to scroll between before and after images of major metropolitan areas that have experienced dramatic growth in the last 10-30 years. 


The attached images is on Dubai, UAE.  Notice the man-made islands, especially the 'archipelago' in the shape of the world that is 2.5 miles off the coast of Dubai.

No comment yet.
Scooped by GTANSW & ACT
Scoop.it!

What Doesn't Stay in Vegas? Sprawl.

This NASA-produced timelapse video of Landsat data shows the spatial spread of the Las Vegas metropolitan area from 1975-2010. 


These are not true color images, but false color that shows the near infrared portions of the electromagnetic spectrum as red in the image. 


Geospatial technologies are once again, shown as invaluable in our analysis of the urban environment.   

Daniel Lindahl's curator insight, May 25, 2015 1:55 PM

This article illustrates not only Las Vegas's sprawl, but also Vegas-style diffusion. By creating a time-lapse, a clear illustration of Vegas's diffusion is shown.