Infographics, when used correctly, appropriately, are powerful tools for conveying a lot of pertinent information plus they support visual learning and thinking. I curate a Scoopit on Infographics...
Beth Dichter's insight:
Jackie Gerstein shares her top picks for education infographics this year. Some of these have been shared in this Scoop.it but many are new. The list of infographics includes:
* The Internet Access Gap in Education
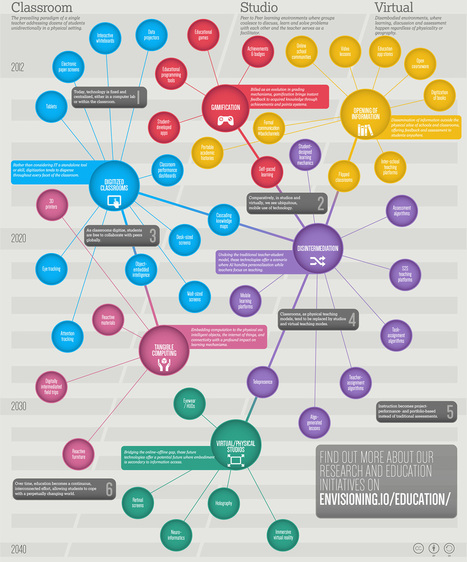
* The Past, Present and Future of Education
* State of Creativity in Education: An Adobe Survey
* The Gamification of Education
* Tapping into Mobile Learning
* Investing in Girls' Education Pays Off
Many of these would be useful as topics for discussion or to use to teach students why infographics are useful in displaying data.
Via
Beth Dichter


 Your new post is loading...


![SEVEN STEPS TO THE PERFECT STORY [Fun Infographic] | Scriveners' Trappings | Scoop.it](https://img.scoop.it/ZZ1mD2k-gErgFwW96DHNhzl72eJkfbmt4t8yenImKBVvK0kTmF0xjctABnaLJIm9)